Supplemental Digital Content is available in the text
Abstract
The relationship between type 2 diabetes and gout is complex. The objective of this study was to understand the role of diabetes itself and its comorbidities within the association between type 2 diabetes and gout.
We conducted a retrospective cohort study using the UK Clinical Practice Research Datalink (CPRD) GOLD. Persons with type 2 diabetes were identified as persons on a noninsulin antidiabetic drug (NIAD) between 2004 and 2012, and were matched to 1 control based on age, sex, and general practice. We estimated gout risk in NIAD users using Cox regression analysis. All analyses were stratified for sex.
In total, 221,117 NIAD users were identified. NIAD users had an increased risk of gout (hazard ratio (HR) 1.48; 95% CI 1.41–1.54). This association was stronger in women (HR 2.23; 95% CI 2.07–2.41) compared with men (HR 1.19; 95% CI 1.13–1.26). After adjustments for BMI, eGFR, hypertension, renal transplantation, diuretics, statins, low-dose aspirin, ciclosporin, and tacrolimus, the risk disappeared in women (HR 1.01; 95% CI 0.92–1.11) and reversed in men (HR 0.61; 95% CI 0.58–0.66) (P for interaction <0.001). When stratifying gout risk according to HbA1c in male and female NIAD users, we found an inverse association between raising HbA1c and incident gout in men only. Further adjustment gave similar results.
Individuals with type 2 diabetes are at increased risk of gout. This is not due to diabetes itself, but to the comorbid conditions. Diabetes itself is apparently associated with a decreased risk of gout, especially in men.
INTRODUCTION
Gout is the most common inflammatory joint disease worldwide and affects up to 1–2% of adults in Western societies.1 The disease has been associated with multiple comorbidities, including type 2 diabetes. However, the relationship between type 2 diabetes and gout is complex as several pathophysiological mechanisms that occur in diabetes can have opposite effects on the risk of gout.2–5
On the one hand, diabetes may be associated with an increased risk of gout. As compared with the general population, individuals with type 2 diabetes generally have a higher body mass index (BMI), an increased prevalence of hypertension,6 and a decline in renal function.7 These comorbid conditions are well known risk factors of gout.8,9 Indeed, higher prevalences of gout have been identified in individuals with type 2 diabetes.2,3 On the other hand, studies have shown lower uric acid concentrations in individuals with type 2 diabetes compared with those without diabetes, suggesting a lower risk of gout.10,11 Glycosuria, which occurs when blood glucose levels rise above ∼10 mmol/L,11 has been suggested to be the underlying mechanism for these low concentrations.12 An impaired inflammatory response in individuals with type 2 diabetes may further protect against the development of gout.4 In agreement, a case-control study in The Health Improvement Network (THIN), a British primary care database, has shown that individuals with type 2 diabetes are at a lower risk of gout than controls.4 This risk was even lower if diabetes was poorly controlled.5
In view of the above, the objective of this study was to determine the risk of gout in individuals with type 2 diabetes as compared with population-based controls, and to understand the role of diabetes itself and its comorbidities within gout risk. As it has been suggested that risk factors for gout are more prevalent in women with type 2 diabetes than in men,13 we additionally investigated potential sex-related differences in the association between type 2 diabetes and incident gout.
METHODS
Data Source
Using data from the CPRD GOLD, we performed a retrospective cohort study. CPRD GOLD contains computerized medical records of general practitioners in the UK and is formerly known as the General Practice Research Database. Currently, the database includes data on more than 13 million individuals from 678 practices in England, Northern Ireland, Scotland, and Wales. The data comprise demographic information, data on lifestyle, prescription details, clinical events, specialist referrals, and hospital admissions and major outcomes. In addition, CPRD GOLD contains data on indicators of the Quality and Outcomes Framework (QOF) since 2004. The QOF is an incentive scheme for general practitioners (GPs) to increase the quality of recording of indicators of various diseases, including diabetes mellitus. This has resulted in the recording of smoking status and body mass index (BMI) of 90–95% individuals in CPRD. For persons with diabetes, the QOF awards recent recording of variables such as HbA1c, eGFR, BMI, and smoking status. The GPRD Group has obtained ethical approval from a multicentre research ethics committee for all purely observational research using anonymized records from the general practice research database. This study was approved by the general practice research database Independent Scientific Advisory Committee.
Study Population
To select individuals with type 2 diabetes, we identified all persons aged 18 years or older who received at least 1 prescription for a noninsulin antidiabetic drug (NIAD) recorded between April 1, 2004 and August 31, 2012. NIADs included metformin, sulphonurea derivatives, incretin agents, meglitinides, thiazolidinediones, and acarbose. The index date was defined as the date of the first NIAD prescription since the start of the study period. The study population included, therefore, both prevalent and incident NIAD users. After start of valid data collection, each NIAD user was matched with 1 randomly selected control by sex, year of birth (within 5 years), and practice. The controls were individuals without an NIAD or insulin prescription during the whole study period. Every control was assigned the index date of its matched NIAD user. All individuals were then followed up from their index date until the date of death, end of data collection (August 31, 2012), the date of transfer of the person out of the practice, or the end date of data collection of the practice in CPRD, whichever came first. At baseline, individuals were excluded from the analysis if they had a history of gout, or if they had used colchicine, allopurinol, probenecid, benzbromaron, febuxostat, rasburicase, sulfinpyrazone, or pegloticase before or on the index date.
Exposure
The follow-up time of the NIAD users was divided into intervals based on the length of NIAD prescriptions, that is, for every prescription a new interval was created. This person-time was classified as “current NIAD use.” After a washout period exceeding 90 days, person-time was considered “past NIAD use.” When a new NIAD was prescribed, person-time was considered “current NIAD use” again. The follow-up time of controls was divided into intervals of 90 days.
Study Outcome and Covariates
Outcome of interest was the first-time clinical diagnosis of gout, identified using READ codes. READ codes are a set of clinical codes used in primary care in the UK for the registration of clinical diagnosis, processes of care (tests, screening, symptoms, patient administration, etc.), and medication. This case definition has previously been validated by analysis of medical records and laboratory results of a sample of 38 antiulcer drug exposed subjects with a first-time diagnosis of gout.14
The following variables were assessed in the period before the index date, using dummy variables: sex, smoking status (never/current/past/unknown), BMI (classified according to the World Health Organization),15 and alcohol use (yes/no/unknown). At each time interval we assessed age, eGFR, and whether individuals had a history of hypertension, underwent a renal transplantation, or had a postmenopausal status/oophorectomy. In addition, the following variables were determined 6 months before the start of each time interval: the use of insulin, thiazide diuretics, loop diuretics, low dose aspirin (≤100 mg), ciclosporin, tacrolimus, or statins.
Statistical Analysis
All statistical analyses were performed with SAS 9.2. Results were considered significant if P value was <0.05. We estimated incidence rates (IRs) of gout between April 1, 2004 and August 31, 2012 in NIAD and non-NIAD users. IRs were calculated as the number of incident cases divided by the total number of person-years (PYs) at risk. Using time-dependent Cox proportional hazard models we estimated hazard ratios (HRs) for the risk of developing gout in NIAD users (with and without insulin use) versus controls, by sex and by age (<50 years and ≥50 years). The age-sex adjusted hazard ratios (model 1) were first adjusted for smoking status, alcohol use, and postmenopausal status/oophorectomy (model 2). Thereafter, we adjusted for variables that theoretically may act as intermediates, that is, BMI, eGFR, hypertension, and the use of thiazide diuretics, loop diuretics, statins, low-dose aspirin (≤100 mg), renal transplantation, ciclosporin, and tacrolimus (model 3). Model 3 was also repeated in men and women according to age (<50 years and ≥ 50 years). In addition, to further examine the gout risk in NIAD users, we performed subgroup analyses by HbA1c. We classified HbA1c values into the following categories to increase comparability with a previous study:14 <6% (<42 mmol/mol), 6–6.9% (42–52 mmol/mol), 7–7.9% (53–63 mmol/mol), 8–8.9% (64–74 mmol/mol), ≥9% (≥75 mmol/mol), and missing. When covariates were missing, the cases were analyzed in a separate “missing” group. All analyses were stratified by sex.
To explore the influence of misclassification, we performed a sensitivity analysis in which the case-definition of gout was restricted to those individuals with a diagnosis (READ code) of gout and at least 1 prescription for its treatment: colchicine, allopurinol, nonsteroidal anti-inflammatory drug (NSAID), systemic glucocorticoid, probenecid, benzbromaron, febuxostat, rasburicase, sulfinpyrazone, or pegloticase, within 14 days before or after a registration of a gout diagnosis. The earliest recording of the gout diagnosis or its treatment after the start of follow-up defined the outcome.
RESULTS
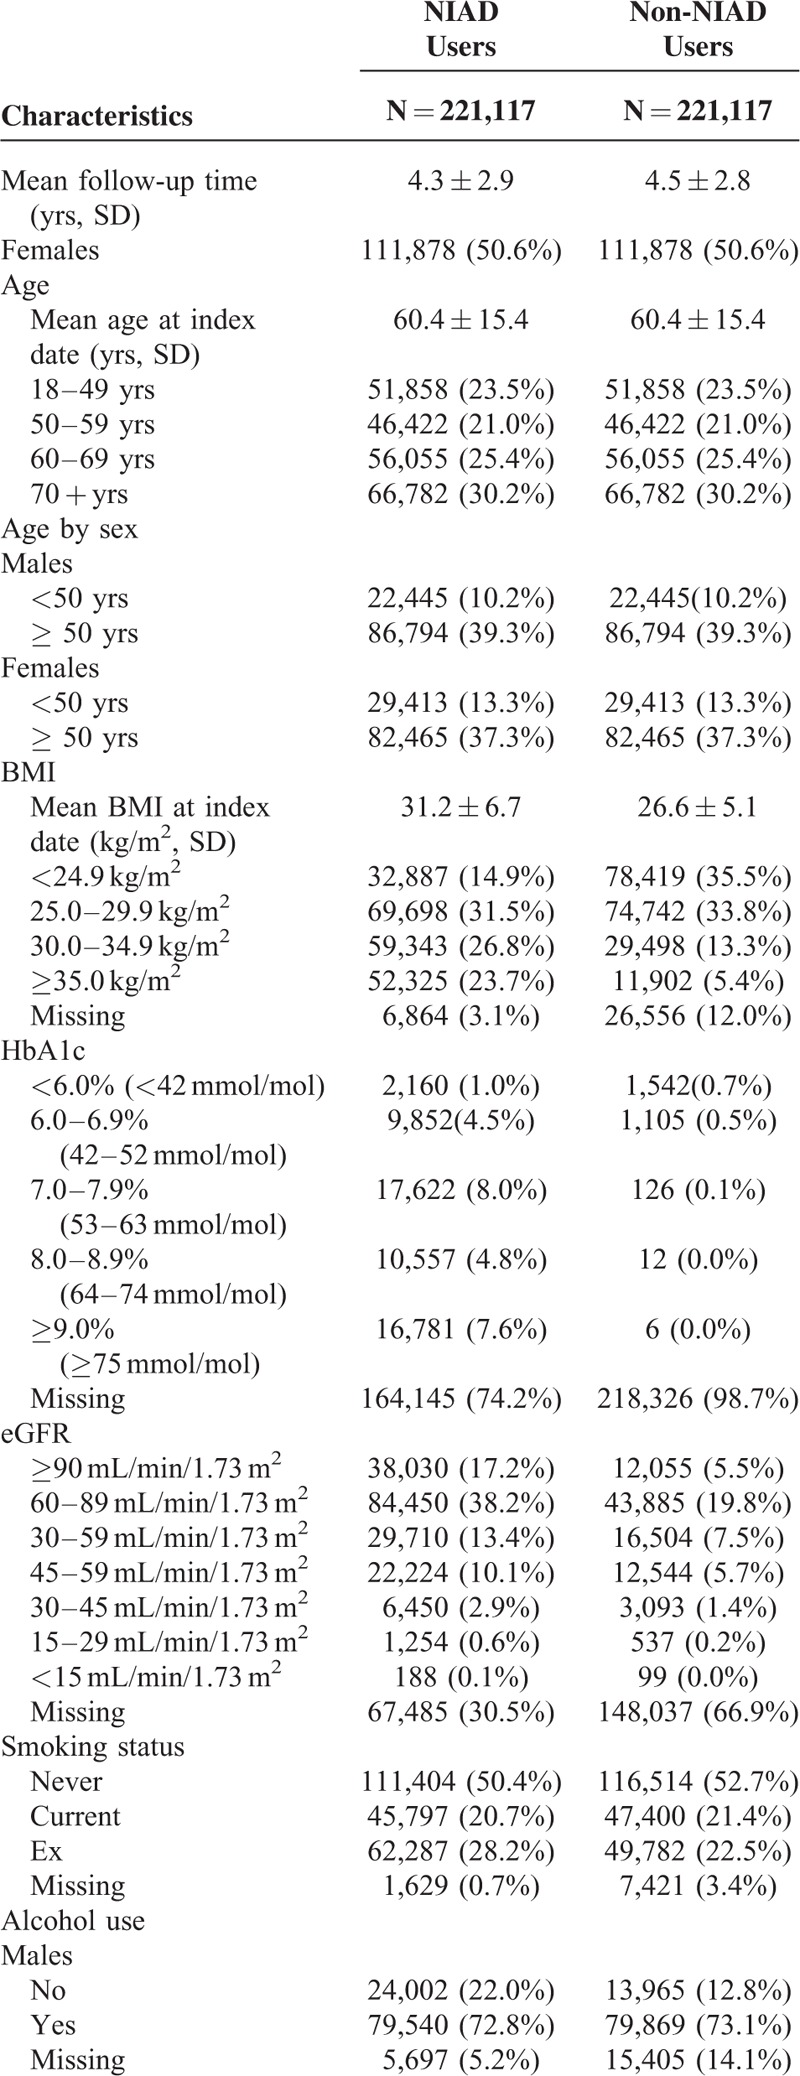
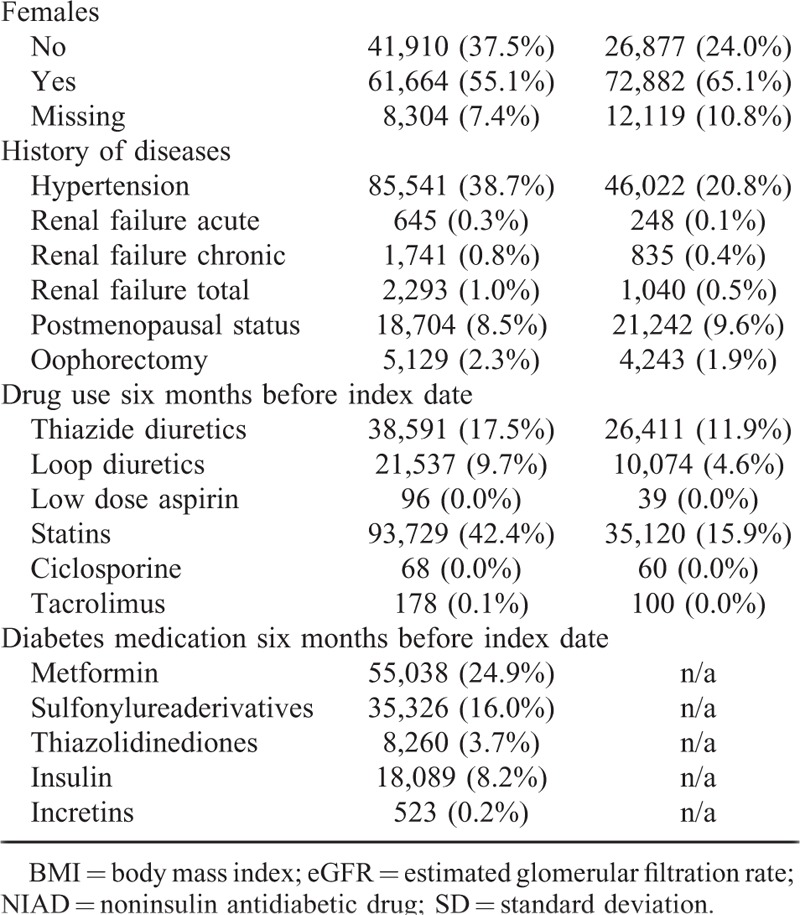
Figure 1 shows how the final study population was defined. Table 1 shows the baseline characteristics of the study population. Since NIAD users with insulin did not significantly differ from NIAD users without insulin (data not shown), we combined the results of these subgroups into a single NIAD users group. As a result, the cohort encompassed 221,117 NIAD users and a similar number of controls with a mean age of 60.4 ± 15.4 years, of whom 50.6% were women. The mean duration of follow-up was 4.3 years among NIAD users and 4.5 years among controls. On average, NIAD users had a higher BMI, suffered more frequently of hypertension, and more often had used statins. As compared with males, female NIAD users had a higher BMI, more often had an eGFR below 60 mL/min/1.73 m, and more often had hypertension (supplementary Tables 1 and 2, http://links.lww.com/MD/A379). HbA1c concentrations were slightly lower in women at baseline. In addition, the differences in mean BMI and the proportion of individuals with an eGFR below 60 mL/min/1.73 m2 in NIAD users as compared with controls were larger in women.
FIGURE 1.
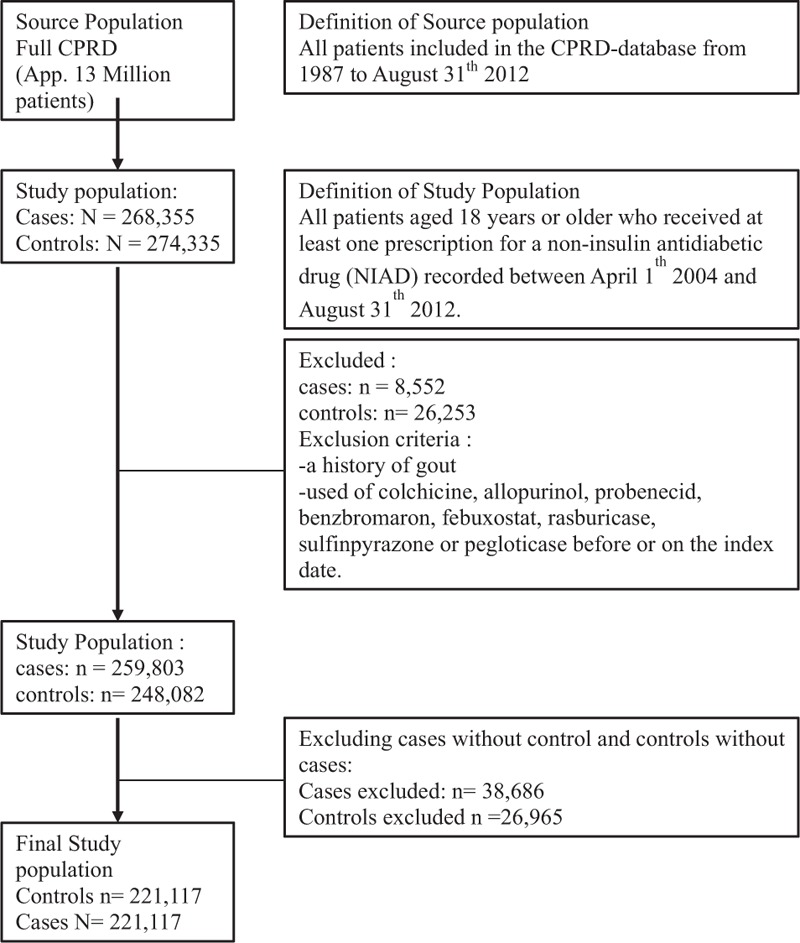
Flowchart participants selection.
TABLE 1.
Baseline Characteristics of NIAD Users and Matched Non-NIAD Users
Risk of Gout in NIAD Users as Compared With Controls
Table 2 shows that current NIAD use was associated with a 1.5-fold age- and sex-adjusted increased risk of gout (HR 1.48; 95% CI 1.41–1.54) (model 1). This result only slightly changed after adjustment for confounding variables in model 2, including smoking status, alcohol use, and postmenopausal status/oophorectomy (HR 1.41; 95% CI 1.35–1.47). However, after full statistical adjustment, current NIAD use was no longer associated with an increased risk, but with a 27% reduced risk of gout (HR 0.73; 95% CI 0.69–0.77) (model 3). The following confounders were mainly responsible for this shift: BMI, the use of statins, the use of loop diuretics, and a history of hypertension.
TABLE 1 (Continued).
Baseline Characteristics of NIAD Users and Matched Non-NIAD Users
Sex modified the association between NIAD use and incident gout (P for interaction <0.001). Although both male and female users of NIADs had a higher age-adjusted risk of gout in comparison with their controls, the increased risk was more pronounced in women (HR 2.23 95% CI 2.07–2.41) than in men (HR 1.19 95% CI 1.13–1.26) (model 1). After full adjustments in model 3, male NIAD users had an almost 40% reduced risk of gout (HR 0.61; 95% CI 0.58–0.66), whereas in female NIAD users the risk disappeared (HR 1.01; 95% CI 0.92–1.11). After further stratification by age, female NIAD users aged <50 years (N = 29,413) had a 40% reduced risk of developing gout (HR 0.59; 95% CI 0.46–0.77) in comparison with their controls. In contrast, there was no difference in gout risk between female NIAD users aged 50 + years (N = 82,465) (HR 1.01; 95% CI 0.93–1.11) and controls. Both male NIAD users aged <50 years (N = 22,445) and 50 + years (N = 86,794) had an almost 40% reduced risk of gout as compared with their controls (respectively; HR 0.61 (95% CI 0.52–0.71) and HR 0.62 (95% CI 0.58–0.66).
Risk of Gout Among NIAD Users by HbA1c
Exploration of the influence of HbA1c on the risk of gout within NIAD users showed an inverse association between higher HbA1c values and gout risk (Table 3). As compared with NIAD users with a HbA1c <6.0% (<42 mmol/mol), the age- and sex-adjusted risk of gout was more than 20% reduced among those with recent HbA1c values of 8.0–8.9% (64–74 mmol/mol) (HR 0.75; 95% CI 0.63–0.90) and even almost 40% reduced among those with recent HbA1c ≥9.0% (≥75 mmol/mol) (HR 0.61; 95% CI 0.51–0.74). Further adjustment in models 2 and 3 gave similar results.
TABLE 2.
Risk of Gout in NIAD Users Compared With Controls
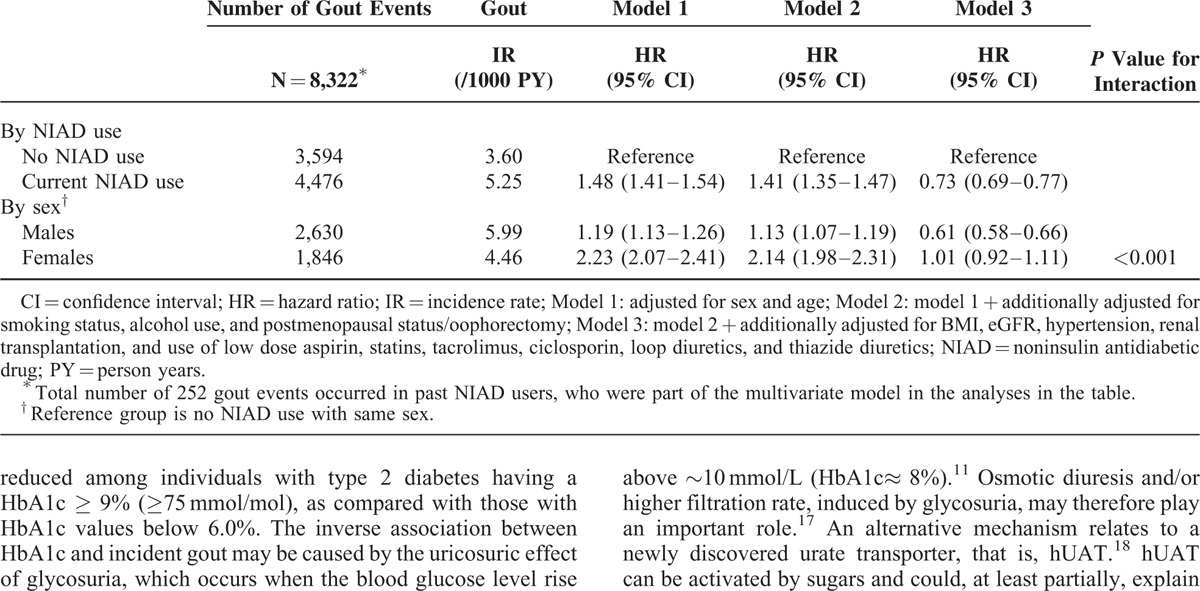
TABLE 3.
Risk of Gout in NIAD Users According to Hba1c Stratified by Sex
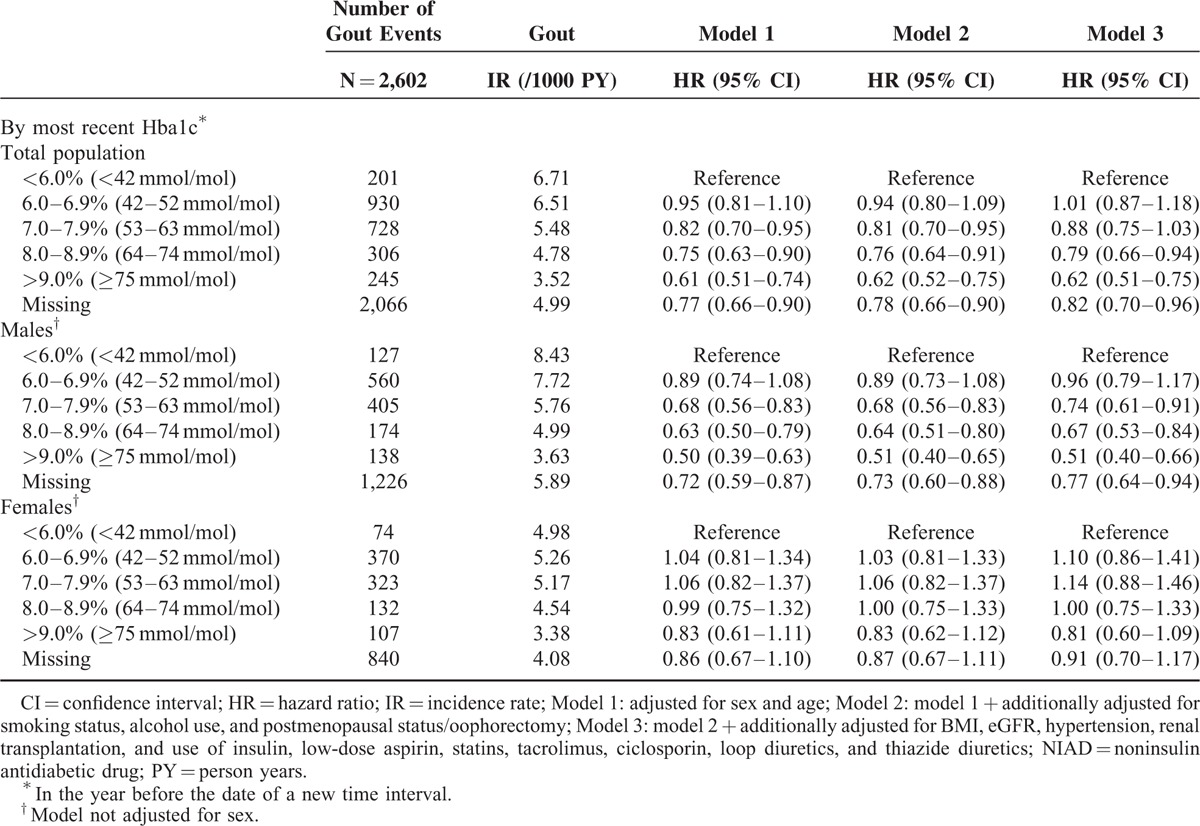
Subgroup analysis by sex, however, showed that higher HbA1c values were inversely associated with incident gout in male, but not in female NIAD users (P for interaction ≤0.01 for all categories). As compared with male NIAD users with HbA1c <6.0% (<42 mmol/mol), the age-adjusted risk of gout was more than 30% reduced among those with HbA1c values of 8.0–8.9% (64–74 mmol/mol) (HR 0.63; 95% CI 0.50–0.79) and even 50% reduced among those with HbA1c ≥9.0% (≥75 mmol/mol) (HR 0.50; 95% CI 0.39–0.63) (Table 3). Further adjustment in models 2 and 3 gave similar results.
Sensitivity Analysis
After changing the case-definition of gout from a READ code for gout to a READ code for gout and a prescription for gout-specific medication, the total number of gout events decreased by approximately 25%. Notwithstanding, after full adjustments, NIAD-users still had a decreased risk of developing gout (HR 0.67; 95% CI 0.63–0.72) as compared with controls. Men had a 40% reduced risk of gout (HR 0.58; 95% CI 0.54–0.63), whereas this was not the case in women (HR 0.92; 95% CI 0.83–1.02). Results were similar for the subgroups analyses according to HbA1c.
DISCUSSION
The relationship between type 2 diabetes and gout is complex. On the one hand, individuals with type 2 diabetes are at an increased risk of gout, possibly due to type 2 diabetes-associated comorbidities. On the other hand, the decreased inflammatory response and the uricosuric effect of glycosuria might protect against the development of gout. This study showed that individuals with type 2 diabetes, especially women, had a strongly increased risk to develop gout as compared with controls. However, this risk can be fully attributed to classic risk factors for gout (high BMI, hypertension, reduced renal function). Interestingly, when taking into account these factors, male but not female individuals with type 2 diabetes were in fact at lower risk to develop gout as compared with controls. The protective effect of type 2 diabetes in men could be attributed to high HbA1c levels.
Our main finding of a 40% increased risk of gout in individuals with type 2 diabetes supports the formerly identified higher prevalence of gout in these individuals as compared with controls.2,3 Classic risk factors for gout, which may partly mediate the association between type 2 diabetes and gout, are likely responsible for this additional risk. When accounting for gout risk factors such as hypertension, we found that individuals with type 2 diabetes had a 27% lower risk to develop gout. This finding is in line with the THIN study.4 Note that comparison of our unadjusted results with the THIN study was hampered due to the direct adjustment for the number of GP visits in the latter. The number of GP visits is a very nonspecific covariate and may reflect the presence or severity of comorbidities, such as hypertension and kidney failure. We want to emphasize that it is difficult to disentangle the role of variables in the association between type 2 diabetes and gout. Factors may theoretically act as a confounder, a mediator, or both. Careful assessment of the respective role may provide a more comprehensive picture of the association between type 2 diabetes and gout and can prevent confounded conclusions.
The role of increasing HbA1c concentrations to explain the reduced risk of gout in individuals with type 2 diabetes has been reported in 2 other studies.5,16 The risk of gout was almost 40% reduced among individuals with type 2 diabetes having a HbA1c ≥ 9% (≥75 mmol/mol), as compared with those with HbA1c values below 6.0%. The inverse association between HbA1c and incident gout may be caused by the uricosuric effect of glycosuria, which occurs when the blood glucose level rise above ∼10 mmol/L (HbA1c≈ 8%).11 Osmotic diuresis and/or higher filtration rate, induced by glycosuria, may therefore play an important role.17 An alternative mechanism relates to a newly discovered urate transporter, that is, hUAT.18 hUAT can be activated by sugars and could, at least partially, explain low uric acid concentrations in the presence of high glucose concentrations. However, the level of evidence for a role of hUAT in the renal urate transport is still weak.
Of interest are our sex-stratified analyses of the association between type 2 diabetes and HbA1c on the one hand and incident gout on the other hand. First, we showed that the increased risk of gout was more pronounced in women than in men. In the present study, females with type 2 diabetes had a higher prevalence of classic risk factors for gout as compared with their male counterparts. Also, the risk difference between individuals with type 2 diabetes and controls with regard to gout risk factors such as BMI and the proportion of individuals with an eGFR<60 mL/min/1.73 m2 was greater in women than it was in men. Less favorable CVD risk profiles in female than in male individuals with type 2 diabetes have been identified by prior studies.19–21 Second, we showed that after adjustment for classic risk factors, the risk for gout between women with type 2 diabetes compared with controls disappeared whereas the risk of gout in men became lower. Interestingly, further stratification for age (<50 years and ≥50 years) revealed that women younger than 50 years were also at lower risk of gout compared with women older than 50 years while such difference was not found in men. The decreased risk in men compared with women may be explained by a sex difference in the association between high HbA1c and incident gout in individuals with type 2 diabetes; a significant association between high HbA1c and a decreased risk of gout in men, but no association in women. It is unclear why HbA1c was only associated with a decreased gout risk in men. A possible hypothesis for this sex difference is a different effect of glucose on uric acid reabsorption in the kidney in men and women. The effect of sex on the association between HbA1c and incident gout clearly needs further exploration. The difference between women younger or older than 50-year old might be related to the menopausal status which might influence directly or indirectly the risk of gout. The menopausal status might also influence the risk of gout.22
Our study had several strengths. First, the findings of this study are likely to be generalizable to the general population as it was performed in a large UK general practice database. Second, a cohort design was used, which is the best observational design for determining the incidence of a certain condition. Third, we used data from 2004 onward. HbA1c and eGFR recordings have improved dramatically since 2004, because of GṔs incentives for routinely recording these data under the QOF. Finally, a validated algorithm (READ codes) for identifying a first-time diagnosis of gout was used.14 Our study had also several limitations. Despite a substantial number of missing values at baseline, HbA1c was regularly recorded for the majority of the individuals with type 2 diabetes over time. A detection bias may have occurred because persons with type 2 diabetes having higher HbA1c values may more often visit their GP as compared with those who are well-controlled. This could increase the likelihood of being diagnosed with gout. However, we found that in individuals with high HbA1c levels the risk of gout is actually lower. Furthermore, we included only persons with type 2 diabetes who were treated with NIADs or insulin and therefore our results are not applicable to individuals with type 2 diabetes who are not treated with NIADs or insulin. Another limitation is the fact that postmenopausal status is probably under recorded in CPRD as reflected by the small proportion in Table 1 . This may have led to residual confounding. In the same line, individuals with type 2 diabetes have lower numbers of missing values for possible confounders such as alcohol consumption, smoking status, and BMI due to their regular contact with GPs.
In conclusion, our data show that individuals with type 2 diabetes are at an increased risk of gout, and that this association is stronger in women. The increased risk was not caused by diabetes itself, but by the presence of comorbidities such as hypertension and reduced renal function, which may counterbalance the risk reducing effect of HbA1c in individuals with type 2 diabetes. Health-care professionals treating individuals with diabetes should be knowledgeable about diagnosis and treatment of gout, especially in patients with well controlled diabetes. Although it is still heavily debated whether gout or hyperuricaemia are independent risk factors for cardiovascular disease and mortality,23 such evidence might even change the treatment approach toward a more aggressive use of uric acid lowering drugs in patients with diabetes.
Footnotes
Abbreviations: BMI = body mass index, CI = confidence interval, CPRD GOLD = The UK Clinical Practice Research Datalink GOLD, eGFR = estimated glomerular filtration rate, GPs = general practitioners, HR = hazard ratio, IRs = incidence rates, NIAD = non-insulin antidiabetic drug, PY = person-years, QOF = quality and outcomes framework, THIN = The health improvement network, UK = United Kingdom.
J.M.A.W. and C.M.P.G.V.D. contributed equally to this manuscript.
There was no funding/financial support for this study.
The Department of Pharmacoepidemiology and Clinical Pharmacology, Utrecht Institute for Pharmaceutical Sciences, has received unrestricted research funding from the Netherlands Organisation for Health Research and Development (ZonMW), the Dutch Health Insurance Board (CVZ), the Royal Dutch Association for the Advancement of Pharmacy (KNMP), the private–public funded Top Institute Pharma (www.tipharma.nl), includes cofunding from universities, government, and industry, the EU Innovative Medicines Initiative (IMI), EU 7th Framework Program (FP7), the Dutch Medicines Evaluation Board, the Dutch Ministry of Health and industry (including GlaxoSmithKline, Pfizer, and others). AB received research grants to her department from Amgen, Pfizer, Abbvie, and Merck. C.M.P.G.V.D. received one speaker fee from Menarini and is part of an advisory board of Abbvie.
The authors have no conflicts of interest to disclose.
Supplemental digital content is available for this article. Direct URL citations appear in the printed text and are provided in the HTML and PDF versions of this article on the journal's Website (www.jpgn.org).
REFERENCES
- 1.Harrold L, Mazor K, Peterson D, et al. Patients’ knowledge and beliefs concerning gout and its treatment: a population based study. BMC Musculoskelet Disord 2012; 13:180. [DOI] [PMC free article] [PubMed] [Google Scholar]
- 2.Anagnostopoulos I, Zinzaras E, Alexiou I, et al. The prevalence of rheumatic diseases in central Greece: a population survey. BMC Musculoskelet Disord 2010; 11:98. [DOI] [PMC free article] [PubMed] [Google Scholar]
- 3.Suppiah R, Dissanayake A, Dalbeth N. High prevalence of gout in patients with Type 2 diabetes: male sex, renal impairment, and diuretic use are major risk factors. N Z Med J 2008; 121:43–50. [PubMed] [Google Scholar]
- 4.Garcia Rodriguez L, Cea Soriano L, Choi H. Impact of diabetes against the future risk of developing gout. Ann Rheum Dis 2010; 69:2090–2094. [DOI] [PMC free article] [PubMed] [Google Scholar]
- 5.Bruderer SG, Bodmer M, Jick SS, et al. Poorly controlled type 2 diabetes mellitus is associated with a decreased risk of incident gout: a population-based case-control study. Ann Rheum Dis 2014 Apr 12. doi: 10.1136/annrheumdis-2014-205337. [Epub ahead of print]. [DOI] [PubMed] [Google Scholar]
- 6.Hu G, Jousilahti P, Tuomilehto J. Joint effects of history of hypertension at baseline and type 2 diabetes at baseline and during follow-up on the risk of coronary heart disease. Eur Heart J 2007; 28:3059–3066. [DOI] [PubMed] [Google Scholar]
- 7.Pavkov ME, Knowler WC, Lemley KV, et al. Early renal function decline in type 2 diabetes. Clin J Am Soc Nephrol 2012; 7:78–84. [DOI] [PMC free article] [PubMed] [Google Scholar]
- 8.Krishnan E. Reduced glomerular function and prevalence of gout: NHANES 2009–10. PLoS One 2012; 7:e50046. [DOI] [PMC free article] [PubMed] [Google Scholar]
- 9.McAdams-DeMarco MA, Maynard JW, Baer AN, et al. Hypertension and the risk of incident gout in a population-based study: the atherosclerosis risk in communities cohort. J Clin Hypertens (Greenwich) 2012; 14:675–679. [DOI] [PMC free article] [PubMed] [Google Scholar]
- 10.Tuomilehto J, Zimmet P, Wolf E, et al. Plasma uric acid level and its association with diabetes mellitus and some biologic parameters in a biracial population of Fiji. Am J Epidemiol 1988; 127:321–336. [DOI] [PubMed] [Google Scholar]
- 11.Cook D, Shaper A, THelle D, et al. Serum uric acid, serum glucose and diabetes: relationships in a population study. Postgrad Med J 1986; 62:1001–1006. [DOI] [PMC free article] [PubMed] [Google Scholar]
- 12.Choi HK, Ford ES. Haemoglobin A1c, fasting glucose, serum C-peptide and insulin resistance in relation to serum uric acid levels: the Third National Health and Nutrition Examination Survey. Rheumatology (Oxford) 2008; 47:713–717. [DOI] [PubMed] [Google Scholar]
- 13.Meisinger C, Thorand B, Schneider A, et al. Sex differences in risk factors for incident type 2 diabetes mellitus: the MONICA Augsburg Cohort study. Arch Internal Med 2002; 162:82–89. [DOI] [PubMed] [Google Scholar]
- 14.Meier CR, Jick H. Omeprazole, other antiulcer drugs and newly diagnosed gout. Br J Clin Pharmacol 1997; 44:175–178. [DOI] [PMC free article] [PubMed] [Google Scholar]
- 15.Staub K, Ruhli FJ, Woitek U, et al. BMI distribution/social stratification in Swiss conscripts from 1875 to present. Eur J Clin Nutr 2010; 64:335–340. [DOI] [PubMed] [Google Scholar]
- 16.Liu Q, Gamble G, Pickering K, et al. Prevalence and clinical factors associated with gout in patients with diabetes and prediabetes. Rheumatology (Oxford) 2012; 51:757–759. [DOI] [PubMed] [Google Scholar]
- 17.Gilbert RE. Sodium-glucose linked transporter-2 inhibitors: potential for renoprotection beyond blood glucose lowering? Kidney Int 2013. [DOI] [PubMed] [Google Scholar]
- 18.Lipkowitz MS. Regulation of uric acid excretion by the kidney. Curr Rheumatol Rep 2012; 14:179–188. [DOI] [PubMed] [Google Scholar]
- 19.Penno G, Solini A, Bonora E, et al. Gender differences in cardiovascular disease risk factors, treatments and complications in patients with type 2 diabetes: the RIACE Italian multicentre study. J Intern Med 2013; 274:176–191. [DOI] [PubMed] [Google Scholar]
- 20.Gouni-Berthold I, Berthold HK, Mantzoros CS, et al. Sex disparities in the treatment and control of cardiovascular risk factors in type 2 diabetes. Diabetes Care 2008; 31:1389–1391. [DOI] [PMC free article] [PubMed] [Google Scholar]
- 21.Huxley R, Barzi F, Woodward M. Excess risk of fatal coronary heart disease associated with diabetes in men and women: meta-analysis of 37 prospective cohort studies. BMJ 2006; 332:73–78. [DOI] [PMC free article] [PubMed] [Google Scholar]
- 22.Hak AE, Curhan GC, Grodstein F, et al. Menopause, postmenopausal hormone use and risk of incident gout. Ann Rheum Dis 2010; 69:1305–1309. [DOI] [PMC free article] [PubMed] [Google Scholar]
- 23.van Durme C, van Echteld IA, Falzon L, et al. Cardiovascular risk factors and comorbidities in patients with hyperuricemia and/or gout: a systematic review of the literature. J Rheumatol Suppl 2014; 92:9–14. [DOI] [PubMed] [Google Scholar]


