

Supplemental Digital Content is available in the text
Abstract
To identify the distinct pattern of anatomical network reorganization in surgically refractory mesial temporal lobe epilepsy (MTLE) patients using a longitudinal design. We collected longitudinal diffusion-weighted images of 19 MTLE patients before and after anterior temporal lobectomy. Patients were classified as seizure-free (SF) or nonseizure-free (NSF) at least 1 year after surgery. We constructed whole-brain anatomical networks derived from white matter tractography and evaluated network connectivity measures by graph theoretical analysis. The reorganization trajectories of network measures in SF and NSF patients were investigated by two-way mixed analysis of variance, with factors “group” (SF vs NSF) and “treatment” (presurgery vs postsurgery). Widespread brain structures showed opposite reorganization trajectories in FS and NSF groups (interaction effect). Most of them showed group difference before surgery and then converge after surgery, suggesting that surgery remodeled these structures into a similar status. Conversly, contralateral amygdala-planum-temporale and thalamic-parietal tracts showed higher connectivity strength in NSF than in SF patients after surgery, indicating maladaptive neuroplastic responses to surgery in NSF patients. Our findings suggest that surgical outcomes are associated not only with the preoperative pattern of anatomical connectivity, but also with connectome reconfiguration following surgery. The reorganization of contralateral temporal lobe and corticothalamic tracts may be particularly important for seizure control in MTLE.
INTRODUCTION
Resective epilepsy surgery is a highly successful treatment for drug-resistant mesial temporal lobe epilepsy (MTLE).1 However, roughly 30% of surgically treated patients do not achieve a seizure-free (SF) outcome.2 Although multiple factors have been related to the recurrence of seizures, the exact reason of surgery failure is still largely unknown.3
Several clinical variables have been reported as predictors for postoperative outcome in MTLE, such as hippocampal volume, bilateral atrophy or not, age at surgery, epilepsy duration, and secondary generalized seizures or not. For most of these variables, however, the predictive ability was not well replicated in literatures. Recently, as the development of neuroimaging technique, researchers are enabled to investigate the pathological mechanism of MTLE in central neuronal system. One of the novel and consistent findings is that the pathological changes involved multiple extratemporal brain structures rather than exclusive in mesial temporal lobe; therefore MTLE is increasingly recognized as a network disorder.4–6 In the context of this network theory, structural connectome has been adopted to identify predictors of surgical outcome. Diffusion studies on presurgical data found that, nonseizure-free (NSF) patients exhibited a distinct feature of anatomical connectivity within thalamocortical network7 and contralateral temporal lobe.8 Moreover, presurgical connectome topography also yielded high sensitivity and specificity to identify surgical candidates who may have a SF outcome.9 All these findings emphasized the importance of baseline pathological features in MTLE surgery.10 However, to which extent these features engaged in the anatomical reorganization after surgery is less studied. As brain plasticity also provides a substrate for long-lasting recurrent seizures,11,12 understanding brain reorganization mechanisms has important clinical implications for controlling surgically refractory seizures.13
In the current study, we collected longitudinal diffusion-weighted images (DWIs) before and after surgery, and constructed large-scale anatomical networks to evaluate the dynamic alteration of global and nodal topological characteristics and connection strengths using graph theoretical analysis.14 We hypothesized that patients refractory to surgery may exhibit a distinct reorganization of the anatomical connectome that probably includes thalamocortical networks7 and the contralateral temporal lobe8 as suggested by recent anatomical studies.
METHODS
Patients
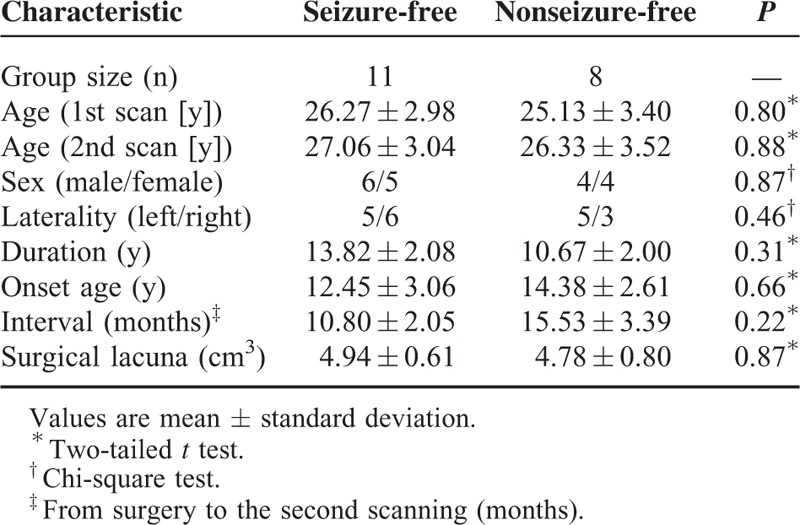
Nineteen patients with unilateral refractory MTLE participated in this longitudinal study. Diagnosis of MTLE was performed according to the International League Against Epilepsy 2001 classification based on a comprehensive evaluation, including seizure history and semiology, neurologic examination, diagnostic magnetic resonance imaging (MRI), and electroencephalography records for all patients. All patients underwent preoperative evaluation and subsequent standard anterior temporal lobectomy for the treatment of their epilepsy at the Jinling Hospital from June 2009 to December 2013. Three patients had anterior temporal lobe cavernomas, and histopathology of the resected specimen revealed gliosis. All remaining patients had hippocampal sclerosis ipsilateral to seizure onset as identified on MRI and confirmed by postsurgical histopathology. We followed up the surgical outcome of all patients at least 1 year after surgery according to Engel category. Patients were separated into 2 groups: a SF group (Engel: IA or IB) with 11 patients (5 left-sided and 6 right-sided); and a NSF group (Engel: II, III, and IV) with 8 patients (5 left-sided and 3 right-sided). Demographic and clinical information are detailed in Table 1.
TABLE 1.
Demographic and Clinical Characteristics of All Patients
Standard Protocol Approvals, Registrations, and Patient Consents
Written informed consent was obtained from all participants. The study was approved by the local medical ethics committee at Jinling Hospital, Nanjing University School of Medicine.
Data Acquisition
We acquired structural images of MTLE patients using a Siemens Trio 3T scanner (Erlangen, Germany) at Jinling Hospital. Foam padding was used to minimize head motion. Diffusion images of the whole brain were obtained by a spin echo-based echo planar imaging sequence (repetition time = 6100 milliseconds, echo time = 93 milliseconds, flip angle = 90°, field of view = 240 × 240 mm2, matrix size = 256 × 256, voxel size = 0.94 × 0.94 × 3 mm3, 45 contiguous axial slices). For each patient, the diffusion datasets included 30 volumes with diffusion gradients applied along 30 noncollinear directions (b = 1000 second/mm2) and 1 volume without diffusion weighting (b = 0 second/mm2). To improve the signal-to-noise ratio, the spin echo-based echo planar imaging sequence was repeated 4 times.15 Subsequently, three-dimensional (3D)-T1–weighted structural images in sagittal orientation were acquired using a magnetization-prepared rapid gradient-echo sequence (repetition time = 2300 milliseconds, echo time = 2.98 milliseconds, flip angle = 9°, field of view = 256 × 256 mm2, voxel size = 0.5 × 0.5 × 1 mm3, interslice gap = 0, 176 slices).
Lesion Mapping
Two investigators (JGJ and WW) independently traced the surgical lacuna manually in each patient's postsurgical 3D-T1–weighted images, creating individual volumes of interest (VOIs) (Figure 1). The union of VOIs was used to quantify the volume of resection in each patient. The degree of VOI overlap between two investigators was estimated by the Dice coefficient (mean ± SD = 0.89 ± 0.05).
FIGURE 1.
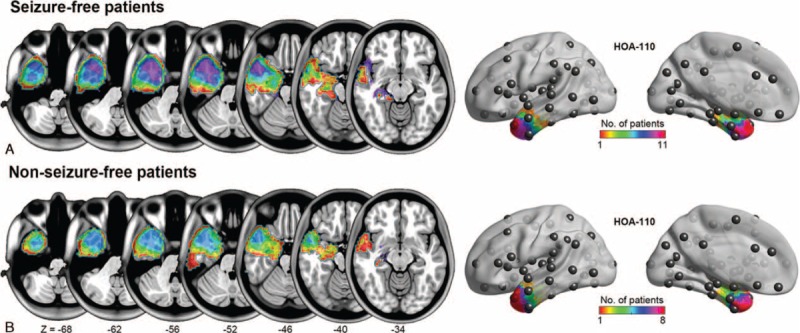
Degree of surgical lacuna overlap across patients. A, Seizure-free patients (n = 11). B, Nonseizure-free patients (n = 8). The surgical lacuna overlap across 19 patients was rendered on the brain surface with HOA-110 parcellation schemes.
Data Preprocess
Diffusion-weighted images were preprocessed and analyzed using the Pipeline for Analyzing Brain Diffusion Images toolkit (PANDA; http://www.nitrc.org/projects/panda),16 which synthesizes procedures in FSL (http://fsl.fmrib.ox.ac.uk/fsl), and the Diffusion Toolkit (DTK, http://www.trackvis.org/dtk/). DWIs were coregistered to the B0 image, and corrected for distortion induced by eddy currents. Diffusion-tensor models were estimated at each voxel using the linear least-squares fitting method in DTK. Whole-brain white matter fiber tracking was performed in the native diffusion space for each subject using the fiber assignment with the continuous tracking algorithm embedded in DTK. Path tracking proceeded until either the fractional anisotropy was less than 0.15 or the angle between the current and the previous path segment was greater than 35°, as in our previous studies.15,17 Fibers less than 10 mm or with obvious false paths were discarded.
Parcellation
We used the Harvard-Oxford Atlas (HOA)18 because of its elaborate parcellation of the temporal lobe. The HOA parcellates cortical and subcortical brain regions into 110 anatomical regions of interests (ROIs) (excluding brain stem). A list of anatomical labels of these ROIs is presented in Table e-1. The ROIs were transformed into each patient's native diffusion space. Specifically, we coregistered the individual 3D-T1 images to B0 images, and normalized the 3D-T1 images to the Montreal Neurologic Institute (MNI) space by a 12-parameter nonlinear transformation. These transformation parameters were inversed and applied to the HOA-110 atlas.15 For normalization of postsurgical 3D-T1 images, we additionally used a cost-function modification to exclude the volume of surgical lacuna during the process and avoid bias during the transformations.12,19
Connectivity Matrix and Graph Theoretic Measures
The anatomical connectivity between ROIs i and j was defined as the number of fibers connecting i and j. We selected fiber number as a measure because of its sensitivity to the topological difference between patients with distinct surgical outcomes.8 The raw network connectivity (fiber number) was scaled to the total volume of ROIs i and j.15 For each patient, the anatomical connectivity matrix “M” had 110 × 110 entries, with Aij corresponding to the weighted connectivity between ROIs i and j, also referred to as the link between nodes i and j. To improve the statistical power and investigate the pathophysiological mechanisms common to both right and left MTLEs, we performed a left-to-right flipping for the connectivity matrix of right MTLE patients. For both presurgical and postsurgical data, we excluded ROIs that overlapped with the lesion VOI, finally yielding 96 nondamaged ROIs for computing graph-theoretic measures.
Graph theory enables the quantification of network topological properties. Graph measures for each individual connectivity matrix were calculated with the Brain Connectivity Toolbox (https://sites.google.com/a/brain-connectivity-toolbox.net/bct/). Small-worldness is an optimal architecture balancing the segregation and integration of information, with similar path length (
), but higher clustering (
) than a random network.20 We evaluated the typical properties of a small-worldness (
 |
), which is usually larger than 1. Among a number of nodal measures in graph theory, we selected connectivity strength to estimate the topological feature of each node because of its high test–retest reliability21 and clear neurophysiological relevance.22 Nodal strength (Si) was computed as the sum of the weights of all connections of node i, that is as
. This value quantifies the extent to which a node is relevant to the graph (see details in Appendix e-1, http://links.lww.com/MD/A457).
Statistical Analysis
To examine how anatomical architectures reorganized in patients with different surgical outcomes, we performed a two-way mixed analysis of variance (ANOVA) (http://mrtools.mgh.harvard.edu/index.php/GLM_Flex) for network measures with between-patient “random” factor “group” (two levels: SF vs NSF) and within-patient “fixed” factor “treatment” (two levels: presurgery vs postsurgery) (Figure 2). For network connectivity-based (edge) statistics, only fiber tracts observed in more than 8 SF and 6 NSF patients according to binomial tests were entered into the two-way mixed ANOVA. The statistical significance for interaction and main effect was corrected using a false-positive adjustment.23 Since the sample size was relatively small in the current study, we also provided the statistical power for our main results through a free tool in http://webpower.psychstat.org/wiki/. To test whether our findings could be used as predictors of postoperative outcome in drug-resistant MTLE, we performed a multivariate pattern analysis based on the preoperative measures (for details see Supplementary e-1 Methods, http://links.lww.com/MD/A457).
FIGURE 2.
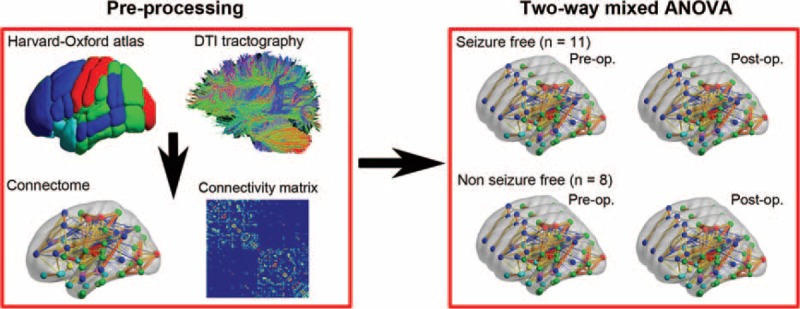
Overview of the analytic strategy. First, cortical and subcortical brain regions were parcellated according to the Harvard-Oxford atlas (HOA). Next, a connectivity matrix was constructed by deterministic fiber tracking. Then, we performed two-way mixed ANOVA for the preoperative and postoperative connectomes of the two patient groups (seizure-free vs nonseizure-free group). Postop = postoperation, preop. = preoperation.
RESULTS
There were no significant differences in baseline clinical or demographic variables between SF and NSF patient groups, including mean age, sex proportion, seizure-onset age, volume of surgical lacuna, interval from surgery to postsurgical scan, and duration of epilepsy (Table 1). Significant group-by-treatment interactions were identified in global topology, and nodal and connectivity strength.
Group-by-Treatment Interactions
In both preoperative and postoperative states, the anatomical connectomes of both patient groups exhibited high global and local efficiencies (ie, sigma >1), which is the typical feature of small-word topology. After surgery, the SF group showed a tendency to a more efficient organization, whereas the NSF group to a less one (F[1,17] = 8.65, P = 0.01, power = 0.81; Table 2, Figure 3). However, post hoc analysis indicated that these alterations after surgery were not significant in both groups (P > 0.05). Additionally, the small-worldness (sigma) was not significantly different between groups in both preoperative and postoperative states (P > 0.05).
TABLE 2.
Regions and Connections Showing Significant Interaction Effect
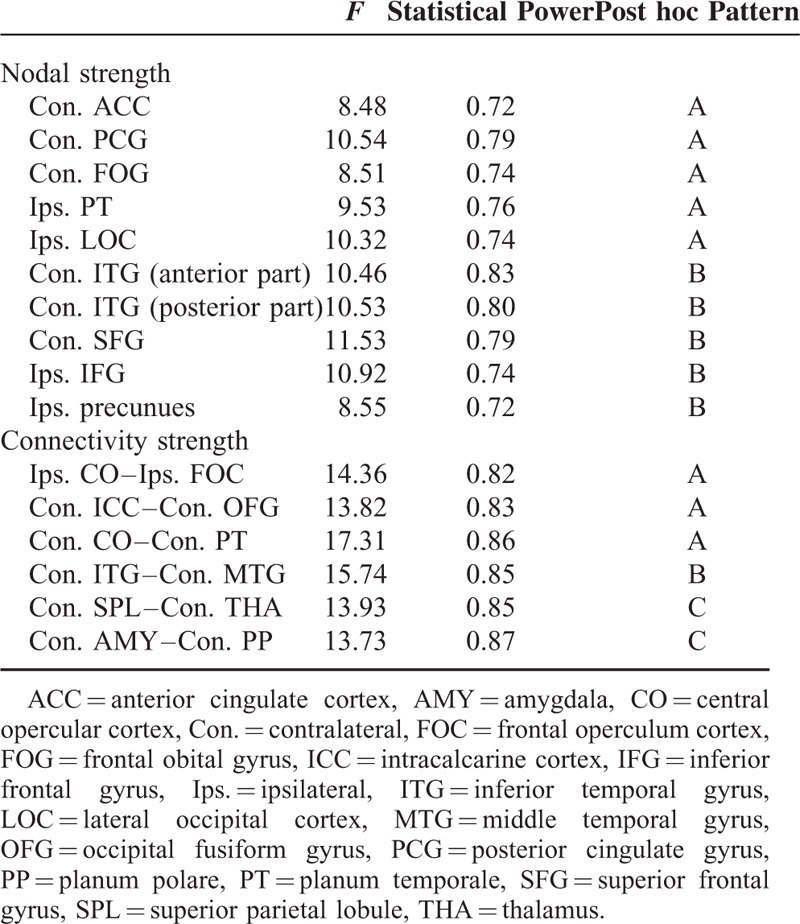
FIGURE 3.
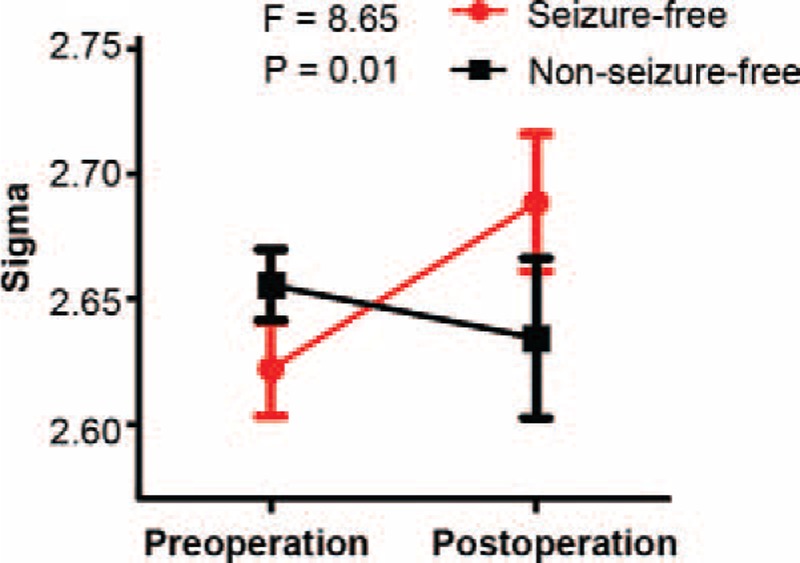
Interaction effect between treatment and group for small-worldness.
Ten nodes and 6 connections showed group-specific reorganization trajectories (P < 0.05, corrected). The interaction could be summarized into 3 patterns (A, B, and C patterns; Table 2), all indicating increased connectivity in NSF patients and decreased connectivity in SF patients after surgery (Figures 4 and 5).
FIGURE 4.
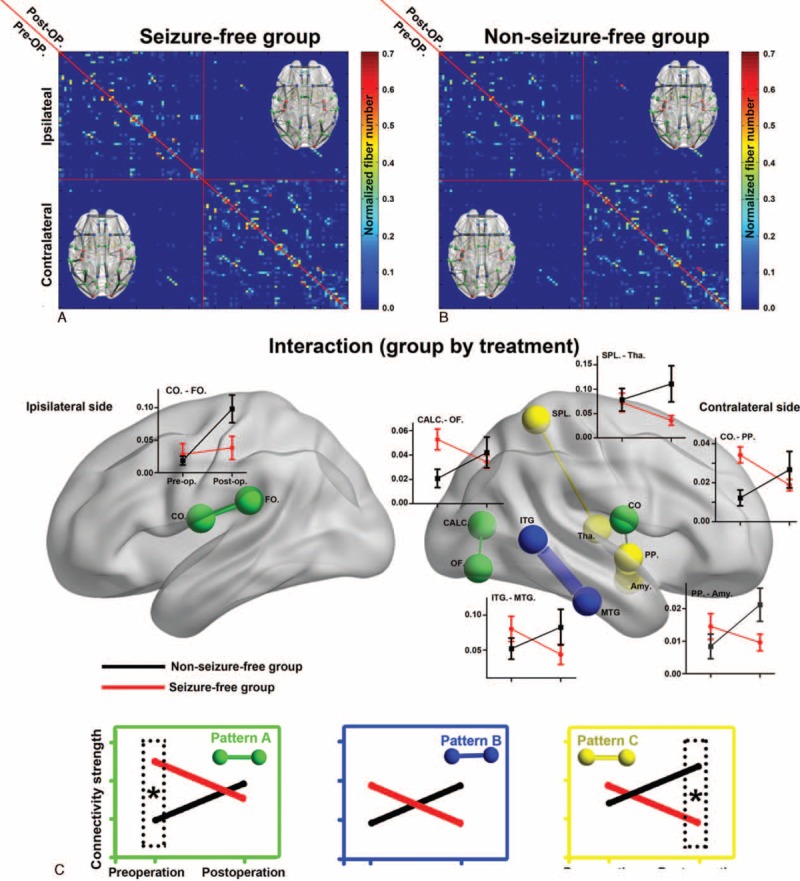
Interaction effect between treatment and group for network edges. A, B, The preoperative (upper diagonal) and postoperative (lower diagonal) correlation matrix for seizure-free (A) and nonseizure-free groups (B). C, Six connections (edges) with significant interaction effects are shown in a 3D brain template (P < 0.05 corrected). The reorganization feature is illustrated in line graphs and summarized into three categories. Edges in green show preoperative between-group differences that converged after surgery (pattern A). Edges in blue show alteration in opposite direction, but no between-group difference was found before or after surgery (pattern B). Edges in yellow show opposite direction of reorganization and were significantly different between groups after surgery (pattern C). Amy = amygdala, CALC = intracalcarine cortex, CO = central opercular cortex, CO = central opercular cortex, FO = frontal operculum cortex, ITG = inferior temporal gyrus, MTG = middle temoral gyrus, OF = occipital fusiform gyrus, PP = planum polare, SPL = superior parietal lobule, Tha = thalamus.
FIGURE 5.
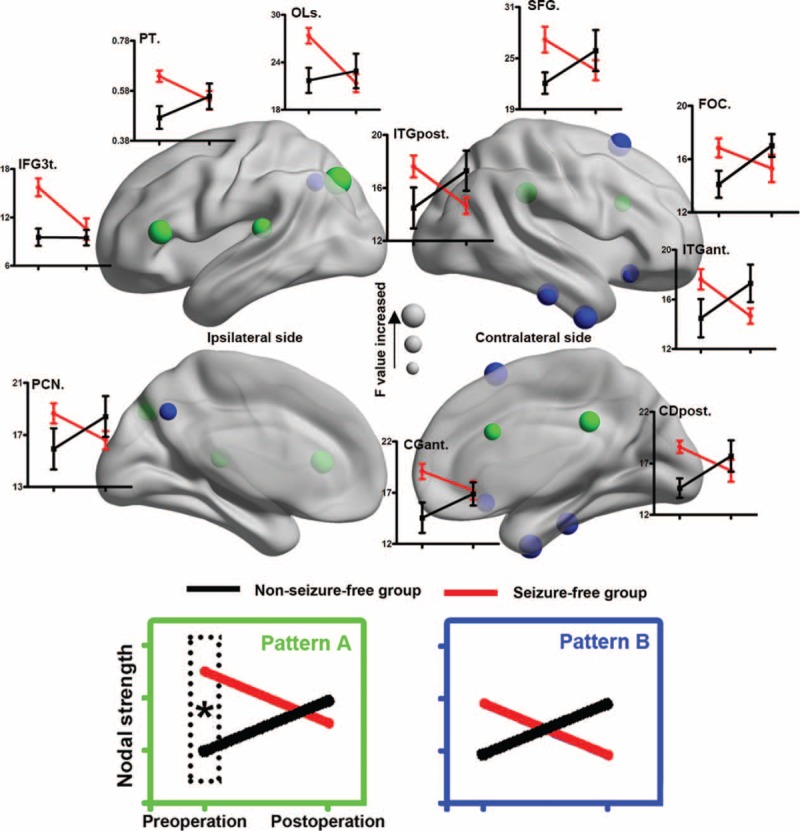
Treatment-by-group interaction effect for network nodes. Ten brain regions (nodes) show a significant interaction effect in nodal strength. The reorganization feature is illustrated in line graphs and summarized into 2 categories. Nodes in green show preoperative between-group differences that converged after surgery (pattern A). Nodes in blue show alteration in opposite direction, but no between-group difference was found before or after surgery (pattern B). CGant = cingulate gyrus (anterior division), CGpost = cingulate gyrus (posterior division), FOC = frontal orbital cortex, IFG3t = inferior frontal gyrus (pars triangularis), ITGant = inferior temporal gyrus (anterior part), ITGpost = inferior temporal gyrus (posterior part), OLs = lateral occipital cortex (superior division), PCN = precuneus cortex, PT = planum temporale, SFG = superior grontal gyrus.
Pattern A indicated regions with significant between-group differences before surgery, but converged after surgery (Figures 4 and 5). Five nodes and 3 anatomical connections belong to pattern A: contralateral anterior cingulate gyrus (F[1,17] = 8.48), contralateral posterior cingulate gyrus (F[1,17] = 10.54), contralateral frontal orbital gyrus (F[1,17] = 8.51), ipailateral planum temporale (F[1,17] = 9.53), ipailateral lateral occipital cortex (LOC, F[1,17] = 10.32), ipailateral central opercular cortex (CO) to frontal operculum cortex (F[1,17] = 14.36), contralateral intracalcarine cortex to occipital fusiform gyrus (F[1,17] = 13.82), and contralateral CO cortex to planum temporale (F[1,17] = 17.32).
Pattern B indicated regions that did not showing significant group differences either preoperatively or postoperatively (Figures 4 and 5). Five nodes and 1 anatomical connection belonged to pattern B: contralateral inferior temporal gyrus (anterior part, F[1,17] = 10.46; and posterior part, F[1,17] = 10.53), contralateral superior frontal gyrus (F[1,17] = 11.13), pars triangularis part of ipsilateral inferior frontal gyrus (F[1,17] = 10.92), ipsilateral precunues (F[1,17] = 8.55), and contralateral inferior to middle temporal gyrus (F[1,17] = 15.74).
Pattern C indicated regions with significant between-group differences after surgery, but not before surgery. Two connections belong to pattern C: connection between the contralateral superior parietal lobule (SPL) and thalamus (F[1,17] = 13.93), and between contralateral amygdala and planum polare (F[1,17] = 13.73) (Figures 4 and 5).
Main Effects
The global network small-worldness did not show a significant group or treatment main effect. Nodal strength showed a significant group main effect in temporal-paralimbic areas, ipsilateral CO, and contralateral postcentral gyrus, and a significant treatment main effect in the ipslateral frontal lobule, SPL, and LOC (P < 0.05, corrected). For anatomical connections, significant treatment main effects were found mainly in the ipslateral frontal-subcortical tracts (P < 0.05, corrected), whereas no significant group main effect was found. More details can be found in Appendix e-2 (http://links.lww.com/MD/A457). In all these nodes and connections, only 6 nodes showed significant between-group differences before surgery. Multivariate pattern analysis on the nodal strength of these 6 regions indicated a good discrimination for the NSF patients (area under receiver-operating characteristic curve 0.80, accuracy 0.79, sensitivity 0.75, specificity 0.82; Figure e-3).
DISCUSSION
We investigated the reorganization mechanism in the large-scale whole-brain anatomical connectome, rather than in just the mesial temporal lobe, after anterior temporal lobectomy, because MTLE is recognized as a network disorder.24–26 The different reorganization trajectories of SF and NSF groups could be partly inferred from the interaction effects1: the small-worldness feature in the SF group changed toward a high efficiency-to-cost ratio, whereas that in the NSF group was altered in a contradirection2; significant nodal strength was found in the contralateral temporal-paralimbic network,3 and significant anatomical connections were found in the contralateral hemisphere involving temporal lobe regions and thalamo-parietal connections.
Global Network Property
Small-worldness organization is known to be a robust and consistent network architecture, and is a hallmark of the brain anatomical, functional, and effective connectivity connecotmes.27–29 Small-worldness networks are characterized by a combination of high clustering (which represents local connectivity) and efficient long-distance connections (ie, short distances between any 2 nodes).20 The small-world topology can support both segregated/specialized and distributed/integrated information processing,30 indicating an optimal balance between global integration and local specialization.31 However, this economical architecture is altered in the epileptic brain.32 These changes may relate to both the progress of long-term impairment26,33 and epileptogenic processes.25 We did not find group difference in global network small-worldness preoperatively, consisting with a previous whole-brain anatomical connectome study.8 Additionally, small-worldness from presurgery to postsurgery showed divergent trajectories between SF and NSF groups. The SF group shifted to a more efficient organization after surgery; whereas the NSF group had a less optimized network organization relevant to the recurrence of seizures. Since seizures were not successfully controlled through surgery in NSF patients, the decreased small-worldness could be a long-term impairment of the continuous seizures. This is consistent with the findings that abnormality in MTLE could progress with disease duration.34 Since normal controls were not involved in the current study, it is not possible to evaluate whether the postoperative global property is in the normal range. But, together with the fact that the small-worldness of MTLE brain is still functionally no different to normal controls,25,35 our longitudinal findings suggest that the optimized topological organization of anatomical architecture may be possibly disrupted with the recurrence of seizures.
Nodal Strength
Unilateral MTLE is characterized by pathological changes in the seizure-onset side, but modern neuroimaging studies have shown that other cortices are also part of the epileptic network, such as the contralateral temporal-paralimbic network.8,36,37 We found a significant interaction effect for nodal strength in cingulate gyrus and temporal lobe areas—regions closely connected to the hippocampus in both function38 and structure.39,40 These regions have been implicated in the epileptic network in MTLE.36,39 Our findings indicated that anterior temporal lobectomy successfully converged some elements of the connectome into the same status despite preoperatively between-group differences. We also found group-specific reorganization in prefrontal cortex, precuneus, and occipital cortex. We speculated that these abnormalities may relate to the different neurocognitive outcomes in SF and NSF patients after surgery, such as language,41 memory,42 and visual field defects.43 However, these cognitive abilities were not estimated in the current study. Otherwise, a correlation between cognition scores and imaging findings would make this issue more clear.
Edge Strength
Our anatomical connectivity results underscore the importance of the contralateral temporal lobe in seizure control. Half of the connections with significant interaction were related to the contralateral temporal lobe. This is consistent with previous findings that surgically refractory patients exhibited a distinct temporal lobe connectivity pattern before surgery.8 In the SF group, decreased connectivity in the contralateral mesial temporal lobe may be a compensatory mechanism for loss of function due to surgical resection,44 whereas the increased connectivity in the NSF group may the underlying substrate of a newborn epileptic network.11,24 Among these connections, the amygdala-planum-temporale and thalamus-SPL pathways may be particularly important because they exhibited significantly higher connectivity strength in NSF than in SF patients after surgery. Thus, the postoperative status of these connections may be directly associated with recurrence of seizures. Taken together, the differential reorganization of these anatomical connections between groups indicates a (mal)adaptive plasticity response to surgery.
Neurobiological Implications
Postoperative reorganization or recovery is one of the most important issues concerned by both clinical work and basic studies. It is directly associated with surgical outcomes, seizure relapse or controlled. Brain regions and anatomical connections particularly involved in this course were revealed by this longitudinal connectome study. In line with previous cross-sectional studies,7,8,45 we found that patients with different outcomes showed distinct topological properties in multiple regions, supporting the possibility of predicting surgical outcomes through preoperative features. Our longitudinal findings further disclosed how these regions may contribute to seizure relapse, possibly through enhanced connectivity strength. Interestingly, some regions without preoperative group difference also showed distinct reorganization trajectories, implicating the complexity of the recovery. For the particular connections (amygdala-planum-temporale and thalamus-SPL white matter tracts), treatments complementary to anterior temporal lobectomy may be designed to reduce the connectivity strength. For example, similar to multiple subpial transection controlling epileptic discharges,46 transection on these contralateral temporal and thalamocortical tracts may prevent seizure relapse. Finally, it should be mentioned that the current findings still needed further validations from longitudinal studies with large sample size in multiple centers.
Limitations
Several limitations of this study need to be addressed. First, images of all right MTLE patients were flipped and combined with those of the left-sided patients to form a homogeneous group; thus, these findings are likely to reflect only pathology common to both left and right MTLE patients,47 whereas the mechanisms specific for each subgroup are still largely unknown. Second, the interval between surgery and follow-up MRI examination was relatively short. As outcome may change even after 10 years,48 a longer-term longitudinal study is necessary. Third, although diffusion tensor imaging is an effective modality to investigate white matter networks, other advanced approaches (eg, diffusion spectrum imaging) may yield more accurate tractography, especially in areas with cross-fibers. Fourth, the sample size is relatively small in the current study. Future multicenter studies with larger sample size may help to validate our findings.
With a benefit-over-risk expectation, anterior temporal lobectomy was performed for drug-resistant MTLE patients. In this longitudinal study, we revealed the underlying reorganization pattern of the anatomical connectome associated with distinct surgical outcomes. Our findings highlight the role of the contralateral temporal-paralimbic and corticothalamic networks in postsurgical recovery. In particular, the contralateral amygdala-planum-temporale and thalamus-SPL connections should be considered in future treatments for controlling seizures in MTLE.
Footnotes
Abbreviations: ANOVA = analysis of variance, CO = central opercular, DWIs = diffusion-weighted images, HOA = Harvard-Oxford Atlas, LOC = lateral occipital cortex, MNI = Montreal Neurologic Institute, MTLE = mesial temporal lobe epilepsy, NSF = nonseizure-free, ROIs = regions of interests, SF = seizure-free, SPL = superior parietal lobule, VOIs = volumes of interest.
All the authors have no financial relationships relevant to this article to disclose.
This work was supported by the Natural Science Foundation of China (#81201155 and 81471653 for Wei LIAO, #81401400 for Gong-Jun JI, #81401402 for Qiang XU, #81301198 for Zhengge WANG, #81201078 for Kangjian Sun, #81171328 for Qing JIAO, #81271553 and 81422022 for Zhiqiang ZHANG), Science Foundation grants (#2013M532229 for Wei LIAO), 863 project (#2014BAI04B05 and 2015AA020505 for Zhiqiang ZHANG).
Gong-Jun Ji and Zhiqiang Zhang contributed equally to this work.
All the authors have no conflicts of interest to disclose.
Supplemental Digital Content is available for this article.
Supplemental digital content is available for this article. Direct URL citations appear in the printed text and are provided in the HTML and PDF versions of this article on the journal's Website (www.md-journal.com).
REFERENCES
- 1.Jobst BC, Cascino GD. Resective epilepsy surgery for drug-resistant focal epilepsy: a review. JAMA 2015; 313:285–293. [DOI] [PubMed] [Google Scholar]
- 2.de Tisi J, Bell GS, Peacock JL, et al. The long-term outcome of adult epilepsy surgery, patterns of seizure remission,;1; and relapse: a cohort study. Lancet 2011; 378:1388–1395. [DOI] [PubMed] [Google Scholar]
- 3.Moshe SL, Perucca E, Ryvlin P, et al. Epilepsy: new advances. Lancet 2015; 385:884–898. [DOI] [PubMed] [Google Scholar]
- 4.Engel J, Jr, Thompson PM, Stern JM, et al. Connectomics and epilepsy. Curr Opin Neurol 2013; 26:186–194. [DOI] [PMC free article] [PubMed] [Google Scholar]
- 5.Richardson MP. Large scale brain models of epilepsy: dynamics meets connectomics. J Neurol Neurosurg Psychiatry 2012; 83:1238–1248. [DOI] [PubMed] [Google Scholar]
- 6.Ji GJ, Zhang Z, Zhang H, et al. Disrupted causal connectivity in mesial temporal lobe epilepsy. PLoS One 2013; 8:e63183. [DOI] [PMC free article] [PubMed] [Google Scholar]
- 7.Keller SS, Richardson MP, Schoene-Bake JC, et al. Thalamotemporal alteration and postoperative seizures in temporal lobe epilepsy. Ann Neurol 2015; 77:760–774. [DOI] [PMC free article] [PubMed] [Google Scholar]
- 8.Bonilha L, Helpern JA, Sainju R, et al. Presurgical connectome and postsurgical seizure control in temporal lobe epilepsy. Neurology 2013; 81:1704–1710. [DOI] [PMC free article] [PubMed] [Google Scholar]
- 9.Bonilha L, Jensen JH, Baker N, et al. The brain connectome as a personalized biomarker of seizure outcomes after temporal lobectomy. Neurology 2015; 84:1846–1853. [DOI] [PMC free article] [PubMed] [Google Scholar]
- 10.Bonilha L, Martz GU, Glazier SS, et al. Subtypes of medial temporal lobe epilepsy: influence on temporal lobectomy outcomes? Epilepsia 2012; 53:1–6. [DOI] [PubMed] [Google Scholar]
- 11.Ben-Ari Y. Epilepsies and neuronal plasticity: for better or for worse? Dialogues Clin Neurosci 2008; 10:17–27. [DOI] [PMC free article] [PubMed] [Google Scholar]
- 12.Yasuda CL, Valise C, Saude AV, et al. Dynamic changes in white and gray matter volume are associated with outcome of surgical treatment in temporal lobe epilepsy. Neuroimage 2010; 49:71–79. [DOI] [PubMed] [Google Scholar]
- 13.Yogarajah M, Duncan JS. Diffusion-based magnetic resonance imaging and tractography in epilepsy. Epilepsia 2008; 49:189–200. [DOI] [PubMed] [Google Scholar]
- 14.Stam CJ. Modern network science of neurological disorders. Nat Rev Neurosci 2014; 15:683–695. [DOI] [PubMed] [Google Scholar]
- 15.Zhang Z, Liao W, Chen H, et al. Altered functional-structural coupling of large-scale brain networks in idiopathic generalized epilepsy. Brain 2011; 134:2912–2928. [DOI] [PubMed] [Google Scholar]
- 16.Cui Z, Zhong S, Xu P, et al. PANDA: a pipeline toolbox for analyzing brain diffusion images. Front Hum Neurosci 2013; 7: DOI: 10.3389/fnhum.2013.00042. [DOI] [PMC free article] [PubMed] [Google Scholar]
- 17.Ji GJ, Zhang Z, Xu Q, et al. Generalized tonic-clonic seizures: aberrant interhemispheric functional and anatomical connectivity. Radiology 2014; 271:839–847. [DOI] [PubMed] [Google Scholar]
- 18.Kennedy DN, Lange N, Makris N, et al. Gyri of the human neocortex: an MRI-based analysis of volume and variance. Cereb Cortex 1998; 8:372–384. [DOI] [PubMed] [Google Scholar]
- 19.Stebbins GT, Nyenhuis DL, Wang C, et al. Gray matter atrophy in patients with ischemic stroke with cognitive impairment. Stroke 2008; 39:785–793. [DOI] [PubMed] [Google Scholar]
- 20.Watts DJ, Strogatz SH. Collective dynamics of 'small-world’ networks. Nature 1998; 393:440–442. [DOI] [PubMed] [Google Scholar]
- 21.Wang JH, Zuo XN, Gohel S, et al. Graph theoretical analysis of functional brain networks: test-retest evaluation on short- and long-term resting-state functional MRI data. PLoS One 2011; 6:e21976. [DOI] [PMC free article] [PubMed] [Google Scholar]
- 22.Liang X, Zou Q, He Y, et al. Coupling of functional connectivity and regional cerebral blood flow reveals a physiological basis for network hubs of the human brain. Proc Natl Acad Sci U S A 2013; 110:1929–1934. [DOI] [PMC free article] [PubMed] [Google Scholar]
- 23.Fornito A, Yoon J, Zalesky A, et al. General and specific functional connectivity disturbances in first-episode schizophrenia during cognitive control performance. Biol Psychiatry 2011; 70:64–72. [DOI] [PMC free article] [PubMed] [Google Scholar]
- 24.Spencer SS. Neural networks in human epilepsy: evidence of and implications for treatment. Epilepsia 2002; 43:219–227. [DOI] [PubMed] [Google Scholar]
- 25.Liao W, Zhang Z, Pan Z, et al. Altered functional connectivity and small-world in mesial temporal lobe epilepsy. PLoS One 2010; 5:e8525. [DOI] [PMC free article] [PubMed] [Google Scholar]
- 26.Liu M, Chen Z, Beaulieu C, et al. Disrupted anatomic white matter network in left mesial temporal lobe epilepsy. Epilepsia 2014; 55:674–682. [DOI] [PubMed] [Google Scholar]
- 27.Liao W, Ding J, Marinazzo D, et al. Small-world directed networks in the human brain: multivariate Granger causality analysis of resting-state fMRI. Neuroimage 2011; 54:2683–2694. [DOI] [PubMed] [Google Scholar]
- 28.Hagmann P, Cammoun L, Gigandet X, et al. Mapping the structural core of human cerebral cortex. PLoS Biol 2008; 6:e159. [DOI] [PMC free article] [PubMed] [Google Scholar]
- 29.Achard S, Bullmore E. Efficiency and cost of economical brain functional networks. PLoS Comput Biol 2007; 3:e17. [DOI] [PMC free article] [PubMed] [Google Scholar]
- 30.Bassett DS, Bullmore E. Small-world brain networks. The neuroscientist: a review journal bringing neurobiology, neurology and psychiatry 2006; 12:512–523. [DOI] [PubMed] [Google Scholar]
- 31.Bullmore E, Sporns O. The economy of brain network organization. Nat Rev Neurosci 2012; 13:336–349. [DOI] [PubMed] [Google Scholar]
- 32.Bernhardt BC, Bonilha L, Gross DW. Network analysis for a network disorder: the emerging role of graph theory in the study of epilepsy. Epilepsy Behav 2015. [DOI] [PubMed] [Google Scholar]
- 33.DeSalvo MN, Douw L, Tanaka N, et al. Altered structural connectome in temporal lobe epilepsy. Radiology 2014; 270:842–848. [DOI] [PMC free article] [PubMed] [Google Scholar]
- 34.Bernasconi N, Bernhardt BC. Temporal lobe epilepsy is a progressive disorder. Nat Rev Neurol 2010; 6: DOI: 10.1038/nrneurol.2009.82-c1. [DOI] [PubMed] [Google Scholar]
- 35.Wang J, Qiu S, Xu Y, et al. Graph theoretical analysis reveals disrupted topological properties of whole brain functional networks in temporal lobe epilepsy. Clin Neurophysiol 2014; 125:1744–1756. [DOI] [PubMed] [Google Scholar]
- 36.Concha L, Beaulieu C, Gross DW. Bilateral limbic diffusion abnormalities in unilateral temporal lobe epilepsy. Ann Neurol 2005; 57:188–196. [DOI] [PubMed] [Google Scholar]
- 37.Bettus G, Bartolomei F, Confort-Gouny S, et al. Role of resting state functional connectivity MRI in presurgical investigation of mesial temporal lobe epilepsy. J Neurol Neurosurg Psychiatry 2010; 81:1147–1154. [DOI] [PubMed] [Google Scholar]
- 38.Pittau F, Grova C, Moeller F, et al. Patterns of altered functional connectivity in mesial temporal lobe epilepsy. Epilepsia 2012; 53:1013–1023. [DOI] [PMC free article] [PubMed] [Google Scholar]
- 39.Bonilha L, Nesland T, Martz GU, et al. Medial temporal lobe epilepsy is associated with neuronal fibre loss and paradoxical increase in structural connectivity of limbic structures. J Neurol Neurosurg Psychiatry 2012; 83:903–909. [DOI] [PMC free article] [PubMed] [Google Scholar]
- 40.Besson P, Dinkelacker V, Valabregue R, et al. Structural connectivity differences in left and right temporal lobe epilepsy. Neuroimage 2014; 100:135–144. [DOI] [PubMed] [Google Scholar]
- 41.Wong SW, Jong L, Bandur D, et al. Cortical reorganization following anterior temporal lobectomy in patients with temporal lobe epilepsy. Neurology 2009; 73:518–525. [DOI] [PMC free article] [PubMed] [Google Scholar]
- 42.Holmes M, Folley BS, Sonmezturk HH, et al. Resting state functional connectivity of the hippocampus associated with neurocognitive function in left temporal lobe epilepsy. Hum Brain Mapp 2014; 35:735–744. [DOI] [PMC free article] [PubMed] [Google Scholar]
- 43.McDonald CR, Hagler DJ, Jr, Girard HM, et al. Changes in fiber tract integrity and visual fields after anterior temporal lobectomy. Neurology 2010; 75:1631–1638. [DOI] [PMC free article] [PubMed] [Google Scholar]
- 44.Bettus G, Guedj E, Joyeux F, et al. Decreased basal fMRI functional connectivity in epileptogenic networks and contralateral compensatory mechanisms. Hum Brain Mapp 2009; 30:1580–1591. [DOI] [PMC free article] [PubMed] [Google Scholar]
- 45.Bonilha L, Keller SS. Quantitative MRI in refractory temporal lobe epilepsy: relationship with surgical outcomes. Quant Imaging Med Surg 2015; 5:204–224. [DOI] [PMC free article] [PubMed] [Google Scholar]
- 46.Ntsambi-Eba G, Vaz G, Docquier MA, et al. Patients with refractory epilepsy treated using a modified multiple subpial transection technique. Neurosurgery 2013; 72:890–897. [DOI] [PubMed] [Google Scholar]
- 47.Pustina D, Doucet G, Evans J, et al. Distinct types of white matter changes are observed after anterior temporal lobectomy in epilepsy. PLoS One 2014; 9:e104211. [DOI] [PMC free article] [PubMed] [Google Scholar]
- 48.Sadek AR, Gray WP. Chopping and changing: long-term results of epilepsy surgery. Lancet 2011; 378:1360–1362. [DOI] [PubMed] [Google Scholar]