Abstract
To determine the relationship between the expression of phosphatase and tensin homologue (PTEN) and epidermal growth factor receptor (EGFR) in metastatic colorectal cancer (mCRC) and the clinical outcome of cetuximab-containing chemotherapy.
A total of 158 consecutive mCRC patients with wild-type KRAS status who received chemotherapy with or without cetuximab, and for whom tumor tissue was available, were enrolled. The EGFR and PTEN expression was determined by immunohistochemistry (IHC).
A total of 158 mCRC patients with wild-type KRAS status were enrolled in the study; 51 patients received chemotherapy combined with cetuximab, 107 patients received chemotherapy alone. Patients who received chemotherapy combined with cetuximab had longer overall survival (OS) compared with patients who received chemotherapy alone. High EGFR expression was detected in 60 patients (38.0%), while normal PTEN expression was detected in 60 patients (59.5%). The PTEN status was significantly related with the histological grade. For patients who received chemotherapy combined with cetuximab the median OS of patients with high-expression of EGFR was longer than the OS of patients with low EGRF expression; 25.0 versus 19.0 months, P = 0.002. For patient with normal PTEN the median OS were longer than the median OS for patients with loss of PTEN; 24.0 versus 19.0 months, P = 0.026. The overall response rate (ORR) had a borderline association with EGFR and PTEN expression (P = 0.055 and 0.048, respectively). In a multivariate analysis, ECOG PS, EGFR status, chemotherapy ± cetuximab, and the interaction of EGFR or PTEN and chemotherapy ± cetuximab were independent prognostic factors for OS.
Our findings show that chemotherapy combined with cetuximab demonstrated encouraging antitumor activity for mCRC patients with wild-type KRAS status. Especially, those who have high EGFR expression or normal PTEN expression were more likely to benefit from such a treatment strategy. Subsequent studies in clinical trial cohorts will be required to confirm the clinical utility of these markers.
INTRODUCTION
Colorectal cancer is the third most commonly diagnosed cancer in males and the second in females, with an estimated 1.4 million cases and 693,900 deaths occurring in 2012.1 About 25% of patients with colorectal cancer present with metastases at the time of diagnosis.2 Metastatic colorectal cancer (mCRC) is associated with a particular poor prognosis. Despite progress in chemotherapy during past decades, the 5-year survival rate for patients with mCRC remains below 10%.3,4 Currently, the median survival of patients with mCRC has improved to 24 to 30 months, largely due to the availability of newer treatment options, including the epidermal growth factor receptor (EGFR)-targeted monoclonal antibody (mAb) cetuximab or panitumumab, and the vascular endothelial growth factor-targeted mAb bevacizumab.5,6
Several studies have suggested that the anti-EGFR-mediated antitumor activity is restricted to patients with wild-type KRAS tumors, and selection of patients for anti-EGFR mAb therapy based on tumor KRAS analysis is a major step toward tailored treatment for mCRC.7–10 However, the response rates (RRs) to anti-EGFR mAb treatments range from 40% to 60% when used in combination with chemotherapy. That means that up to 50% of KRAS wild-type patients do not benefit from the EGFR-targeted therapy.10–12 Recently, some studies showed that mutations in other downstream effectors of the EGFR signaling pathway, such as BRAF, NRAS, and PIK3CA, seem to be responsible for this phenomenon.13,14 The negative selection of mutant genotypes downstream the EGFR modestly improved objective RRs compared with KRAS alone, indicating that additional markers are needed in order to better predict the response to anti-EGFR mAb therapy.14,15
In the present study, we assessed the phosphatase and tensin homologue (PTEN) and EGFR status with immunohistochemistry (IHC) in mCRC patients with wild-type KRAS status and their correlation with the outcome of cetuximab treatment. Our objective is to use the results to provide more markers to determine the efficacy of cetuximab therapy for patients with mCRC besides 4 mutations (KRAS, BRAF, NRAS, and PIK3CA) in downstream effectors of the EGFR signaling pathway.
METHODS
Ethics Statement
All procedures were conducted in accordance with the Helsinki declaration, and with approval from the Ethics Committee of the Fujian Provincial Cancer Hospital. Written informed consent was obtained from all participants.
Eligibility
We consecutively analyzed all the mCRC patients who were admitted to the Department of Medical Oncology of Fujian Provincial Cancer Hospital from January 2007 to December 2012. A total of 158 patients with mCRC were included in the study according to the following criteria: Histologically confirmed adenocarcinoma of the colon or rectum and KRAS exon 2 wild-type; A first occurrence of metastatic disease that was deemed to be unresectable with palliative intent; Complete medical records were available; Eastern Cooperative Oncology Group performance status (ECOG PS) between 0 and 2; No prior chemotherapy except for postoperative adjuvant chemotherapy more than 12 months before entry into the study; Adequate functioning bone marrow, liver, and kidneys; Availability of adequate formalin-fixed paraffin embedded tumor tissue for biological marker evaluation; All patients had nonrandomly received systemic chemotherapy regimens, including fluorouracil, folinic acid, and irinotecan (FOLFIRI), fluorouracil, folinic acid, and xaliplatin (FOLFOX), of at least 6 cycles; and Patients who were treated with cetuximab were to be continued until disease progression (PD), intolerable toxicity, or patient refusal of further treatment. Patients treated with bevacizumab were not included because there were too few for a meaningful subgroup analysis.
Treatment
The FOLFIRI regimen comprised a 60 to 90-minutes infusion of irinotecan at a dose of 180 mg/m2 of body-surface area, a 120-minutes infusion of racemic folinic acid at a dose of 400 mg/m2, fluorouracil as an intravenous bolus of 400 mg/m2, and then a continuous 46-houre infusion of 2400 mg/m2. The FOLFOX regimen comprised a 3-hour infusion of oxaliplatin at a dose of 85 mg/m2, a 120-minutes infusion of racemic folinic acid at a dose of 400 mg/m2, fluorouracil as an intravenous bolus of 400 mg/m2, and then a continuous 46-hour infusion of 2400 mg/m2. Patients received cetuximab at an initial dose of 400 mg/m2 intravenously followed by 250 mg/m2 intravenously on day 1 of each 7-day cycle.
Tissue Microarray (TMA)
TMA technology was employed in this study. The colorectal TMAs were prepared from our series of colorectal carcinomas samples according to the method described by Kononen et al.16 All cases were reviewed and the tumor area was marked on H&E stained slides. Tissue arrays were then constructed by placing 2 mm diameter samples from 60 different tumor samples from each block in a 6 by 10 arrangement, with 1 mm spacing separating each specimen. Cases not represented, damaged, or inadequate on the TMA sections were re-cut from the original blocks.
Immunohistochemistry (IHC)
Immunohistochemical detection of EGFR and PTEN were performed with the use of the BenchMark XT platform (Ventana Automated Systems, Tucson, AZ). The sections were stained with a rabbit anti-EGFR (MaiXin Biotechnologies, China) mab, ready to use, for 90 minutes and with the rabbit anti-PTEN mab (Boster Biological Technology Co. Ltd, lot: BA1377, China) at a dilution of 1:400, for 36 minutes. Immune complexes were detected with the use of an optiVIEW 3′3-diaminobenzidine (DAB) detection kit with DAB as the chromogen.
Evaluation of Immunostaining
The sections were scored semiquantitatively with light microscopy by 2 pathologists without any prior knowledge about the clinical history of the patients. The EGFR membrane expression and PTEN cytoplasm and nuclear expression levels were scored semiquantitatively as previously described.17–19 The intensity of the immunostaining was classified into 4 categories: 0 = no staining or only a nonspecific background color, 1 = light yellow, 2 = yellow or deep yellow, and 3 = brown or tan. The percentage of tumor cells showing the different staining intensities were visually assessed. The IHC score of immunoreactivity was obtained by multiplying the intensity and percentage of cells staining. We generate an EGFR and a PTEN IHC score on a continuous scale of 0 to 300.
EGFR histochemical scores were divided into 2 groups, cases with scores of 0 to 199 were defined as the low-expression group, and cases with scores of 200 to 300 were defined as the high-expression group. PTEN histochemical scores were separated into PTEN loss (cases with a score of 0) group or PTEN-normal (cases with score >0) group.
Evaluation of Efficacy and Toxicity
The patients were evaluated with computed tomography or magnetic resonance imaging scans before systemic treatment and every 1 to 2 months until progression, according to the Response Evaluation Criteria in Solid Tumors version 1.1, or death.20 Overall survival (OS) was defined from the date of initial treatment to death from any cause.
A complete blood cell count and measurements of liver and renal function were assessed at least once a week during treatment. Nonhematological toxicities were also verified at least once a week by patient interview and physical examination. Toxicity was graded according to the National Cancer Institute Common Toxicity Criteria version 3.0.21
Statistical Methods
Statistical analysis was performed with the SPSS software (Version 21.0, SPSS). Comparisons between proportions were analyzed using the χ2 test and the Fisher exact probability test. The OS variables were estimated by the Kaplan–Meier method and survival curves were plotted. Two-sided log-rank tests were used to compare survival rates between groups. Multivariate analyses using the Cox proportional hazards regression model were performed to assess the impact of the variables on OS.
RESULTS
Patient Characteristics and Clinical Data
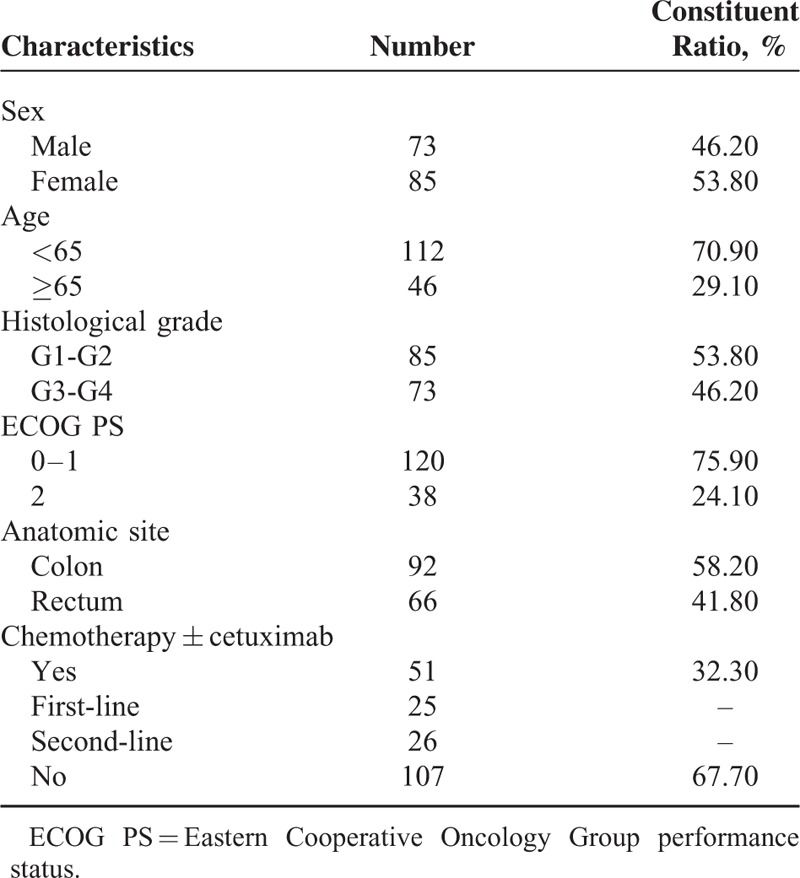
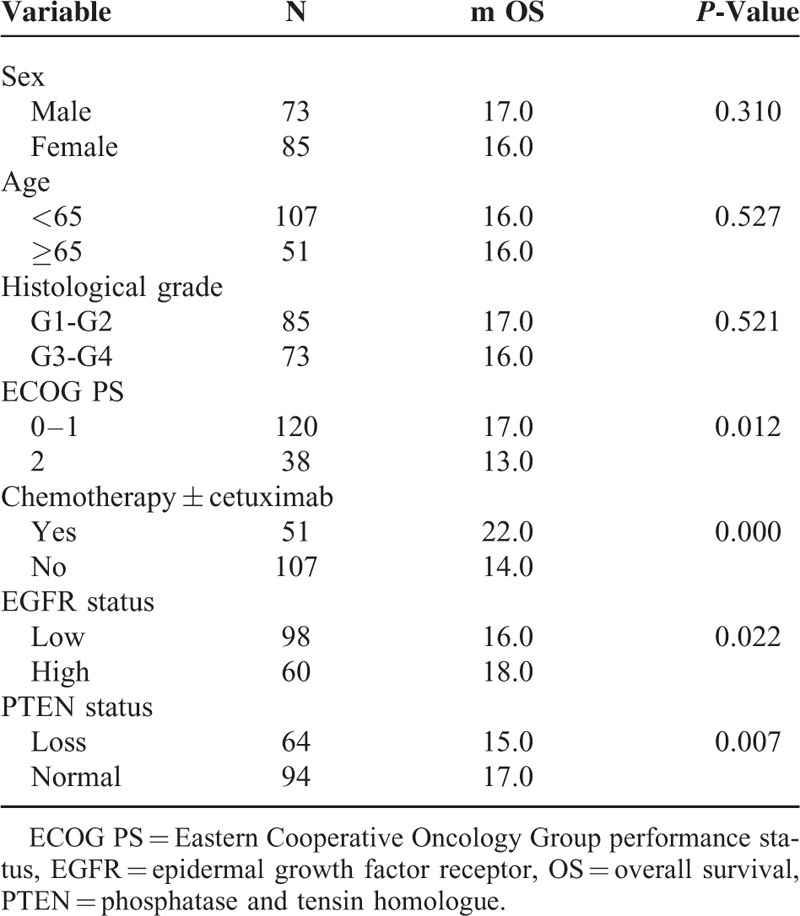
A total of 158 mCRC patients with wild-type KRAS status were enrolled in the study. Fifty-one patients received chemotherapy combined with cetuximab; 25 patients received cetuximab as first-line, and 26 patients received cetuximab as second-line therapy. One hundred and seven patients received chemotherapy alone. For 158 patients, 28 patients received only first-line chemotherapy, and 130 patients received second-line chemotherapy after disease progression. The patient characteristics are summarized in Table 1.
Table 1.
Patient Characteristics (N = 158)
EGFR and PTEN Expression
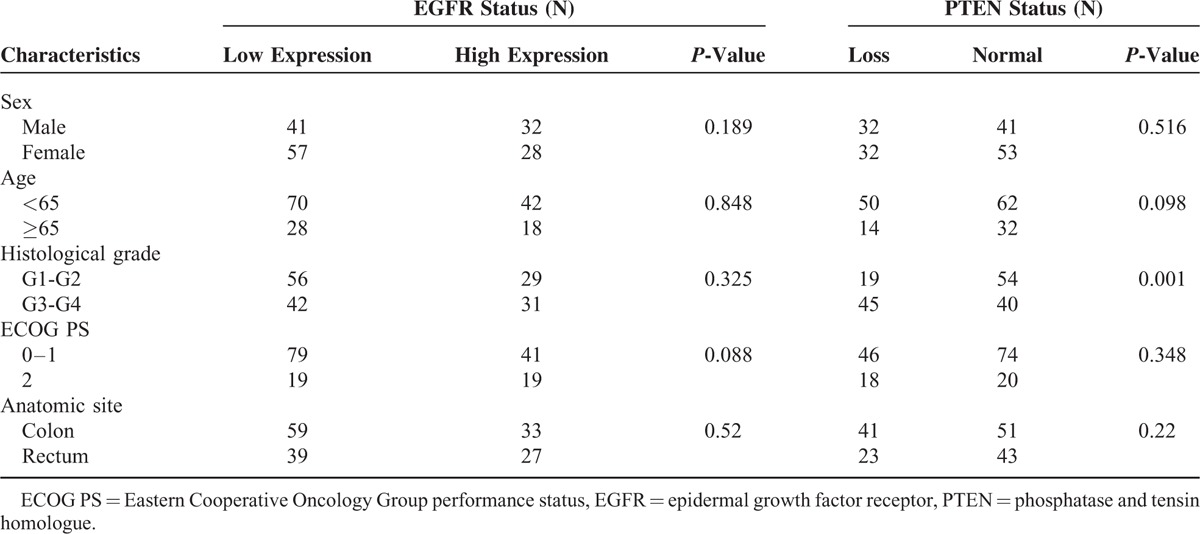
The EGFR protein expression in the tumor tissues was broadly homogenous and was detected mainly at the cell membrane. The PTEN protein expression was detected mainly in the cytoplasm, although occasional nuclear expression was seen (Figure 1). High-expression of EGFR protein, a histochemical scores ≥200, was documented by IHC in 60 of 158 samples (38.0%), while with normal PTEN expression a histochemical score >0, was documented in 94 of 158 sample (59.5%). There were no significant clinical differences between the EGFR or PTEN expression and clinicopathologic features except that PTEN loss was significantly association with the histological grade, P = 0.001. Various patient characteristics according to EGFR and PTEN are shown in Table 2.
FIGURE 1.
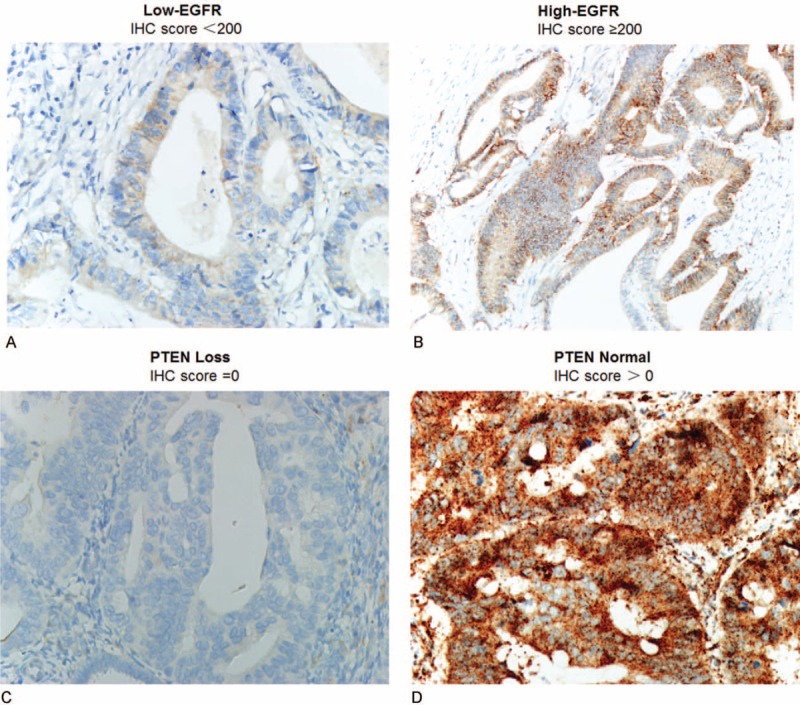
Representative-stained tumor sections from the 158 patients. EGFR low-expression in colorectal cancer (A), EGFR high-expression in colorectal cancer (B), PTEN loss in colorectal cancer (C), and PTEN normal in colorectal cancer (D). EGFR = epidermal growth factor receptor, PTEN = phosphatase and tensin homologue.
Table 2.
Correlation Between EGFR/PTEN Status and Patient Characteristics
Survival Analysis and Objective Response Rate
For the 158 patients, the median OS was 16.0 months, 95% CI = (14.68–17.32), and the 1-year survival rate and 2-year survival rate were 73.4% and 15.2%, respectively (Figure 2A). In the univariate analysis, ECOG PS, chemotherapy ± cetuximab, lines of chemotherapy, EGFR status, and PTEN status were associated with OS, while the sex, age, and histological grade were not correlated with OS (Table 3). The median OS of patients in the chemotherapy + cetuximab group was significantly longer than for those in the chemotherapy group, 22.0 versus 14.0 months, by log-rank test P < 0.001 (Figure 2B).
FIGURE 2.
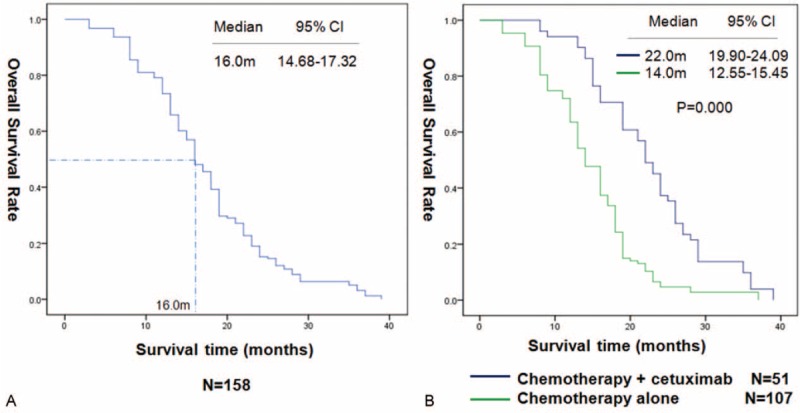
Kaplan–Meier curves for overall survival (OS) in 158 patients (A). OS in the patients received chemotherapy combined with or not cetuximab (B).
Table 3.
Univariate Analysis of Factors Associated With Overall Survival of 158 Patients
To confirm the importance of the cetuximab therapy for the KRAS wild-type mCRC patients when correlated with the expression of EGFR or PTEN, we divided the 158 patients into a chemotherapy + cetuximab group and a chemotherapy group. For the patients in the chemotherapy + cetuximab group, the median OS of patients with high-expression of EGFR the median OS was higher than in the patients with low expression; 25.0 versus 19.0 months, P = 0.002. Patients with normal PTEN had a longer median OS than patients with loss of PTEN; 24.0 versus 19.0 months, P = 0.026 (Figure 3A, B). In the chemotherapy group, the median OS was not significantly different between the EGFR high-expression and low-expression patients, P = 0.616, while patients with normal PTEN had longer median OS than those with loss of PTEN loss, P = 0.036 (Figure 4A, B).
FIGURE 3.

OS in 51 patients received chemotherapy combined with cetuximab by EGFR expression (A). OS in 51 patients received chemotherapy combined with cetuximab by PTEN expression (B). EGFR = epidermal growth factor receptor, OS = overall survival, PTEN = phosphatase and tensin homologue.
FIGURE 4.
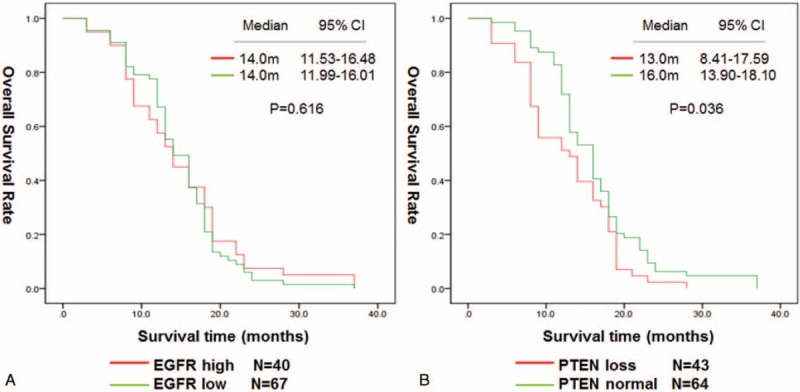
OS in 107 patients received chemotherapy alone by EGFR expression (A). OS in 107 patients received chemotherapy alone by PTEN expression (B). EGFR = epidermal growth factor receptor (EGFR), OS = overall survival, PTEN = phosphatase and tensin homologue.
Furthermore, analysis of the objective RR for the chemotherapy + cetuximab group showed that the proportion of patients who achieved a response was higher in the EGFR high group than in the EGFR low group; 14/20 (70.0%) versus 11/31 (35.5%) P = 0.055. The overall response rate (ORR) was higher in the normal PTEN group than in the loss of PTEN group; 17/30 (56.7%) versus 8/21 (38.1%), P = 0.048 (Table 4).
Table 4.
Efficacy in the 51 Patients for EGFR and PTEN Expression
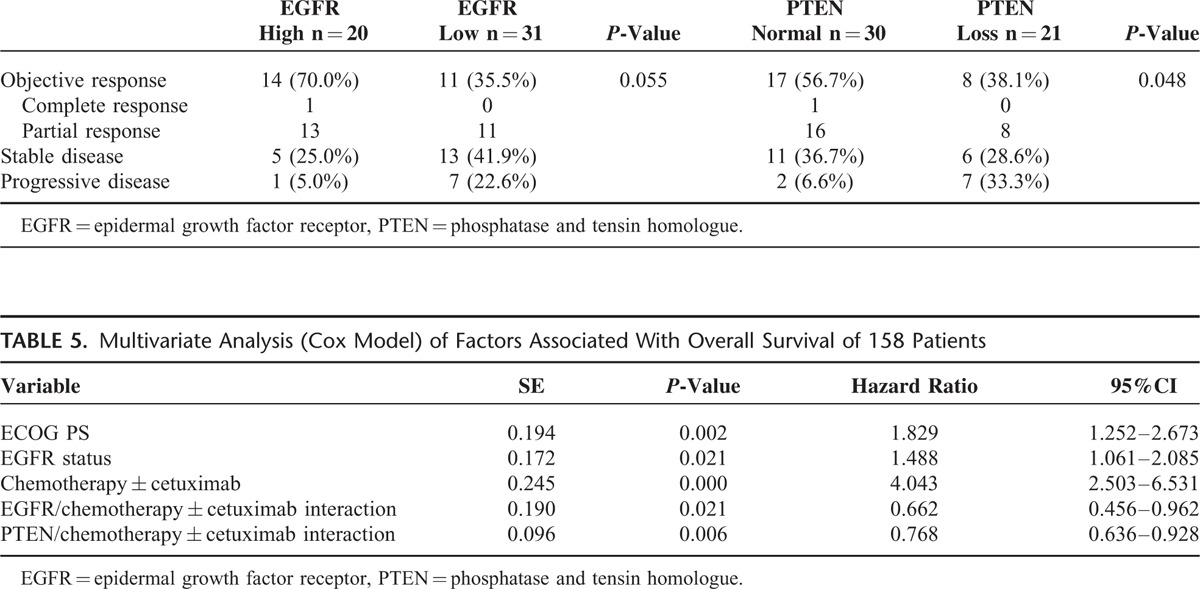
In the multivariate analysis, considering chemotherapy ± cetuximab was the most statistically significant factor, we adjust chemotherapy ± cetuximab as a correction factor, variables that included ECOG PS, lines of chemotherapy, EGFR status, PTEN status, chemotherapy ± cetuximab, and the interaction of EGFR or PTEN and chemotherapy ± cetuximab were tested to determine their independent effect on OS. The ECOG PS, EGFR status, chemotherapy ± cetuximab, and the interaction of EGFR or PTEN and chemotherapy ± cetuximab were independent prognostic factors for OS (Table 5), which were consistent with the results of the univariate subgroup analysis.
Table 5.
Multivariate Analysis (Cox Model) of Factors Associated With Overall Survival of 158 Patients

DISCUSSION
In this study, we have characterized high tumor EGFR and normal PTEN expression as predictive biomarkers that, independently of tumor histology, EGOG PS, or regimens of chemotherapy, defines patients with wild-type KRAS mCRC who are most likely to derive a survival benefit and objective response from the addition of cetuximab to chemotherapy.
The EGFR-directed mAb cetuximab was approved to treat patients with chemo-refractory mCRC in 2004 and achieved objective RRs of approximately 10% when used as monotherapy for irinotecan-refractory and/or oxaliplatin-refractory mCRC.22 Since then, a rapidly accumulating body of knowledge has indicated that resistance to EGFR blockade in mCRC is related to constitutive activation of signaling pathways downstream of the EGFR, particularly interesting is the role of mutations within the KRAS oncogene due to their association with the lack of a benefit from anti-EGFR mAb therapy.23–25 Because not all KRAS wild-type patients benefit from treatment with EGFR-directed therapy, basic and clinical research has been conducted to identify additional mutations which would be resistant, and that could account for the heterogeneity in the clinical response; such as BRAF, NRAS, and PIK3CA.14,15,19 These markers are good negative predictive factors, but scientists and clinicians would prefer to identify the positive predictive factors of response to anti-EGFR therapy which would be much more useful than negative predictors in the clinical setting.26,27
The EGFR gene copy number, as determined by FISH analysis, seemed to correlate with the response to anti-EGFR mAbs for patients with wild-type KRAS mCRC in several studies.18,28,29 Gene amplification may lead to protein over-expression.30,31 Findings from the FLEX study showed that high EGFR expression determined by IHC is a tumor biomarker that can predict the survival benefit from the addition of cetuximab to first-line chemotherapy in patients with advanced nonsmall cell lung cancer.17 In our study, we assessed the EGFR status by IHC according to the histochemical score with respect to the percentage of positive cells and staining intensity, which showed that patients with high EGFR expression who received chemotherapy combined with cetuximab, gained higher ORR and survival benefits. However, for the wild-type mCRC patients who received chemotherapy alone, EGFR expression was not associated with OS. This was confirmed by the multivariate analysis and the results are in accordance with previous studies.18,29,32 We did not use the FISH analysis for EGFR because the colorectal sample came from the record of our hospital between January 2007 and December 2012, so that most pathological samples are over 5-years old. This means that there may be false-negative results in the FISH assay. As a consequence, we selected only the immunohistochemical test.
PTEN is a tumor-suppressor protein that regulates the activity of PI3K/AKT by converting PIP3 back to PIP2, the loss of PTEN results in AKT-mediated hyper-phosphorylation, which protects cells from apoptosis and makes them resistance to anti-EGFR therapy.33–35 We have also shown that PTEN expression was associated with OS and ORR in a chemotherapy combined with cetuximab cohort. Furthermore, the PTEN status was significantly related with the histological grade, and interaction of PTEN/chemotherapy ± cetuximab was an independent prognostic factor for mCRC patients with wild-type KRAS. It means that PTEN loss may be a potential predictor for the cetuximab therapy outcome. This result is consistent with basic research and previous translational research.
Based on our findings, we think that for colorectal cancer patients with wild type KRAS, the test for the PTEN gene helps to estimate the prognosis of patients. As for patients who are going to use cetuximab, further tests of PTEN and EGFR are conducive to better define the patients who will respond effectively to the treatment, apart from using past mutation tests like NRAS, BRAF, and PIK3CA.
Interpreting EGFR and PTEN data can be challenging, because IHC can produce variable results. A standard universally accepted EGFR and PTEN testing and scoring system, to allow for comparisons of data worldwide, has yet to be established. According to early research, we chose the semiquantitative IHC, and positive results have been observed by our research group. Compared to the expensive FISH assay, the IHC test is not only more economical but it will also be easy to popularize. If future research confirms these promising results, then testing for EGFR over-expression and normal PTEN will further identify the patient subgroups that will benefit from anti-EGFR therapy.
Our results are limited by the retrospective nature of the analysis, and the small sample size of the cetuximab group. Therefore, a treatment model for using the EGFR and PTNE status expression as a guide for anti-EGFR therapy for mCRC patients with wild-type KRAS needs further investigation with an expanded sample size in further prospective clinical studies.
In conclusion, this study indicated that chemotherapy combined with cetuximab demonstrated encouraging antitumor activity for mCRC patients with wild-type KRAS status. Especially, those who harbored high EGFR expression or normal PTEN expression were more likely to benefit from such a treatment strategy.
Acknowledgments
The authors thank everyone at our institution who helped with this study. The project was supported by the Foundation of the Natural Science Foundation of Fujian Province (Grant No. 2014J01298) and the National Clinical Key Specialty Construction Program.
Footnotes
Abbreviations: ECOG PS = Eastern Cooperative Oncology Group performance status, EGFR = epidermal growth factor receptor, IHC = immunohistochemistry, mAb = monoclonal antibody, mCRC = metastatic colorectal cancer, ORR = overall response rate, OS = overall survival, PTEN = phosphatase and tensin homologue, RR = response rate, TMA = tissue microarray.
YC and YS contributed equally to this work.
The project was supported by the Foundation of the Natural Science Foundation of Fujian Province (Grant No. 2014J01298) and the National Clinical Key Specialty Construction Program.
The authors have no conflicts of interest to disclose.
REFERENCES
- 1.Torre LA, Bray F, Siegel RL, et al. Global cancer statistics, 2012. CA Cancer J Clin 2015; 65:87–108. [DOI] [PubMed] [Google Scholar]
- 2.Siegel R, Desantis C, Jemal A. Colorectal cancer statistics, 2014. CA Cancer J Clin 2014; 64:104–117. [DOI] [PubMed] [Google Scholar]
- 3.Siegel R, Desantis C, Jemal A. Colorectal cancer statistics, 2014. CA Cancer J Clin 2014; 64:104–117. [DOI] [PubMed] [Google Scholar]
- 4.Giessen C, Laubender RP, Ankerst DP, et al. Progression-free survival as a surrogate endpoint for median overall survival in metastatic colorectal cancer: literature-based analysis from 50 randomized first-line trials. Clin Cancer Res 2013; 19:225–235. [DOI] [PubMed] [Google Scholar]
- 5.Sclafani F, Cunningham D. Cetuximab or bevacizumab in metastatic colorectal cancer? Lancet Oncol 2014; 15:1040–1041. [DOI] [PubMed] [Google Scholar]
- 6.Brenner H, Kloor M, Pox CP. Colorectal cancer. Lancet 2014; 383:1490–1502. [DOI] [PubMed] [Google Scholar]
- 7.Khambata-Ford S, Garrett CR, Meropol NJ, et al. Expression of epiregulin and amphiregulin and K-ras mutation status predict disease control in metastatic colorectal cancer patients treated with cetuximab. J Clin Oncol 2007; 25:3230–3237. [DOI] [PubMed] [Google Scholar]
- 8.De Roock W, Piessevaux H, De Schutter J, et al. KRAS wild-type state predicts survival and is associated to early radiological response in metastatic colorectal cancer treated with cetuximab. Ann Oncol 2008; 19:508–515. [DOI] [PubMed] [Google Scholar]
- 9.Amado RG, Wolf M, Peeters M, et al. Wild-type KRAS is required for panitumumab efficacy in patients with metastatic colorectal cancer. J Clin Oncol 2008; 26:1626–1634. [DOI] [PubMed] [Google Scholar]
- 10.Barni S, Ghilardi M, Borgonovo K, et al. Cetuximab/irinotecan-chemotherapy in KRAS wild-type pretreated metastatic colorectal cancer: a pooled analysis and review of literature. Rev Recent Clin Trials 2013; 8:101–109. [DOI] [PubMed] [Google Scholar]
- 11.Van Cutsem E, Peeters M, Siena S, et al. Open-label phase III trial of panitumumab plus best supportive care compared with best supportive care alone in patients with chemotherapy-refractory metastatic colorectal cancer. J Clin Oncol 2007; 25:1658–1664. [DOI] [PubMed] [Google Scholar]
- 12.Karapetis CS, Khambata-Ford S, Jonker DJ, et al. K-ras mutations and benefit from cetuximab in advanced colorectal cancer. N Engl J Med 2008; 359:1757–1765. [DOI] [PubMed] [Google Scholar]
- 13.Allegra CJ, Jessup JM, Somerfield MR, et al. American Society of Clinical Oncology provisional clinical opinion: testing for KRAS gene mutations in patients with metastatic colorectal carcinoma to predict response to anti-epidermal growth factor receptor monoclonal antibody therapy. J Clin Oncol 2009; 27:2091–2096. [DOI] [PubMed] [Google Scholar]
- 14.De Roock W, Claes B, Bernasconi D, et al. Effects of KRAS, BRAF, NRAS, and PIK3CA mutations on the efficacy of cetuximab plus chemotherapy in chemotherapy-refractory metastatic colorectal cancer: a retrospective consortium analysis. Lancet Oncol 2010; 11:753–762. [DOI] [PubMed] [Google Scholar]
- 15.De Roock W, De Vriendt V, Normanno N, et al. KRAS, BRAF, PIK3CA, and PTEN mutations: implications for targeted therapies in metastatic colorectal cancer. Lancet Oncol 2011; 12:594–603. [DOI] [PubMed] [Google Scholar]
- 16.Kononen J, Bubendorf L, Kallioniemi A, et al. Tissue microarrays for high-throughput molecular profiling of tumor specimens. Nat Med 1998; 4:844–847. [DOI] [PubMed] [Google Scholar]
- 17.Pirker R, Pereira JR, von Pawel J, et al. EGFR expression as a predictor of survival for first-line chemotherapy plus cetuximab in patients with advanced non-small-cell lung cancer: analysis of data from the phase 3 FLEX study. Lancet Oncol 2012; 13:33–42. [DOI] [PubMed] [Google Scholar]
- 18.Algars A, Lintunen M, Carpen O, et al. EGFR gene copy number assessment from areas with highest EGFR expression predicts response to anti-EGFR therapy in colorectal cancer. Br J Cancer 2011; 105:255–262. [DOI] [PMC free article] [PubMed] [Google Scholar]
- 19.Laurent-Puig P, Cayre A, Manceau G, et al. Analysis of PTEN, BRAF, and EGFR status in determining benefit from cetuximab therapy in wild-type KRAS metastatic colon cancer. J Clin Oncol 2009; 27:5924–5930. [DOI] [PubMed] [Google Scholar]
- 20.Therasse P, Arbuck SG, Eisenhauer EA, et al. New guidelines to evaluate the response to treatment in solid tumors. European Organization for Research and Treatment of Cancer, National Cancer Institute of the United States, National Cancer Institute of Canada. J Natl Cancer Inst 2000; 92:205–216. [DOI] [PubMed] [Google Scholar]
- 21.Trotti A, Colevas AD, Setser A, et al. CTCAE v3.0: development of a comprehensive grading system for the adverse effects of cancer treatment. Semin Radiat Oncol 2003; 13:176–181. [DOI] [PubMed] [Google Scholar]
- 22.Saltz LB, Meropol NJ, Loehrer PS, et al. Phase II trial of cetuximab in patients with refractory colorectal cancer that expresses the epidermal growth factor receptor. J Clin Oncol 2004; 22:1201–1208. [DOI] [PubMed] [Google Scholar]
- 23.Karapetis CS, Khambata-Ford S, Jonker DJ, et al. K-ras mutations and benefit from cetuximab in advanced colorectal cancer. N Engl J Med 2008; 359:1757–1765. [DOI] [PubMed] [Google Scholar]
- 24.Amado RG, Wolf M, Peeters M, et al. Wild-type KRAS is required for panitumumab efficacy in patients with metastatic colorectal cancer. J Clin Oncol 2008; 26:1626–1634. [DOI] [PubMed] [Google Scholar]
- 25.Maughan TS, Adams RA, Smith CG, et al. Addition of cetuximab to oxaliplatin-based first-line combination chemotherapy for treatment of advanced colorectal cancer: results of the randomised phase 3 MRC COIN trial. Lancet 2011; 377:2103–2114. [DOI] [PMC free article] [PubMed] [Google Scholar]
- 26.Troiani T, Zappavigna S, Martinelli E, et al. Optimizing treatment of metastatic colorectal cancer patients with anti-EGFR antibodies: overcoming the mechanisms of cancer cell resistance. Expert Opin Biol Ther 2013; 13:241–255. [DOI] [PubMed] [Google Scholar]
- 27.Vecchione L, Jacobs B, Normanno N, et al. EGFR-targeted therapy. Exp Cell Res 2011; 317:2765–2771. [DOI] [PubMed] [Google Scholar]
- 28.Shen WD, Chen HL, Liu PF. EGFR gene copy number as a predictive biomarker for resistance to anti-EGFR monoclonal antibodies in metastatic colorectal cancer treatment: a meta-analysis. Chin J Cancer Res 2014; 26:59–71. [DOI] [PMC free article] [PubMed] [Google Scholar]
- 29.Yang ZY, Shen WX, Hu XF, et al. EGFR gene copy number as a predictive biomarker for the treatment of metastatic colorectal cancer with anti-EGFR monoclonal antibodies: a meta-analysis. J Hematol Oncol 2012; 5:52. [DOI] [PMC free article] [PubMed] [Google Scholar]
- 30.Lopez F, Llorente JL, Oviedo CM, et al. Gene amplification and protein overexpression of EGFR and ERBB2 in sinonasal squamous cell carcinoma. Cancer 2012; 118:1818–1826. [DOI] [PubMed] [Google Scholar]
- 31.Shao MM, Zhang F, Meng G, et al. Epidermal growth factor receptor gene amplification and protein overexpression in basal-like carcinoma of the breast. Histopathology 2011; 59:264–273. [DOI] [PubMed] [Google Scholar]
- 32.Razis E, Pentheroudakis G, Rigakos G, et al. EGFR gene gain and PTEN protein expression are favorable prognostic factors in patients with KRAS wild-type metastatic colorectal cancer treated with cetuximab. J Cancer Res Clin Oncol 2014; 140:737–748. [DOI] [PMC free article] [PubMed] [Google Scholar]
- 33.Asghar U, Hawkes E, Cunningham D. Predictive and prognostic biomarkers for targeted therapy in metastatic colorectal cancer. Clin Colorectal Cancer 2010; 9:274–281. [DOI] [PubMed] [Google Scholar]
- 34.Eklof V, Wikberg ML, Edin S, et al. The prognostic role of KRAS, BRAF, PIK3CA and PTEN in colorectal cancer. Br J Cancer 2013; 108:2153–2163. [DOI] [PMC free article] [PubMed] [Google Scholar]
- 35.Jhawer M, Goel S, Wilson AJ, et al. PIK3CA mutation/PTEN expression status predicts response of colon cancer cells to the epidermal growth factor receptor inhibitor cetuximab. Cancer Res 2008; 68:1953–1961. [DOI] [PMC free article] [PubMed] [Google Scholar]


