Supplemental Digital Content is available in the text
Abstract
Quantitative imaging using radiomics can capture distinct phenotypic differences between tumors and may have predictive power for certain phenotypes according to specific genetic mutations. We aimed to identify the clinicoradiologic predictors of tumors with ALK (anaplastic lymphoma kinase), ROS1 (c-ros oncogene 1), or RET (rearranged during transfection) fusions in patients with lung adenocarcinoma.
A total of 539 pathologically confirmed lung adenocarcinomas were included in this retrospective study. The baseline clinicopathologic characteristics were retrieved from the patients’ medical records and the ALK/ROS1/RET fusion status was reviewed. Quantitative computed tomography (CT) and positron emission tomography imaging characteristics were evaluated using a radiomics approach. Significant features for the fusion-positive tumor prediction model were extracted from all of the clinicoradiologic features, and were used to calculate diagnostic performance for predicting 3 fusions’ positivity. The clinicoradiologic features were compared between ALK versus ROS1/RET fusion-positive tumors to identify the clinicoradiologic similarity between the 2 groups.
The fusion-positive tumor prediction model was a combination of younger age, advanced tumor stage, solid tumor on CT, higher values for SUVmax and tumor mass, lower values for kurtosis and inverse variance on 3-voxel distance than those of fusion-negative tumors (sensitivity and specificity, 0.73 and 0.70, respectively). ALK fusion-positive tumors were significantly different in tumor stage, central location, SUVmax, homogeneity on 1-, 2-, and 3-voxel distances, and sum mean on 2-voxel distance compared with ROS1/RET fusion-positive tumors.
ALK/ROS1/RET fusion-positive lung adenocarcinomas possess certain clinical and imaging features that enable good discrimination of fusion-positive from fusion-negative lung adenocarcinomas.
INTRODUCTION
Recently, chromosomal rearrangements that lead to gene fusions have emerged as important oncogenic drivers of lung cancer. The anaplastic lymphoma kinase (ALK) rearrangement has been identified as a novel oncogenic event in lung adenocarcinoma,1–4 and represents an important breakthrough in lung cancer management. ALK fusion-positive lung cancer shows a dramatic clinical response to ALK inhibitors, crizotinib (Xalkori; Pfizer, New York, NY).1,5–7 The success of crizotinib in the management of ALK fusion-positive patients has elicited efforts to find new oncogenic fusion genes, such as ROS1 (c-ros oncogene 1) and RET (rearranged during transfection), and has revealed that patients with nonsmall cell lung cancer (NSCLC) that is ROS1 or RET fusion-positive are also highly sensitive to crizotinib treatment.3,7–9 Subsequently, tumors that are ROS1/RET fusion-positive have become of clinical interest in patients with lung cancer. Thus, the specific characteristics of fusion-positive tumors must be adequately defined in order to effectively screen and identify patients with fusion-positive NSCLC.
Accordingly, studies have recently been conducted to find certain clinicopathologic characteristics of fusion-positive lung adenocarcinoma, and have evaluated the relationship with some particular clinicopathologic features.8,10–16Meanwhile, imaging-based characterization of fusion-positive tumors to optimize patient stratification is becoming of paramount clinical relevance. Because histologic and molecular examination information through invasive biopsy is often derived from only a portion of a generally heterogeneous tumor, and therefore, the characterization does not provide a complete representation of the lesion's functional and physiologic properties.17 Although some investigations have characterized the morphology of tumors on computed tomography (CT) images, these characteristics are typically described subjectively and qualitatively.18,19 On the other hand, noninvasive predictive biomarkers have recently been identified for using accurate quantitative imaging descriptors in line with advances in image-processing technique. We hypothesize that these imaging features could help seize the distinct phenotypic differences of tumors and may have predictive power for certain phenotypes attributed to genetic mutation.
Thus, we conducted a study to find not only the qualitative but also the quantitative CT and positron emission tomography (PET) features allowing us to discriminate fusion-positive tumors by adopting a radiomics approach. Our main purpose was to explore the potential of multifunctional imaging in providing predictors for fusion-positive tumors while using quantitative CT and PET radiomics approach in patients with lung adenocarcinoma. Our ultimate goal was to identify useful predictive characteristics of fusion status and to further develop treatment strategies.
PATIENTS AND METHODS
Patients
We acquired patient data from a single-tube assay study,20 conducted from January 2008 to January 2013. This retrospective study conducted at a single tertiary center was approved by the Institutional Review Board of the Samsung Medical Center (IRB File No. 2014-09-064). Informed consent was waived. We included 759 subjects with lung adenocarcinoma, irrespective of gender, or smoking history. The criteria used for patient selection included: availability of tumor tissue, genetic data (ALK, ROS1, or RET fusion-positive), CT available for initial diagnosis and quantitative image analysis and 18F-fluorodeoxyglucose (FDG) PET/CT for initial diagnosis. Ultimately, a total of 539 patients were included in this study.
Data Collection, Histopathologic Classification, and Mutational Analyses
Study data were collected using electronic medical records. Clinical characteristics evaluated at the time of diagnostic work-up.
Histologic subtypes and the differentiation status of the lung adenocarcinomas were classified according to the new International Association for the Study of Lung Cancer/American Thoracic Society/European Respiratory Society (IASLC/ATS/ERS) multidisciplinary classification of lung adenocarcinoma.21
For molecular analysis, genomic DNA or RNA was extracted from lung tumors using standard protocols (RNeasy Mini Kit and QiAamp DNA Mini Kit, Qiagen, Hilden, Germany). ALK, ROS1, and RET fusion assay using nCounter™ gene expression assays were custom-designed and synthesized by NanoString Technologies (Seattle, WA), as previously described.20
Image Acquisition
PET—See Appendix S1, http://links.lww.com/MD/A460.
CT—Helical CT images were all obtained with a 64-detector row (LightSpeed VCT, GE Healthcare, Waukesha, WI) CT scanner (125 mA, 120 kVp, beam width of 10–20 mm, beam pitch of 1.375–1.500). The image data were reconstructed with a section thickness of 2.5 mm. Details are described in Appendix S2, http://links.lww.com/MD/A460.
Image Analysis
A qualitative analysis of solidity was recorded for each patient. Tumor size and location were also recorded. Additionally, the presence of lymphangitic metastasis, pleural effusion, and central or peripheral location were evaluated. Examples of CT images showing typical qualitative features of lung adenocarcinomas are shown in Figure S1, http://links.lww.com/MD/A460
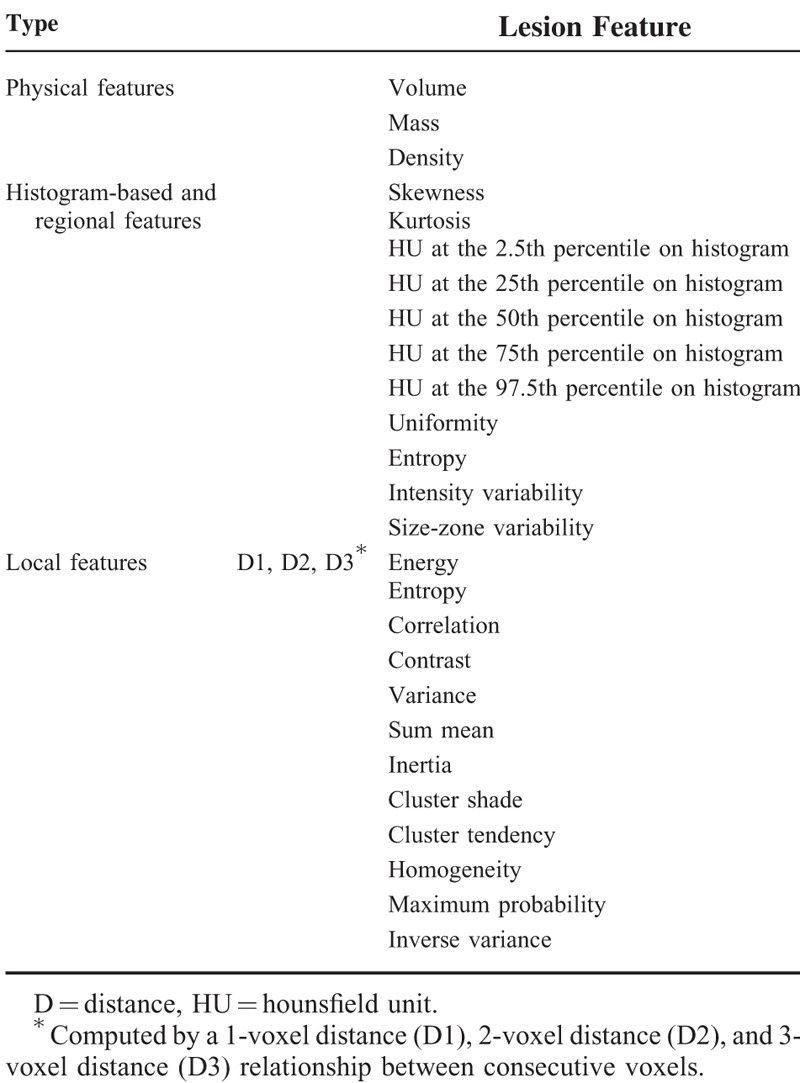
In the quantitative analysis, regions of interest (ROIs) were delineated on the axial images to generate a volume of interest which included the entire target lesion (Fig. 1). Initially, we evaluated the stability of various quantitative CT features with intra-observer reliability, which were calculated by intra-class correlation coefficients (ICC) in 25 randomly selected patients. Quantitative CT analysis was performed based on physical, histogram-based, regional, and local features from the manually derived ROI. Details are described in Appendix S3, http://links.lww.com/MD/A460. A total of 50 quantitative CT features were analyzed and the categorization of all features is presented in Table 1. As for PET analysis, SUVmax was extracted from the primary tumor in the PET images for each patient.
FIGURE 1.
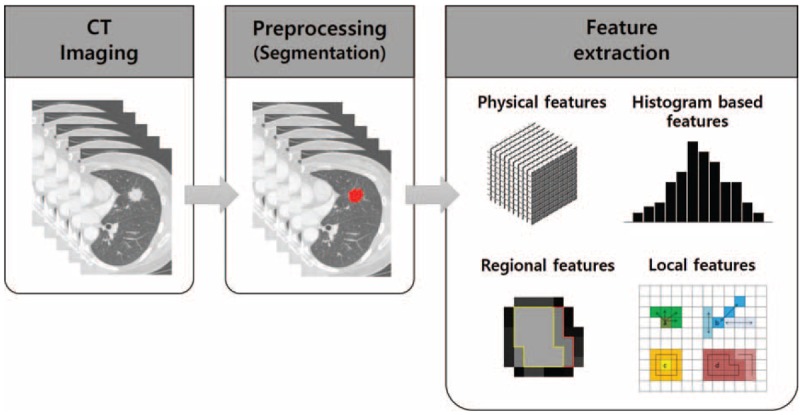
Extracting quantitative imaging features from CT images. Tumors were segmented by drawing regions of interest for the whole tumor; next, resampled images of voxel-based CT numbers were collected. The physical, histogram-based, regional, and local features were then obtained. CT = computed tomography.
TABLE 1.
Fifty Quantitative CT Features Used to Differentiate Fusion-Positive From Fusion-Negative Lung Adenocarcinomas
Data Management and Statistical Analysis
Patients were divided into the following 2 groups: the fusion-positive group and the fusion-negative group. The presence or absence of concurrent epidermal growth factor receptor (EGFR) mutation was assessed. These 2 groups were compared with respect to clinicopathologic characteristics. A Chi-squared test and Student t test were used to compare categorical and continuous variables among the 2 groups, respectively.
The derivation and validation of the fusion-positive imaging biomarker are described below. In order to maximize our ability to discriminate between fusion-positive or negative status, we intentionally designed the dataset to contain equal numbers of patients with fusion-positive and fusion-negative lung adenocarcinomas using random sampling (64 patients with fusion-positive lung adenocarcinomas vs 64 patients with fusion-negative lung adenocarcinomas).
Clinical qualitative/quantitative image feature data were used to establish a discriminator of fusion-positive status. We utilized 4 clinical features and 57 image features (SUVmax, 6 qualitative features and 50 quantitative variables consisting of physical, histogram-based, regional, and local features) as the input to define potential associations with the underlying fusion status (Table 1). The P value of 61 features was calculated using a t test or Chi-squared test. Features with a P value < 0.1 were selected as significant features for fusion-positive status (noncategorical selection). Then, to remove redundancy within the radiomic information as in Hugo et al,22 we selected a more significant feature from each of the 6 categories, which consisted of the 4 image feature categories (qualitative, physical, histogram-based, regional, and local features), clinical features and SUVmax for categorical selection. Tenfold cross-validation was used to evaluate the performance of the prediction model23 based on sensitivity, specificity, and positive and negative predictive values (Fig. 2).
FIGURE 2.
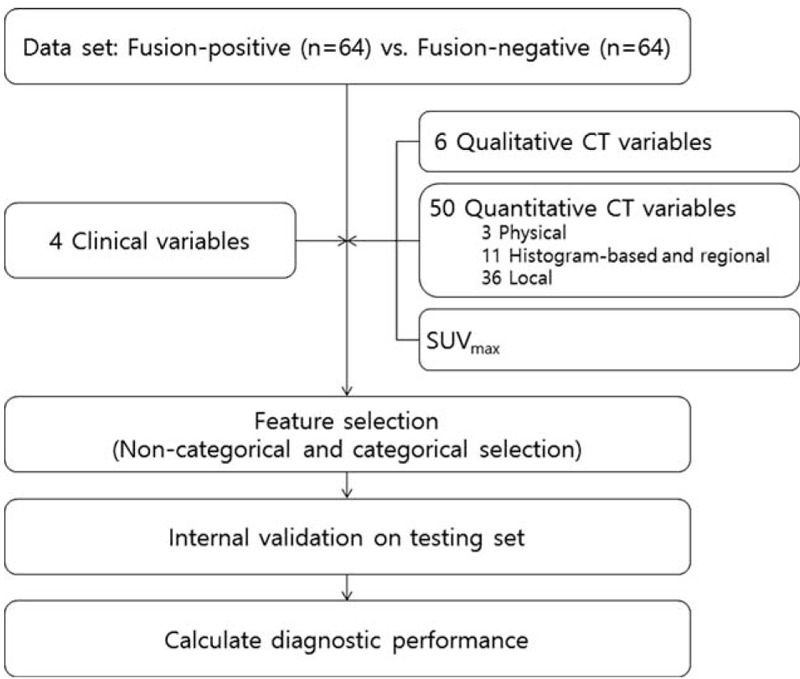
Development of the fusion-positive tumor prediction model.
Overall survival (OS) and recurrence-free survival (RFS) were calculated for patients who underwent curative operations for lung adenocarcinoma (see Appendix S4, http://links.lww.com/MD/A460).
Internal Validation
The tenfold cross-validation method randomly divided the samples into 10 subsets of roughly equal size.24 At each of 10 iterations, 9 subsets were used as a training set and the remaining set was used as a test set. A logistic regression model was applied to help the training set fit to the prediction model. Performance measures were calculated by applying the fitted prediction model to the test set.
RESULTS
Of the 539 lung adenocarcinoma patients, 47 patients had ALK fusion (8.7%) and 17 patients had ROS1/RET fusion (3.2%); therefore, 64 patients were in the fusion-positive group (11.9%). The ALK/ROS1/RET fusions were mutually exclusive. In the fusion-positive group, 2 patients had concurrent EGFR mutations (EGFR+) and 42 patients had no EGFR mutation (EGFR−) (see Figure S2, http://links.lww.com/MD/A460). The ICC showed “perfect” agreement (0.916–0.999) on all quantitative CT features in 25 patients.
Clinicopathologic Characteristics of ALK/ROS1/RET Fusion-Positive Lung Adenocarcinomas
A comparison of the clinicopathological and histologic characteristics of patients with ALK/ROS1/RET fusion is provided in Table 2. Patients in the fusion-positive group were significantly younger and more likely to have been never-smokers than patients in the fusion-negative group (P < 0.001 and P = 0.042). The gender of patients in the fusion-negative group with EGFR− (fusion-EGFR−) was significantly different compared to the fusion-positive group (P = 0.001).
TABLE 2.
Comparison of Clinicopathologic and Histologic Characteristics of Fusion-Positive and Fusion-Negative Lung Adenocarcinomas
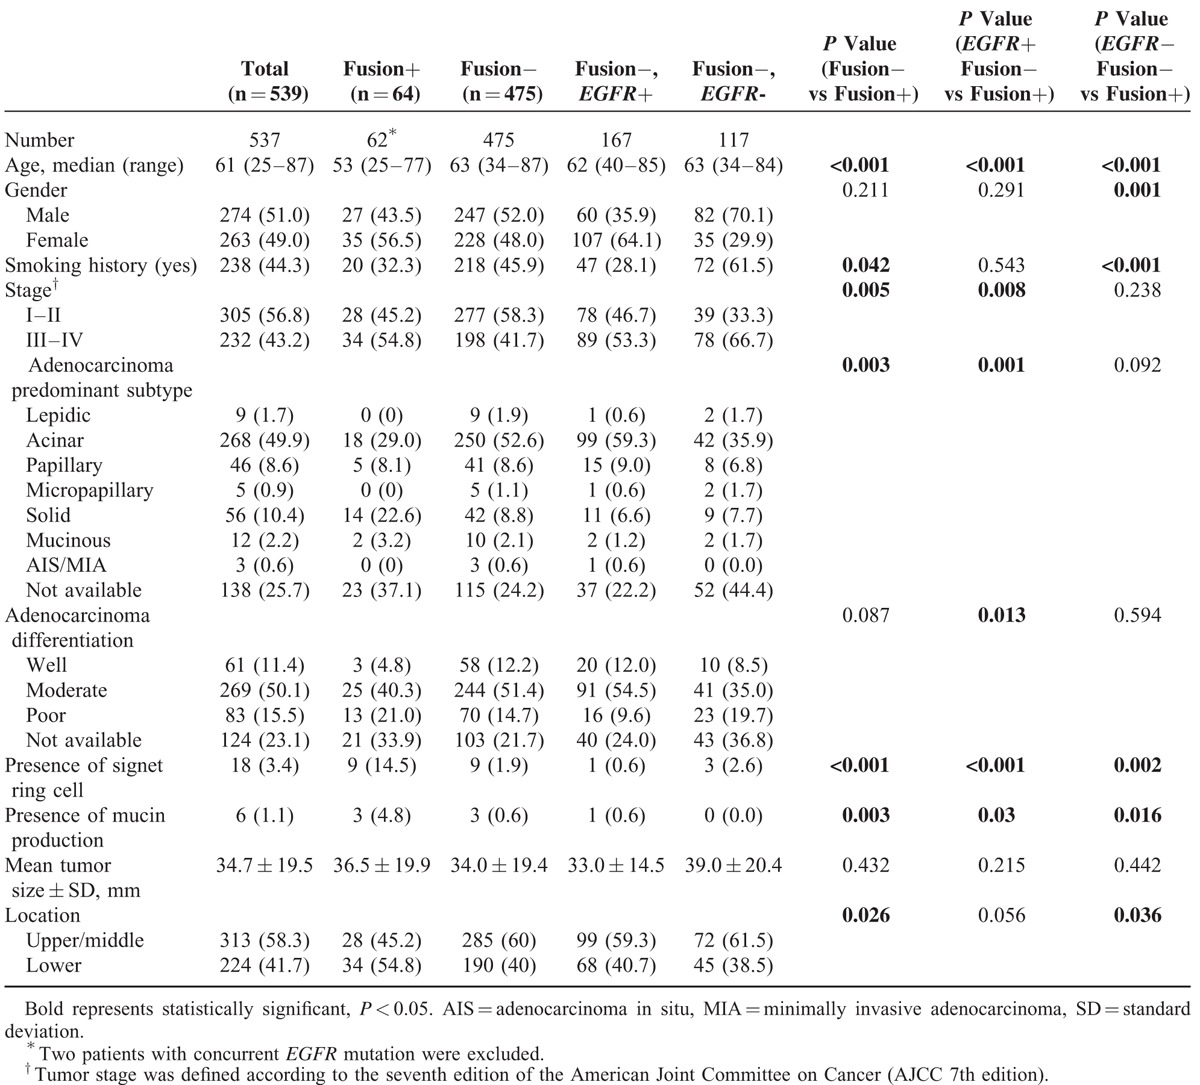
Pathologically, acinar predominant adenocarcinoma was the most frequent tumor subtype in both fusion-positive and -negative groups (29.0% and 52.6%, respectively). The predominant subtype was significantly different between the fusion-positive and -negative groups (P = 0.003). Compared with fusion-negative tumors, fusion-positive tumors were more likely to be advanced stage (P = 0.005). Signet ring cells were observed in 14.5% of fusion-positive tumors (9 of 64), whereas only 1.9% (9 or 475) of tumors in the fusion-negative group had observable signet ring cells; this resulted in a significant difference in signet ring cells between the fusion-positive and -negative groups (P < 0.00). Cells with mucin production were observed in 3 fusion-positive patients (4.8% of 64) and 3 fusion-negative patients (0.6% of 475), which was significantly different (P = 0.003).
Building the Fusion-Positive Prediction Model
Of the 61 total features evaluated, 16 features with a P value <0.1 were selected. Fourteen were qualitative and quantitative CT image features: solidity, central tumor location, SUVmax, kurtosis, CT numbers, or HU at the 97.5th percentile on histogram, homogeneity on 1-voxel distance, contrast and cluster shade on 1-, 2-, and 3-voxel distances, and inverse variance on 2- and 3-voxel distances. The other 2 features selected were patient age and tumor stage (Table 3). When we select more significant features from each of the 6 categories, consisting of the 4 image feature categories, clinical features, and SUVmax, 7 features were ultimately identified as having the strongest predictive ability for fusion-positive status. In this model, 5 features were qualitative and quantitative CT image features: solidity, SUVmax, mass, kurtosis, and inverse variance on 3-voxel distance. The remaining 2 selected features were patient age and tumor stage (Table 3). The sensitivity, specificity, and positive and negative predictive values of the tenfold cross-validation of noncategorical and categorical feature selection are shown in Table 4. The sensitivity and specificity of the fusion-positive prediction model were 0.73 and 0.70, respectively, for the noncategorical and categorical selection.
TABLE 3.
Selected Features for the Fusion-Positive Prediction Models
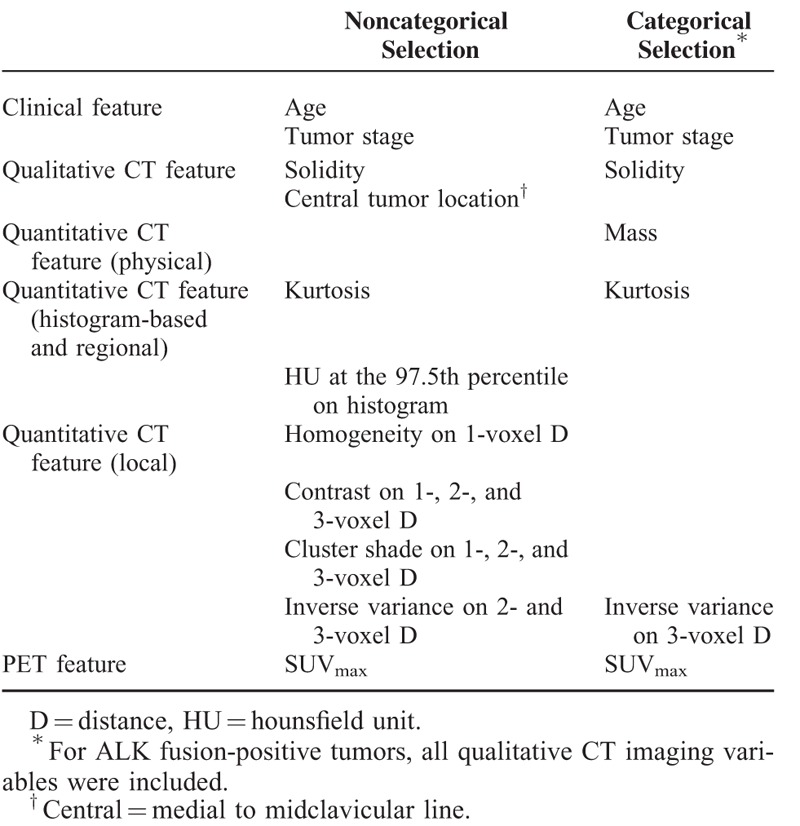
TABLE 4.
Sensitivity, Specificity, and Positive and Negative Predictive Values of Models
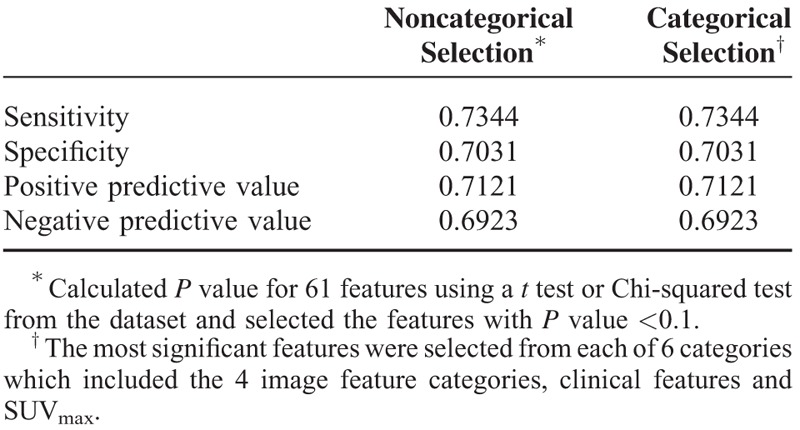
Overall, the tumors in the fusion-positive group tended to be solid, with a central location, and a higher value for SUVmax than those in the fusion-negative group. In addition, in the fusion-positive group, the values for kurtosis and inverse variance on 2- and 3-voxel distances were lower, whereas the mass, CT numbers or HU at the 97.5th percentile on histogram, homogeneity on 1-voxel distance, contrast and cluster shade on 1-, 2-, and 3-voxel distances were higher than in the fusion-negative group (see Table S1, http://links.lww.com/MD/A460).
Clinicoradiologic Comparison Task Between ALK vs ROS1/RET Fusion-Positive Tumors
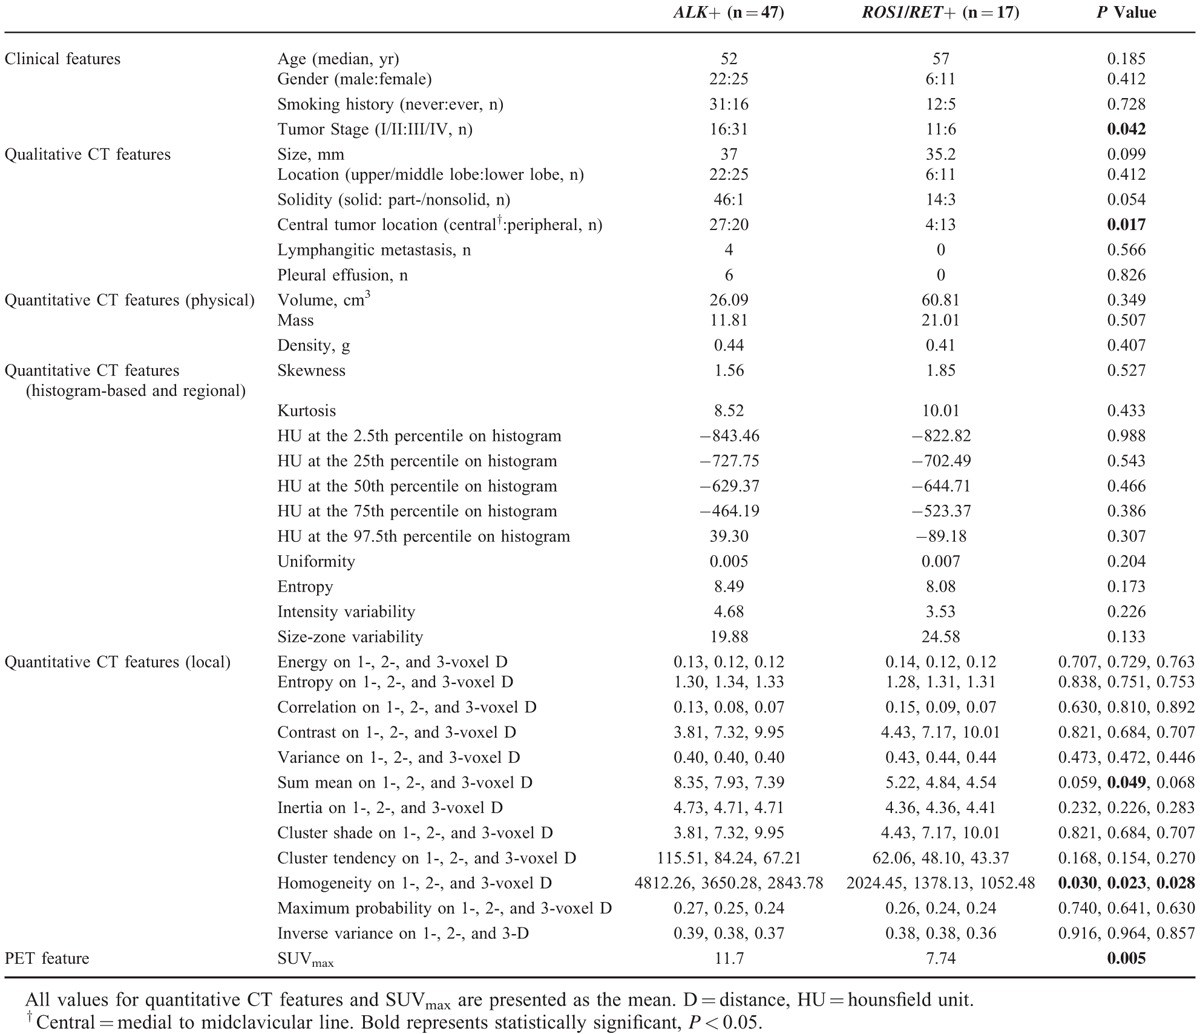
A comparison of the clinicoradiological characteristics between the patients with ALK and ROS1/RET fusions is provided in Table 5. Tumor stage, central location, SUVmax, homogeneity on 1-, 2-, and 3-voxel distances, and sum mean on 2-voxel distance were significantly different between the 2 groups (P = 0.042, 0.017, 0.005, 0.030, 0.023, 0.028, and 0.049, respectively).
TABLE 5.
Clinicoradiologic Comparison Task Between ALK vs ROS1/RET Fusion-Positive Tumors
Survival Analysis
See Appendix S5, http://links.lww.com/MD/A460
DISCUSSION
Profiling various predictive biomarkers for cancer cells may further improve clinical outcomes and reduce the toxicity levels of antineoplastic drugs.25 However, most histologic approaches only involve small biopsies or cytological specimens and are therefore limiting due to the heterogeneity and invasiveness of the tumor. Furthermore, fusion molecular testing is not currently cost effective.6 The linkage of genetic information and clinical and imaging data is crucial to understanding the interplay between all of the relevant parameters and necessary to establish effective patient stratification and reliable treatment strategies in limited tissue settings. In this study, we identified clinical and imaging predictors for ALK/ROS1/RET fusion-positive lung adenocarcinoma and found that a combination of imaging parameters and clinical features has the potential to improve the differentiation of fusion-positive tumors from fusion-negative lung adenocarcinomas.
It is now known that ALK and ROS1/RET fusion-positive lung adenocarcinomas represent up to 5% and 1% to 2% of all primary NSCLCs, respectively. Due to the relatively recent discovery and low prevalence of fusion-positive lung adenocarcinomas,8,11,12,26,27 little is known regarding the tumors’ imaging characteristics and their relationship to the fusion-positive molecular phenotype. A few studies regarding imaging-based identification of ALK fusion-positive tumors using CT or PET in lung adenocarcinoma have been reported to date18,19,28,29; however, these studies were relatively subjective studies in that they only included qualitative CT variables. Moreover, imaging-based identification of ROS1/RET fusion-positive tumors in NSCLC has yet to receive much attention.
Radiomics is an emerging field that converts imaging data into a high-dimensional mineable feature space using a great number of automatically extracted data-characterization algorithms.30,31 The present study found significant radiomics-based predictors for fusion-positive tumors. These parameters are mainly quantitative; add to prior established clinical and morphologic characteristics such as gender, age, history of smoking and solidity on CT scan.11,26,29,32,33 Solidity and central tumor location, which were validated in a prior study, were also selected as fusion-positive predictors.19,29 Our results suggest the possible value of a combination of clinical and imaging parameters for genetic status prediction beyond visual assessment. A key goal of imaging is “personalized medicine,” where treatment is increasingly tailored to the specific characteristics of each patient, and may be based on molecular characterization using genomic technologies.34 In addition, the increasing desire for personalized and optimized therapy requires an advanced diagnostic tool, such as radiomics as used in our study, to predict treatment response more accurately.
Several investigations had shown that ROS1/RET fusion-positive lung adenocarcinoma has clinicopathologic similarities to ALK fusion-positive lung cancers, including young age at onset, nonsmoking history, and pathological exhibition of a “mucinous cribriform pattern” and a “solid signet-ring cell pattern.”8,10–15 In addition, several recent studies have found structural similarities at the molecular level between ALK and ROS1, and ALK and RET, particular in the kinase domains.35–37 Consequently, lung adenocarcinoma patients harboring the ROS1 or RET fusions benefit from crizotinib, similar to patients harboring ALK fusion.3,7 Thus, the basic molecular structural similarity may influence clinicopathologic similarity and subsequent similarity in imaging. With these clinicopathologic and molecular similarities between ALK, ROS1, and RET fusion-positive lung cancers, we additionally assessed whether there are common clinical and imaging features between the ALK and ROS1/RET fusion-positive groups. We found that ALK, ROS1, and RET fusion-positive lung cancers shared most clinicoradiologic features. However, compared to the ALK fusion-positive group, the ROS1/RET fusion-positive group had a lower SUVmax, whereas the ALK fusion-positive group had a higher SUVmax. This result is remarkable considering the pathologic similarity between the 2 groups. Also, tumor stage, central location, homogeneity on 1-, 2-, and 3-voxel distances, and sum mean on 2-voxel distance were significantly different between the 2 groups. Further verification of this finding in larger cohorts is warranted.
Measuring textural heterogeneity on CT or PET has the advantage of being relatively easy to perform, and the degree of the textural heterogeneity has been shown to correlate with patient outcome in esophageal and colorectal cancers, as well as NSCLC.38–41 These methods assess how grainy or coarse a tumor appears on imaging. Furthermore, the use of relative texture analysis allows the effect of variations in acquisition parameters (between the feasibility and validation data-sets) on lung tumor texture to be minimized, therefore making this approach applicable across centers.
Despite the advantages of utilizing a large cohort for validation, this analysis has several limitations. First, the data are retrospective and limited to Eastern Asian populations; thus, the findings may not be applicable to other populations. Second, owing to the relatively small number of ROS1/RET fusion-positive cases, our results are limited in their ability to achieve generalized statistical power. However, we included a comparatively large number of cases, given very low frequency of ROS1/RET fusions. In any case, further studies with a larger sample of ROS1/RET fusion-positive cases are needed to ultimately unravel the clinical and imaging relevance of ROS1/RET rearrangement. We believe our result is meaningful in terms of building baseline research data for the next relevant study. Third, we could not perform external validation using an independent population. However, we believe our findings and the comprehensive CT imaging approach described herein are meaningful, because we conducted this study with a large number of patients and we attempted to perform tenfold cross-validation as a method of internal validation.
In conclusion, ALK/ROS1/RET fusion-positive lung adenocarcinomas possess certain clinical and imaging features, enabling good discrimination of fusion-positive from fusion-negative lung adenocarcinomas. ROS1/RET fusion-positive tumors share most clinicoradiologic features with ALK fusion-positive tumors. The combination of imaging parameters with clinical features may provide added diagnostic benefit in identifying fusion-positive lung adenocarcinomas by CT imaging. This approach can have a large impact as imaging is routinely used in clinical practice in all stages of diagnoses and treatment. The results of this study may help develop treatment strategies and define categories of gene tests for ALK, ROS1, and RET fusion-positive lung cancer.
ACKNOWLEDGMENTS
A guarantor of this study is HYL who takes responsibility for the content of the manuscript, including the data and analysis. HYL, HJY, IS, and JHC had full access to all of the data in the study and takes responsibility for the integrity of the data and the accuracy of the data analysis. J-HK, Y-LC, HK, GL, KSL, and JK contributed substantially to the study design, data analysis, and interpretation, and the writing of the manuscript.
Footnotes
Abbreviations: ALK = anaplastic lymphoma kinase, CT = computed tomography, EGFR = epidermal growth factor receptor, FDG = 18F-fluorodeoxyglucose, GGO = ground-glass opacity, GLCM = gray level co-occurrence matrix, HU = hounsfield unit, NSCLC = nonsmall cell lung cancer, OS = overall survival, PET = positron emission tomography, RET = rearranged during transfection, RFS = recurrence-free survival, ROIs = regions of interest, ROS1 = c-ros oncogene 1, SUV = standardized uptake value.
HJY, IS, and JHC have contributed equally to this work.
This study was supported by the Converging Research Center Program (No. 2013K000274) funded by the Korean Government (The Ministry of Science, Information and Communications Technology, and Future Planning), the R&D Program for Society of the National Research Foundation (NRF) funded by the Ministry of Science, ICT and Future Planning (NRF-2013M3C8A1078501), and a grant from the Korea Health Technology R&D Project through the Korea Health Industry Development Institute (KHIDI), funded by the Ministry of Health and Welfare, Republic of Korea (HI13C2096).
The authors have no funding and conflicts of interest to disclose.
Supplemental digital content is available for this article. Direct URL citations appear in the printed text and are provided in the HTML and PDF versions of this article on the journal's Website (www.md-journal.com).
REFERENCES
- 1.Soda M, Choi YL, Enomoto M, et al. Identification of the transforming EML4-ALK fusion gene in non-small-cell lung cancer. Nature 2007; 448:561–566. [DOI] [PubMed] [Google Scholar]
- 2.Kim H, Yoo SB, Choe JY, et al. Detection of ALK gene rearrangement in non-small cell lung cancer: a comparison of fluorescence in situ hybridization and chromogenic in situ hybridization with correlation of ALK protein expression. J Thorac Oncol 2011; 6:1359–1366. [DOI] [PubMed] [Google Scholar]
- 3.Kwak EL, Bang YJ, Camidge DR, et al. Anaplastic lymphoma kinase inhibition in non-small-cell lung cancer. N Engl J Med 2010; 363:1693–1703. [DOI] [PMC free article] [PubMed] [Google Scholar]
- 4.Lipson D, Capelletti M, Yelensky R, et al. Identification of new ALK and RET gene fusions from colorectal and lung cancer biopsies. Nat Med 2012; 18:382–384. [DOI] [PMC free article] [PubMed] [Google Scholar]
- 5.Shaw AT, Kim DW, Nakagawa K, et al. Crizotinib versus chemotherapy in advanced ALK-positive lung cancer. N Engl J Med 2013; 368:2385–2394. [DOI] [PubMed] [Google Scholar]
- 6.Djalalov S, Beca J, Hoch JS, et al. Cost effectiveness of EML4-ALK fusion testing and first-line crizotinib treatment for patients with advanced ALK-positive non-small-cell lung cancer. J Clin Oncol 2014; 32:1012–1019. [DOI] [PubMed] [Google Scholar]
- 7.Groschel A, Warth A, Reinmuth N. Crizotinib—molecular therapy for lung cancer. Pneumologie (Stuttgart, Germany) 2013; 67:205–208. [DOI] [PubMed] [Google Scholar]
- 8.Bergethon K, Shaw AT, Ou SH, et al. ROS1 rearrangements define a unique molecular class of lung cancers. J Clin Oncol 2012; 30:863–870. [DOI] [PMC free article] [PubMed] [Google Scholar]
- 9.Mazieres J, Zalcman G, Crino L, et al. Crizotinib therapy for advanced lung adenocarcinoma and a ROS1 rearrangement: results from the EUROS1 cohort. J Clin Oncol 2015; 33:992–999. [DOI] [PubMed] [Google Scholar]
- 10.Kim HR, Lim SM, Kim HJ, et al. The frequency and impact of ROS1 rearrangement on clinical outcomes in never smokers with lung adenocarcinoma. Ann Oncol 2013; 24:2364–2370. [DOI] [PubMed] [Google Scholar]
- 11.Pan Y, Zhang Y, Li Y, et al. ALK, ROS1 and RET fusions in 1139 lung adenocarcinomas: a comprehensive study of common and fusion pattern-specific clinicopathologic, histologic and cytologic features. Lung Cancer (Amsterdam, Netherlands) 2014; 84:121–126. [DOI] [PubMed] [Google Scholar]
- 12.Takeuchi K, Soda M, Togashi Y, et al. RET, ROS1 and ALK fusions in lung cancer. Nat Med 2012; 18:378–381. [DOI] [PubMed] [Google Scholar]
- 13.Tsuta K, Kohno T, Yoshida A, et al. RET-rearranged non-small-cell lung carcinoma: a clinicopathological and molecular analysis. Br J Cancer 2014; 110:1571–1578. [DOI] [PMC free article] [PubMed] [Google Scholar]
- 14.Wang R, Hu H, Pan Y, et al. RET fusions define a unique molecular and clinicopathologic subtype of non-small-cell lung cancer. J Clin Oncol 2012; 30:4352–4359. [DOI] [PubMed] [Google Scholar]
- 15.Yoo SS, Jin G, Jung HJ, et al. RET fusion genes in Korean non-small cell lung cancer. J Korean Med Sci 2013; 28:1555–1558. [DOI] [PMC free article] [PubMed] [Google Scholar]
- 16.Ha SY, Choi SJ, Cho JH, et al. Lung cancer in never-smoker Asian females is driven by oncogenic mutations, most often involving EGFR. Oncotarget 2015; 6:5465–5474. [DOI] [PMC free article] [PubMed] [Google Scholar]
- 17.Colen R, Foster I, Gatenby R, et al. NCI Workshop Report: clinical and computational requirements for correlating imaging phenotypes with genomics signatures. Transl Oncol 2014; 7:556–569. [DOI] [PMC free article] [PubMed] [Google Scholar]
- 18.Rizzo S, Petrella F, Buscarino V, et al. CT radiogenomic characterization of EGFR, K-RAS, and ALK mutations in non-small cell lung cancer. Eur Radiol 2015; 9: [Epub ahead of print], DOI 10.1007/s00330-015-3814-0. [DOI] [PubMed] [Google Scholar]
- 19.Yamamoto S, Korn RL, Oklu R, et al. ALK molecular phenotype in non-small cell lung cancer: CT radiogenomic characterization. Radiology 2014; 272:568–576. [DOI] [PubMed] [Google Scholar]
- 20.Lira ME, Choi YL, Lim SM, et al. A single-tube multiplexed assay for detecting ALK, ROS1, and RET fusions in lung cancer. J Mol Diagn 2014; 16:229–243. [DOI] [PubMed] [Google Scholar]
- 21.Travis WD, Brambilla E, Noguchi M, et al. International Association for the Study of Lung Cancer/American Thoracic Society/European Respiratory Society International Multidisciplinary Classification of Lung Adenocarcinoma. J Thorac Oncol 2011; 6:244–285. [DOI] [PMC free article] [PubMed] [Google Scholar]
- 22.Aerts HJ, Velazquez ER, Leijenaar RT, et al. Decoding tumour phenotype by noninvasive imaging using a quantitative radiomics approach. Nat Commun 2014; 5:4006. [DOI] [PMC free article] [PubMed] [Google Scholar]
- 23.Simon RM, Subramanian J, Li MC, et al. Using cross-validation to evaluate predictive accuracy of survival risk classifiers based on high-dimensional data. Brief Bioinform 2011; 12:203–214. [DOI] [PMC free article] [PubMed] [Google Scholar]
- 24.Pang H, Jung SH. Sample size considerations of prediction-validation methods in high-dimensional data for survival outcomes. Genet Epidemiol 2013; 37:276–282. [DOI] [PMC free article] [PubMed] [Google Scholar]
- 25.Vilmar AC, Sorensen JB. Customising chemotherapy in advanced nonsmall cell lung cancer: daily practice and perspectives. Eur Respir Rev 2011; 20:45–52. [DOI] [PMC free article] [PubMed] [Google Scholar]
- 26.Sun Y, Ren Y, Fang Z, et al. Lung adenocarcinoma from East Asian never-smokers is a disease largely defined by targetable oncogenic mutant kinases. J Clin Oncol 2010; 28:4616–4620. [DOI] [PMC free article] [PubMed] [Google Scholar]
- 27.Li C, Fang R, Sun Y, et al. Spectrum of oncogenic driver mutations in lung adenocarcinomas from East Asian never smokers. PLoS ONE 2011; 6:e28204. [DOI] [PMC free article] [PubMed] [Google Scholar]
- 28.Halpenny DF, Riely GJ, Hayes S, et al. Are there imaging characteristics associated with lung adenocarcinomas harboring ALK rearrangements? Lung Cancer 2014; 86:190–194. [DOI] [PMC free article] [PubMed] [Google Scholar]
- 29.Ko SJ, Lee YJ, Park JS, et al. Epidermal growth factor receptor mutations and anaplastic lymphoma kinase rearrangements in lung cancer with nodular ground-glass opacity. BMC Cancer 2014; 14:312. [DOI] [PMC free article] [PubMed] [Google Scholar]
- 30.Lambin P, Rios-Velazquez E, Leijenaar R, et al. Radiomics: extracting more information from medical images using advanced feature analysis. Eur J Cancer (Oxford, England: 1990) 2012; 48:441–446. [DOI] [PMC free article] [PubMed] [Google Scholar]
- 31.Kumar V, Gu Y, Basu S, et al. Radiomics: the process and the challenges. Magn Reson Imaging 2012; 30:1234–1248. [DOI] [PMC free article] [PubMed] [Google Scholar]
- 32.Yoshida A, Tsuta K, Nakamura H, et al. Comprehensive histologic analysis of ALK-rearranged lung carcinomas. Am J Surg Pathol 2011; 35:1226–1234. [DOI] [PubMed] [Google Scholar]
- 33.Choi H, Paeng JC, Kim DW, et al. Metabolic and metastatic characteristics of ALK-rearranged lung adenocarcinoma on FDG PET/CT. Lung Cancer (Amsterdam, Netherlands) 2013; 79:242–247. [DOI] [PubMed] [Google Scholar]
- 34.Lambin P, van Stiphout RG, Starmans MH, et al. Predicting outcomes in radiation oncology—multifactorial decision support systems. Nat Rev Clin Oncol 2013; 10:27–40. [DOI] [PMC free article] [PubMed] [Google Scholar]
- 35.Kodama T, Tsukaguchi T, Satoh Y, et al. Alectinib shows potent antitumor activity against RET-rearranged non-small cell lung cancer. Mol Cancer Ther 2014; 13:2910–2918. [DOI] [PubMed] [Google Scholar]
- 36.Huber KV, Salah E, Radic B, et al. Stereospecific targeting of MTH1 by (S)-crizotinib as an anticancer strategy. Nature 2014; 508:222–227. [DOI] [PMC free article] [PubMed] [Google Scholar]
- 37.Shaw AT, Ou SH, Bang YJ, et al. Crizotinib in ROS1-rearranged non-small-cell lung cancer. N Engl J Med 2014; 371:1963–1971. [DOI] [PMC free article] [PubMed] [Google Scholar]
- 38.Hatt M, Visvikis D, Albarghach NM, et al. Prognostic value of 18F-FDG PET image-based parameters in oesophageal cancer and impact of tumour delineation methodology. Eur J Nucl Med Mol Imaging 2011; 38:1191–1202. [DOI] [PubMed] [Google Scholar]
- 39.Miles KA, Ganeshan B, Griffiths MR, et al. Colorectal cancer: texture analysis of portal phase hepatic CT images as a potential marker of survival. Radiology 2009; 250:444–452. [DOI] [PubMed] [Google Scholar]
- 40.Ganeshan B, Skogen K, Pressney I, et al. Tumour heterogeneity in oesophageal cancer assessed by CT texture analysis: preliminary evidence of an association with tumour metabolism, stage, and survival. Clin Radiol 2012; 67:157–164. [DOI] [PubMed] [Google Scholar]
- 41.Win T, Miles KA, Janes SM, et al. Tumor heterogeneity and permeability as measured on the CT component of PET/CT predict survival in patients with non-small cell lung cancer. Clin Cancer Res 2013; 19:3591–3599. [DOI] [PubMed] [Google Scholar]


