

Supplemental Digital Content is available in the text
Abstract
Sodium intake was reported to be related to metabolic syndrome (MS). Although a strong association between sodium intake and blood pressure (BP) has been reported, the relationship between sodium intake and other components of MS is unknown.
An observational study of 18,146 adults in the Korea National Health and Nutrition Examination Survey IV-V databases (2008–2011) was performed. Estimates of 24-h sodium excretion were made from a single fasting urine sample.
A significant positive association was found between sodium excretion and systolic BP and between sodium excretion and diastolic BP in participants with and without hypertension after adjusting for multiple covariates (P < 0.001 for trend). The relationship between triglyceride or glucose levels and sodium excretion was linear (P < 0.005). In both men and women, a positive relationship between sodium excretion and waist circumference and an inverse relationship between sodium excretion and high-density lipoprotein were found (P ≤ 0.001). Body fat percentage, body fat mass, and insulin level were positively related to sodium excretion (P ≤ 0.001), and HOMA-IR was significantly associated with sodium excretion (P < 0.05). The risk of MS was elevated 1.279-fold in the second quartile of sodium excretion (95% CI, 1.088–1.504, P = 0.003), 1.479-fold in the third quartile (95% CI, 1.262–1.734; P < 0.001), and 1.929-fold in the highest quartile (95% CI 1.654–2.249, P < 0.001) compared with the lowest quartile.
Sodium intake is significantly associated with all components of MS, body fat, and insulin resistance. Therefore, a high-salt diet is a significant risk factor for MS.
INTRODUCTION
Metabolic syndrome (MS) is approaching epidemic proportions worldwide.1 The prevalence of MS in the United States was 22.9% from 2009 to 2010 with an increasing trend of abdominal obesity.2 MS represents a cluster of clinical factors and is used to define patients at increased risk of cardiovascular disease (CVD), type II diabetes, and all-cause mortality.2,3 MS is associated with a 2.4-fold increase in CVD and cardiovascular mortality.4 Sodium intake is a modifiable risk factor for MS.5–7 Previous studies have reported a strong association between blood pressure (BP) and sodium intake.8–10 However, there is controversy regarding the association between other components of MS besides BP and sodium intake. Rodrigues et al reported that the association between sodium intake and MS was due to the confounding effect of increased BP and was not significant in normotensive subjects.7 Sodium intake was reported to be positively associated with body mass index (BMI) and waist circumference, but not with dyslipidemia and fasting glucose levels.5 Baudrand et al showed that a high sodium intake was associated with dyslipidemia and insulin resistance.6 Therefore, larger studies are required to investigate the associations between sodium intake and components of MS. We assessed the associations between urinary sodium excretion: insulin resistance, body fat percentage, and each component of MS. In addition, we investigated the risks of MS according to the increase in urinary sodium excretion in participants chosen from a nationwide survey.
METHODS
Participants
The Korea National Health and Nutrition Examination Survey (KNHANES) is a nationwide representative survey of the health and nutritional status of the civilian Korean population. A health questionnaire survey, health examination, and nutrition survey were conducted periodically by the Korea Centers for Disease Control and Prevention beginning in 1998. The participants in this study were chosen from the candidates using proportional allocation-systematic sampling, with multistage stratification by age, sex, and region. The 7 metropolitan cities and 9 provinces sampled are shown as urban and rural areas, respectively. We analyzed data from the fourth (IV-2, 3, 2008–2009) and fifth (V-1, 2, 2010–2011) KNHANES.
Among the 37,753 participants who completed the health examination, 19,132 participants aged 20 years and older with urine sodium and urine creatinine data were included in this study. Of these, 986 participants with urine sodium concentration <10 mmol/L or >500 mmol/L or estimated glomerular filtration rate (eGFR) <60 mL/min/1.73 m2 were excluded, leaving a total of 18,146 participants. We divided the participants into sex-specific quartile groups according to sodium excretion values. Participants in KNHANES signed an informed consent form and the survey was approved by the institutional review board of Centers for Disease Control and Prevention in Korea (IRB No. 2010-02CON-21-C).
Measurements
Blood and urine samples, after an 8-h fast, were collected year-round and immediately processed, refrigerated, and transported in cold storage to the central laboratory (NeoDin Medical Institute, Seoul, South Korea) for analysis within 24 h. Routine biochemistry, including creatinine, urine sodium, high-density lipoprotein (HDL), triglyceride, and glucose levels, was performed using the Hitachi Automatic Analyzer 7600 (Hitachi, Tokyo, Japan). Serum and urine creatinine levels were measured by using the Jaffe kinetic method (IV-2,3, 2008–2009; Creatinine-HR 1-Type Wako, Wako, Osaka, Japan; V-1,2, 2010–2011; CREA, Roche Diagnostics, Indianapolis, IN). Urine sodium was determined using ion-selective electrodes (Sekisui Medical Co, Tokyo, Japan). Total cholesterol, HDL, triglyceride, and glucose levels were measured by an enzymatic method using Pureauto SCHO-N, Cholesteset N HDL, Pureauto S TG-N, and Pureauto S GLU, respectively (Sekisui Medical Co). Body fat percentage was determined by using dual-energy X-ray absorptiometry (QDR 4500A, Hologic Inc, Waltham, MA; maximum weight of a subject was 204 kg). Serum insulin was measured by using an immunoradiometric assay using INS-IRMA (BioSource, Nivelles, Belgium). The GFR was estimated by using the CKD-EPI equation.11 Insulin resistance assessment by the homeostatic assay (HOMA-IR) was calculated using the formula: HOMA-IR = [fasting glucose × fasting insulin/405].12 The 3 BP readings were obtained using a mercury sphygmomanometer, and the final BP value for individual participants was reported by calculating the mean of the second and third reading. Urine protein was measured by dipstick urinalysis, and the results were reported using a semiquantitative scale from negative to 4+.
Definitions
The Kawasaki formula was used to estimate 24-h urinary excretion of sodium from a single fasting urine sample and we apply these estimates as surrogates for sodium intake.13–15 Hypertension was defined as the presence of either systolic BP ≥140 mm Hg or diastolic BP ≥90 mm Hg, or following a course of antihypertensive medication at the time of interview. Diabetes mellitus was defined as participants who fulfilled at least 1 of the following 4 criteria: fasting blood glucose ≥126 mg/dL; following a course of medication to decrease blood glucose level at the time of interview; following a course of insulin administration at the time of interview; and self-report of having received a physician's diagnosis of diabetes. BMI was calculated on the basis of weight and height (kg/m2). MS was defined on the basis of National Cholesterol Education Program ATP III guidelines.16 Proteinuria was defined as dipstick urinalysis above 1+. Malignancy was defined as self-reported history of stomach, colon, liver, uterine cervix, breast, or other types of cancer. Myocardial infarction, angina, and stroke were also defined by self-reported history. Current smoking was defined as smoking on ≥1 day within the previous month. Alcohol consumption was defined as drinking ≥2 alcoholic beverages in a month within the previous year.
Statistical Analysis
All analyses were performed using SPSS software (SPSS version 20.0, SPSS Inc, Chicago, IL). Data are presented as the mean ± standard deviation for continuous variables and as a percentage for categorical variables. Differences were analyzed using the χ2 test for categorical variables and analysis of variance for continuous variables. We analyzed independent factors related to estimated sodium excretion by using multiple linear regression analysis. Analysis of covariance was used to adjust independent factors related to estimated sodium excretion. The risks and 95% confidence intervals (95% CIs) of factors associated with MS were calculated by using logistic regression analysis. A P value <0.05 was considered statistically significant.
RESULTS
Baseline Characteristics
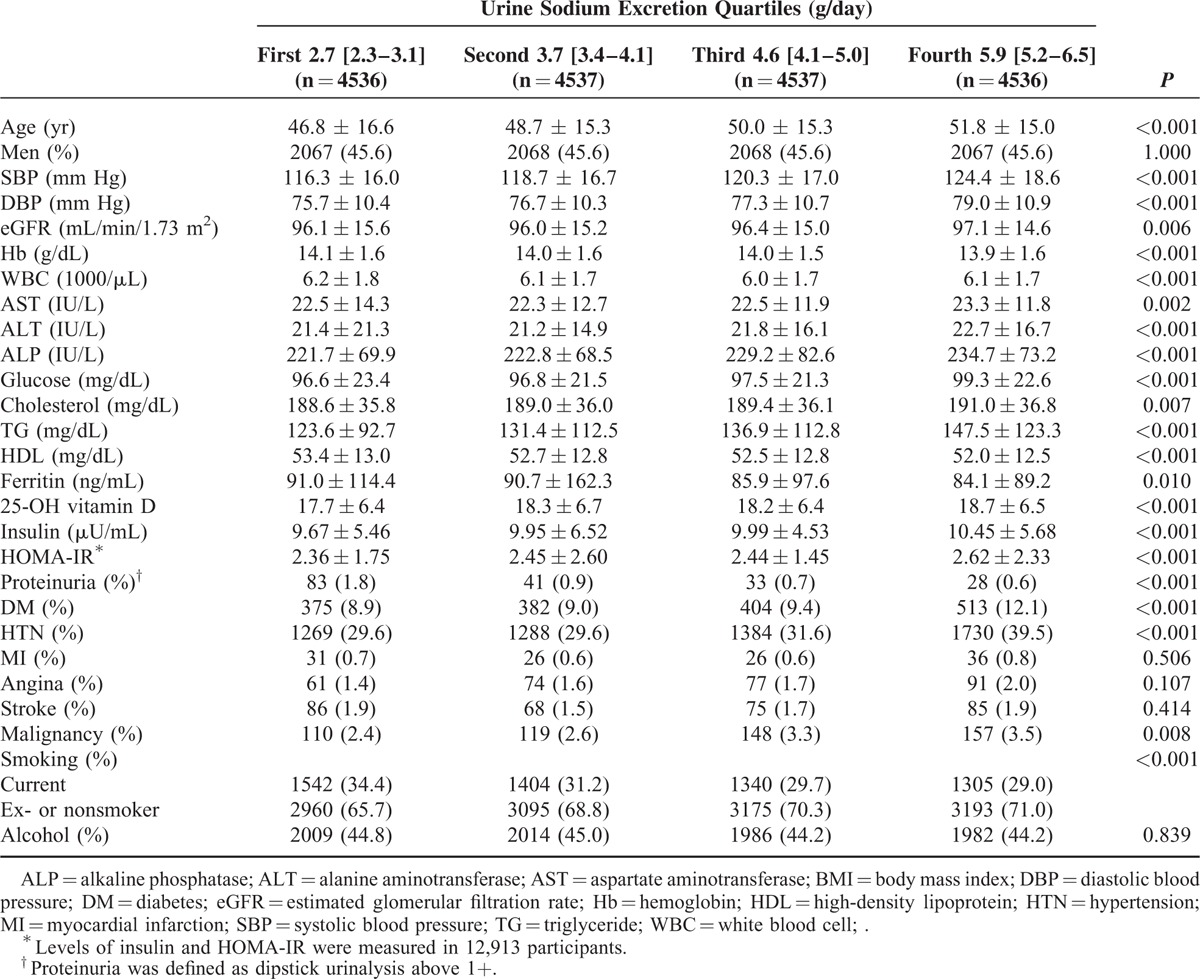
The mean age of the 18,146 Korean participants was 46.8 years, and 45.6% were men. The median urine sodium excretion of the total population was 4.1 [3.3–5.1] g/day. The median estimated urine sodium was 2.7[2.3–3.1] g/day in the lowest quartile, 3.7 [3.4–4.1] g/day in the second quartile, 4.6 [4.1–5.0] g/day in the third quartile, and 5.9[5.2–6.5] g/day in the highest quartile. The baseline characteristics of the study participants are shown in Table 1. The participants with higher excreted urine sodium values tended to be older and have increased systolic blood pressure (SBP), diastolic blood pressure (DBP), eGFR, aspartate aminotransferase (AST), alanine aminotransferase (ALT), alkaline phosphatase (ALP), glucose, cholesterol, triglyceride, 25-OH vitamin D, insulin, and HOMA-IR (P < 0.01). In addition, higher levels of sodium excretion were associated with a higher prevalence of diabetes, hypertension, and malignancy (P < 0.001). Lower values of urine sodium excretion were associated with higher levels of hemoglobin, white blood cells (WBCs), HDL, and ferritin (P ≤ 0.010) (Table 1).
TABLE 1.
Baseline Characteristics Among Urine Sodium Groups
Nutritional Status According to Estimated Sodium Excretion
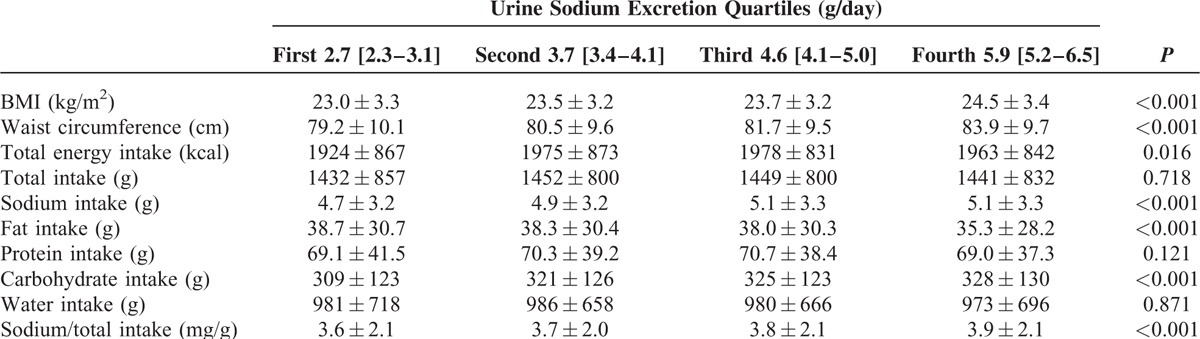
A significant linear relationship was observed between estimated sodium excretion and BMI and between estimated sodium excretion and waist circumference (P < 0.001 for trend). The highest urine sodium excretion was associated with the highest BMI and waist circumference values (P < 0.001). Lowest estimated sodium excretion had the lowest mean total energy intake excretion. Intake of sodium, the ratio of sodium and total intake, and carbohydrate intake were positively correlated with estimated sodium excretion (P < 0.001 for trend). However, a significant inverse relationship was observed between fat intake and urine sodium excretion (P < 0.001 for trend). Intake of protein and water was not associated with estimated sodium excretion (Table 2).
TABLE 2.
Nutritional Status Among Urine Sodium Groups
Adjusted Association Between Estimated Sodium Excretion and MS Components
We analyzed the associations between estimated urine sodium excretion and components of MS after adjusting for multiple covariates. A significant linear association was observed between estimated sodium excretion and SBP and between estimated sodium excretion and DBP (P < 0.001 for trend) (Figure 1A, B). In hypertensive participants, larger increases of SBP and DBP were observed with increasing urine sodium excretion. A 2.11-mm Hg estimated mean difference in SBP was observed between the lowest and highest quartiles in nonhypertensive participants, whereas an 8.2-mm Hg difference was observed in hypertensive participants. In DBP, the estimated mean difference between the lowest and highest quartiles was 1.08 mm Hg in nonhypertensive participants and 3.3 mm Hg in hypertensive participants.
FIGURE 1.
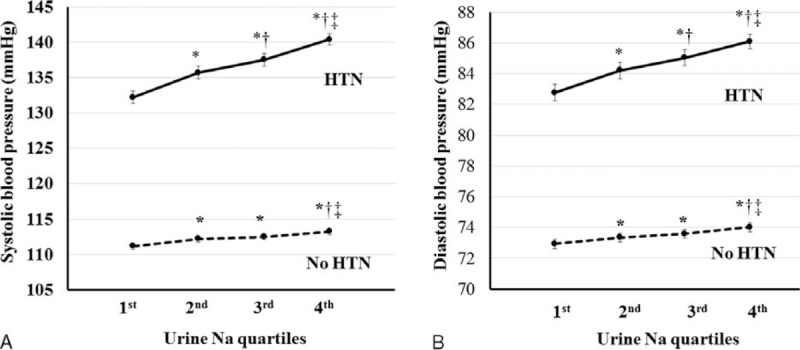
Relationship between blood pressures and sodium excretion. A, Mean SBP according to sodium excretion levels in participants with or without hypertension. B, Mean DBP according to sodium excretion levels in participants with or without hypertension. SBP, DBP, WC, and TG were adjusted for age, BMI, SBP, WC, calorie intake, hemoglobin, glucose, eGFR, white blood cell (WBC) count, alanine aminotransferase (AST), aspartate aminotransferase (ALT), alkaline phosphatase (ALP), total cholesterol, ferritin, TG, high-density lipoprotein (HDL), 25-OH vitamin D using covariance (ANCOVA) analysis.
The relationship between estimated sodium excretion and triglyceride was linear (P < 0.001 for trend) (Figure 2A). Triglyceride levels were significantly higher in the highest quartile than in the lowest and second quartiles (P < 0.001). A positive relationship between estimated sodium excretion and waist circumference was found in both men and women (P ≤ 0.001 for trend) (Figure 2B). Waist circumference was significantly higher in the third and highest quartiles than in the lowest quartile (P < 0.001). An inverse relationship was found between estimated sodium excretion and HDL in both men and women (P ≤ 0.001 for trend) (Figure 2C). HDL was significantly lower in the highest quartile of estimated sodium excretion than in the lowest quartile in both men and women (P < 0.001). The relationship between estimated urine sodium and glucose was significantly linear (P = 0.004 for trend) (Figure 2D). Glucose levels were significantly higher in the highest quartile than in the lowest and second quartiles (P < 0.05).
FIGURE 2.
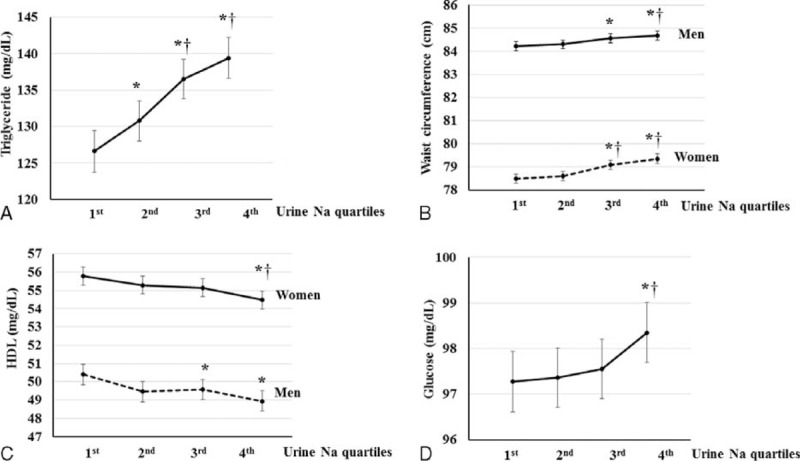
Relationship between metabolic syndrome (MS) components and sodium excretion. A, Mean triglyceride (TG) levels according to sodium excretion. B, Mean waist circumference (WC) according to sodium excretion levels in men and women. SBP, DBP, WC, and TG were adjusted for age, BMI, SBP, WC, calorie intake, hemoglobin, glucose, eGFR, white blood cell (WBC) count, alanine aminotransferase (AST), aspartate aminotransferase (ALT), alkaline phosphatase (ALP), total cholesterol, ferritin, TG, high-density lipoprotein (HDL), 25-OH vitamin D using covariance (ANCOVA) analysis. C, Mean HDL according to sodium excretion in each sex. The HDL was adjusted for age, SBP, calorie intake, hemoglobin, glucose, eGFR, WBC, AST, ALT, ALP, serum total cholesterol, ferritin, and 25-OH vitamin D using ANCOVA analysis. D, Mean glucose level according to sodium excretion. Glucose level was adjusted for age, calorie intake, hemoglobin, eGFR, WBC, AST, ALT, serum total cholesterol, ferritin, and 25-OH vitamin D using ANCOVA analysis. Error bars show the 95% CI. ∗P < 0.05, vs. first quartile, †P < 0.05, vs. second quartile, ‡P < 0.05, vs. third quartile.
Adjusted Association Between Estimated Sodium Excretion and Body Fat and Insulin Resistance
After adjusting for multiple factors, a significant positive association was found between estimated sodium excretion and body fat percentage (P < 0.001 for trend). Similarly, body fat mass was positively related to sodium excretion (P < 0.001 for trend). Body fat percentage in the third quartile and body fat mass in the second and third quartiles were significantly higher compared with the lowest quartile (P < 0.05). In addition, body fat percentage and body fat mass were significantly higher in the highest quartile than in all other estimated sodium excretion groups (P ≤ 0.012) (Figure 3A, B).
FIGURE 3.
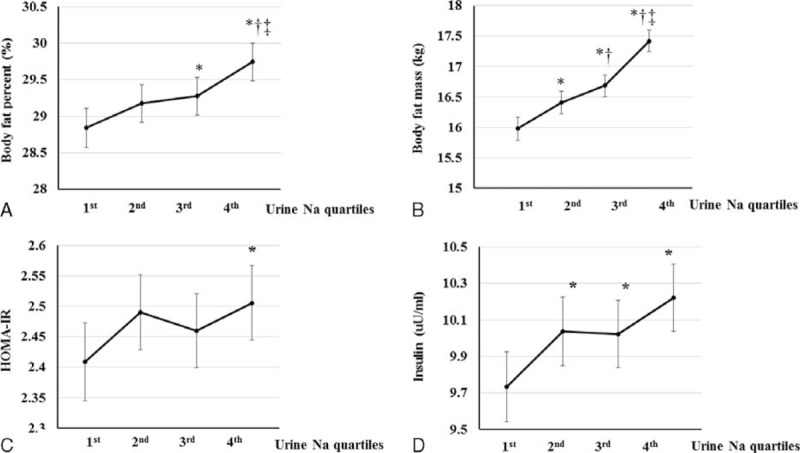
Relationship between sodium excretion and both body fat and insulin resistance. A, Mean body fat percentage according to sodium excretion. B, Mean body fat mass according to sodium excretion. Body fat percentage was adjusted for age, systolic blood pressure (SBP), calorie intake, glucose, white blood cell (WBC) count, alanine aminotransferase (AST), aspartate aminotransferase (ALT), alkaline phosphatase (ALP), total cholesterol, ferritin, triglyceride, high-density lipoprotein (HDL), and 25-OH vitamin D using covariance (ANCOVA) analysis. C, Mean HOMA-IR index according to sodium excretion. D, Mean insulin level according to sodium excretion. HOMA-IR and insulin were adjusted for age, SBP, calorie intake, hemoglobin, glucose, estimated glomerular filtration rate, WBC, AST, ALT, ALP, total cholesterol, ferritin, triglyceride, HDL, and 25-OH vitamin D using ANCOVA analysis. Error bars show the 95% CI. ∗P < 0.05, vs. first quartile, †P < 0.05, vs. second quartile, ‡P < 0.05, vs. third quartile.
HOMA-IR was significantly associated with estimated sodium excretion after adjusting for covariates. HOMA-IR was significantly higher in the highest quartile than in the lowest quartile (P < 0.05) (Figure 3C). In addition, the concentration of insulin was positively related to the estimated urine excretion (P = 0.001 for trend). Insulin levels were significantly lower in the lowest quartile than in the second, third, and the highest quartiles (P < 0.05) (Figure 3D).
Number of MS Components According to Estimated Sodium Excretion
The number of MS components increased with increasing estimated sodium excretion. In women, the mean number of MS components was 0.9 ± 1.1, 1.1 ± 1.2, 1.2 ± 1.2, and 1.5 ± 1.3 in the lowest, second, third, and highest quartiles, respectively (Figure 4A). The number of MS components was the highest in the highest quartile of estimated sodium excretion and lowest in the lowest quartile (P < 0.001). In men, the mean number of MS components was 1.1 ± 1.0, 1.1 ± 1.0, 1.2 ± 1.0, and 1.3 ± 1.1 in the lowest, second, third, and highest quartiles, respectively (Figure 4B). The number of MS components was significantly higher in the third and highest than in the lowest and second quartiles (P ≤ 0.005).
FIGURE 4.
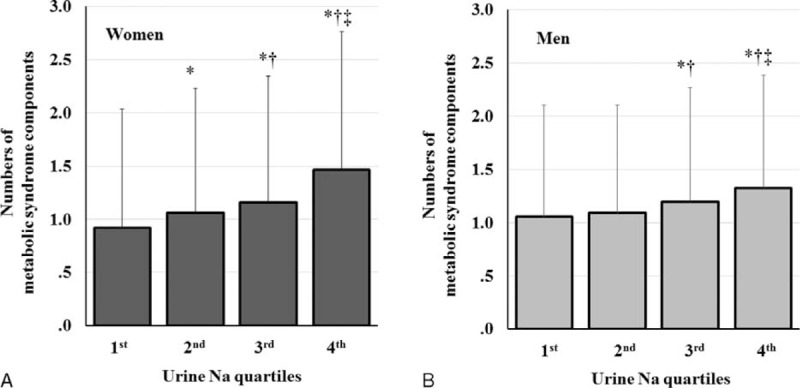
Number of MS components according to sodium excretion. A, Number of MS components according to sodium excretion in women. B, Number of MS components according to sodium excretion in men. Error bars show the standard deviation of the mean. ∗P < 0.05, vs. first quartile, †P < 0.05, vs. second quartile, ‡P < 0.05, vs. third quartile.
Adjusted Risk of MS According to Estimated Sodium Excretion
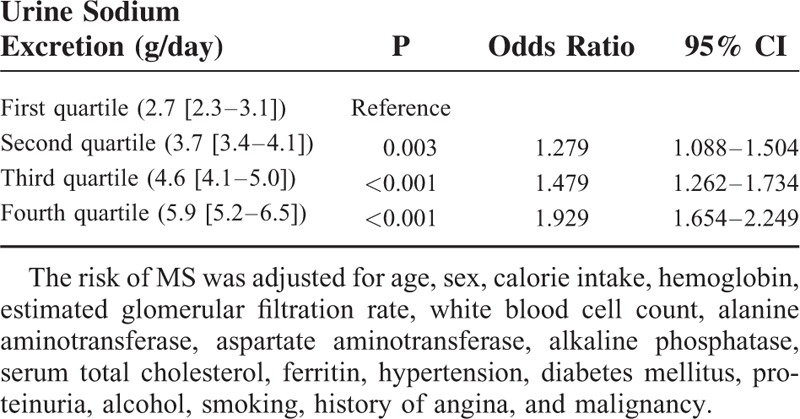
The risk of MS was assessed according to estimated sodium excretion adjusted for multiple variables. The second quartile had a 1.279-fold elevated risk of MS (95% CI, 1.088–1.504; P = 0.003) and the third quartile showed a 1.479-fold risk compared with the lowest quartile (95% CI, 1.262–1.734; P < 0.001). Furthermore, the highest quartile showed the highest risk of MS (1.929; 95% CI 1.654–2.249; P < 0.001). In addition, MS was adjusted for age, sex, cholesterol, hemoglobin, WBC, ferritin, eGFR, ALT, ALP, 25-OH vitamin D, proteinuria, hypertension, diabetes, and smoking (Table 3).
TABLE 3.
Adjusted Risk of MS According to Sodium Excretion
DISCUSSION
We found a positive association between sodium excretion and all components of MS such as BP, waist circumference, triglyceride, and fasting glucose and an inverse association between sodium excretion and HDL. In addition, a significant association was found between sodium excretion and both insulin resistance and body fat percentage. The risk of MS increased along with increases in sodium excretion.
Libuda et al reported on the association between sodium intake and obesity in children and adolescents.17 This result is supported by the finding that salt intake is positively associated with the consumption of sugar-sweetened soft drinks.18 The intake of salt stimulates thirst and appetite, subsequently increasing energy intake.18,19 In this study, we found that total energy intake was significantly lower in participants with the lowest levels of sodium excretion. However, the relationship between MS and sodium excretion was significant after the adjustment of total energy intake. This finding is consistent with that of a previous study,17 suggesting that other explanations may exist. A cross-sectional study showed that sodium intake was independently associated with body fat percentage, body fat mass, abdominal adipose tissue, and leptin in adolescents.20 A recent study found that a high-salt diet was associated with insulin resistance and lower adiponectin and HDL.6 A longitudinal study found that body fat increased significantly along with increases in sodium excretion after an adjustment for confounders.21 In rats, a high-salt diet increased fat mass, adipocyte size, and leptin levels, although there was no significant change in body weight.22 In addition, a high-salt diet increased lipogenic enzymatic activity and the capacity to incorporate glucose into lipids.22 Salt restriction causes improvements in insulin signaling and adipose tissue inflammation in a rat model of MS.23 In this study, we demonstrated a significant association between sodium excretion and both body fat percentage and insulin resistance. A high-salt diet may be associated with fat metabolism and insulin resistance as well as body weight gain by increased energy intake.
In another study, normotensive participants showed no differences in sodium excretion according to the presence of MS, and the authors suggested that the positive association between MS and sodium excretion was due to the confounding effects of BP.7 However, we found a strong positive association between MS components and sodium excretion in participants without hypertension (n = 11,731; P < 0.001; data not shown).
In our study, the positive association was shown between sodium excretion and 25-OH vitamin D although sodium excretion was closely related to insulin resistance in our study.
Many studies reported about the inverse relationship between 25-OH vitamin D and insulin resistance.24,25 Dietary intake of vitamin D could be a confounding factor, and the relationships between 25-OH vitamin D and sodium excretion were not significant, except the bottom decile group of energy intake in subgroup analysis (data are not shown). In addition, sodium excretion was significantly associated with age in our study. Sodium excretion was significantly increased in participants with age 40–59 years, compared with age 20–29 years (P < 0.05), and reduced in participants with age ≥70 years, compared with age 50–59 years (P < 0.05) (supplement Figure 1, http://links.lww.com/MD/A436). Aging is related to many physiologic changes in the oral cavity. The epithelium in oral cavity becomes thinner and the salivary glands become atrophic and replaced by adipose and fibrous connective tissue. The taste buds’ density diminishes.26,27 The average age of perceived taste disturbances was 42.6 years for men and 49.4 years for women.28 Increased salt intake in old age may be due to reduced salt taste. However, in the very old age, total calorie intake is significantly decreased (P < 0.01, data are not shown) and sodium excretion was reduced in participants with age ≥70 years.
A strength of this study is that we used a large sample size and nationwide data representative of the general population. We excluded participants with decreased eGFR because of the potential for impaired sodium excretion. In addition, we divided participants into sex-specific quartiles according to sodium excretion levels, and thus excluded the confounding effect of sex differences. Second, we used an identical method to measure urine sodium, creatinine, and components of MS. Third, to the best of our knowledge, this is the first study to investigate the association between MS and sodium excretion using spot urine sodium and creatinine. A spot urine test is more convenient than a 24-h urine test in the clinical setting, and an actual 24-h urinary excretion measurement is impractical within a large-scale study. However, diurnal variation in sodium excretion levels can hinder the accurate estimation of 24-h urinary sodium excretion using spot urine specimens. A validation study of the Kawasaki formula involving 1083 individuals from 11 countries was done using spot urine specimens.15 Sodium excretion values estimated using the Kawasaki formula correlated well with 24-h urinary sodium excretion values (intraclass correlation coefficient of 0.71), although there was a 10% overestimation of the 24-h sodium excretion.8,15 In addition, the Kawasaki formula was more reliable than other methods for estimating 24-h sodium excretion.8,15
Our study has potential limitations. First, because our study was cross-sectional, causality cannot be proven. Second, the study population comprises only Koreans, and race differences were not assessed in this study. Third, we could not adjust the data using medication history, and medications such as diuretics and inhibitors of the renin–angiotensin system can affect sodium excretion. However, we found similar results when excluding participants with a history of hypertension.
In conclusion, high salt intake is significantly associated with all components of MS, insulin resistance, and body fat, and it is an independent risk factor for MS. Further studies are required to assess the mechanisms involved in the association between sodium excretion and both MS and body fat and the long-term outcome about risk of MS according to sodium intake.
Acknowledgments
SWO and HJC designed the study and discussed the results. SWO analyzed and interpreted the data, and drafted the paper. KHH, S-YH, HSK, and S K reviewed the manuscript.
Footnotes
Abbreviations: ALP = alkaline phosphatase, ALT = alanine aminotransferase, ANCOVA = covariance, AST = aspartate aminotransferase, BMI = body mass index, BP = blood pressure, CI = confidence interval, CVD = cardiovascular disease, DBP = diastolic blood pressure, eGFR = estimated glomerular filtration rate, HDL = high-density lipoprotein, HOMA-IR = homeostatic assay, KNHANES = Korea National Health and Nutrition Examination Survey, MS = metabolic syndrome, SBP = systolic blood pressure, TG = triglyceride, WBCs = white blood cells.
This research received no grant from any funding agency in the public or commercial sectors.
The authors have no conflicts of interest to disclose.
Supplemental digital content is available for this article. Direct URL citations appear in the printed text and are provided in the HTML and PDF versions of this article on the journal's Website (www.md-journal.com).
REFERENCES
- 1.Mozaffarian D, Benjamin EJ, Go AS, et al. American Heart Association Statistics Committee and Stroke Statistics Subcommittee. Heart disease and stroke statistics-2015 update: a report from the American heart association. Circulation 2015; 131:e29–e322. [DOI] [PubMed] [Google Scholar]
- 2.Beltrán-Sánchez H, Harhay MO, Harhay MM, et al. Prevalence and trends of metabolic syndrome in the adult U.S. population, 1999-2010. J Am Coll Cardiol 2013; 62:697–703. [DOI] [PMC free article] [PubMed] [Google Scholar]
- 3.Ford ES. The metabolic syndrome and mortality from cardiovascular disease and all-causes: findings from the National Health and Nutrition Examination Survey II Mortality Study. Atherosclerosis 2004; 173:309–314. [DOI] [PubMed] [Google Scholar]
- 4.Mottillo S, Filion KB, Genest J, et al. The metabolic syndrome and cardiovascular risk a systematic review and meta-analysis. J Am Coll Cardiol 2010; 56:1113–1132. [DOI] [PubMed] [Google Scholar]
- 5.Hoffmann IS, Cubeddu LX. Salt and the metabolic syndrome. Nutr Metab Cardiovasc Dis 2009; 19:123–128. [DOI] [PubMed] [Google Scholar]
- 6.Baudrand R, Campino C, Carvajal CA, et al. High sodium intake is associated with increased glucocorticoid production, insulin resistance and metabolic syndrome. Clin Endocrinol (Oxf) 2014; 80:677–684. [DOI] [PubMed] [Google Scholar]
- 7.Rodrigues SL, Baldo MP, de Sá Cunha R, et al. Salt excretion in normotensive individuals with metabolic syndrome: a population-based study. Hypertens Res 2009; 32:906–910. [DOI] [PubMed] [Google Scholar]
- 8.Mente A, O’Donnell MJ, Rangarajan S, et al. PURE Investigators. Association of urinary sodium and potassium excretion with blood pressure. N Engl J Med 2014; 371:601–611. [DOI] [PubMed] [Google Scholar]
- 9.Weinberger MH. Sodium, potassium, and blood pressure. Am J Hypertens 1997; 10 ((5 Pt 2)):46S–48S. [PubMed] [Google Scholar]
- 10.He FJ, Li J, Macgregor GA. Effect of longer term modest salt reduction on blood pressure: Cochrane systematic review and meta-analysis of randomised trials. BMJ 2013; 346:f1325. [DOI] [PubMed] [Google Scholar]
- 11.Matsushita K, Mahmoodi BK, Woodward M, et al. Chronic Kidney Disease Prognosis Consortium. Comparison of risk prediction using the CKD-EPI equation and the MDRD study equation for estimated glomerular filtration rate. JAMA 2012; 307:1941–1951. [DOI] [PMC free article] [PubMed] [Google Scholar]
- 12.Matthews DR, Hosker JP, Rudenski AS, et al. Homeostasis model assessment: insulin resistance and beta-cell function from fasting plasma glucose and insulin concentrations in man. Diabetologia 1985; 28:412–419. [DOI] [PubMed] [Google Scholar]
- 13.Kawasaki T, Itoh K, Uezono K, et al. A simple method for estimating 24 h urinary sodium and potassium excretion from second morning voiding urine specimen in adults. Clin Exp Pharmacol Physiol 1993; 20:7–14.[Erratum, Clin Exp Pharmacol Physiol 1993;20:199.]. [DOI] [PubMed] [Google Scholar]
- 14.Kawamura M, Kusano Y, Takahashi T, et al. Effectiveness of a spot urine method in evaluating daily salt intake in hypertensive patients taking oral antihypertensive drugs. Hypertens Res 2006; 29:397–402. [DOI] [PubMed] [Google Scholar]
- 15.Mente A, O’Donnell MJ, Dagenais G, et al. Validation and comparison of three formulae to estimate sodium and potassium excretion from a single morning fasting urine compared to 24-h measures in 11 countries. J Hypertens 2014; 32:1005–1015. [DOI] [PubMed] [Google Scholar]
- 16.Grundy SM, Cleeman JI, Daniels SR, et al. American Heart Association; National Heart, Lung, and Blood Institute. Diagnosis and management of the metabolic syndrome: an American Heart Association/National Heart, Lung, and Blood Institute Scientific Statement. Circulation 2005; 112:2735–2752. [DOI] [PubMed] [Google Scholar]
- 17.Libuda L, Kersting M, Alexy U. Consumption of dietary salt measured by urinary sodium excretion and its association with body weight status in healthy children and adolescents. Public Health Nutr 2012; 15:433–441. [DOI] [PubMed] [Google Scholar]
- 18.He FJ, Marrero NM, MacGregor GA. Salt intake is related to soft drink consumption in children and adolescents: a link to obesity? Hypertension 2008; 51:629–634. [DOI] [PubMed] [Google Scholar]
- 19.Karppanen H, Mervaala E. Sodium intake and hypertension. Prog Cardiovasc Dis 2006; 49:59–75. [DOI] [PubMed] [Google Scholar]
- 20.Zhu H, Pollock NK, Kotak I, et al. Dietary sodium, adiposity, and inflammation in healthy adolescents. Pediatrics 2014; 133:e635–e642. [DOI] [PMC free article] [PubMed] [Google Scholar]
- 21.Larsen SC, Ängquist L, Sørensen TI, et al. 24 h urinary sodium excretion and subsequent change in weight, waist circumference and body composition. PLoS One 2013; 8:e69689. [DOI] [PMC free article] [PubMed] [Google Scholar]
- 22.Fonseca-Alaniz MH, Brito LC, Borges-Silva CN, et al. High dietary sodium intake increases white adipose tissue mass and plasma leptin in rats. Obesity (Silver Spring) 2007; 15:2200–2208. [DOI] [PubMed] [Google Scholar]
- 23.Hattori T, Murase T, Takatsu M, et al. Dietary salt restriction improves cardiac and adipose tissue pathology independently of obesity in a rat model of metabolic syndrome. J Am Heart Assoc 2014; 3:e001312. [DOI] [PMC free article] [PubMed] [Google Scholar]
- 24.Alvarez JA, Ashraf A. Role of vitamin D in insulin secretion and insulin sensitivity for glucose homeostasis. Int J Endocrinol 2010; 2010:351385. [DOI] [PMC free article] [PubMed] [Google Scholar]
- 25.Grimnes G, Figenschau Y, Almås B, et al. Vitamin D, insulin secretion, sensitivity, and lipids: results from a case-control study and a randomized controlled trial using hyperglycemic clamp technique. Diabetes 2011; 60:2748–2757. [DOI] [PMC free article] [PubMed] [Google Scholar]
- 26.Imoscopi A, Inelmen EM, Sergi G, et al. Taste loss in the elderly: epidemiology, causes and consequences. Aging Clin Exp Res 2012; 24:570–579. [DOI] [PubMed] [Google Scholar]
- 27.Nordin S, Brämerson A, Bringlöv E, et al. Substance and tongue-region specific loss in basic taste-quality identification in elderly adults. Eur Arch Otorhinolaryngol 2007; 264:285–289. [DOI] [PubMed] [Google Scholar]
- 28.Bergdahl M, Bergdahl J. Perceived taste disturbance in adults: prevalence and association with oral and psychological factors and medication. Clin Oral Investig 2002; 6:145–149. [DOI] [PubMed] [Google Scholar]