Abstract
Interstitial fibrosis and tubular atrophy (IF/TA) is a common cause of kidney allograft loss. Several noninvasive techniques developed to assess tissue fibrosis are widely used to examine the liver. However, relatively few studies have investigated the use of elastographic methods to assess transplanted kidneys. The aim of this study was to explore the clinical implications of the acoustic radiation force impulse (ARFI) technique in renal transplant patients.
A total of 91 patients who underwent living donor renal transplantation between September 2010 and January 2013 were included in this prospective study. Shear wave velocity (SWV) was measured by ARFI at baseline and predetermined time points (1 week and 6 and 12 months after transplantation). Protocol biopsies were performed at 12 months.
Instead of reflecting IF/TA, SWVs were found to be related to time elapsed after transplantation. Mean SWV increased continuously during the first postoperative year (P < 0.001). In addition, mixed model analysis showed no correlation existed between SWV and serum creatinine (r = −0.2426, P = 0.0771). There was also no evidence of a relationship between IF/TA and serum creatinine (odds ratio [OR] = 1.220, P = 0.7648). Furthermore, SWV temporal patterns were dependent on the kidney weight to body weight ratio (KW/BW). In patients with a KW/BW <3.5 g/kg, mean SWV continuously increased for 12 months, whereas it decreased after 6 months in those with a KW/BW ≥3.5 g/kg.
No significant correlation was observed between SWV and IF/TA or renal dysfunction. However, SWV was found to be related to the time after transplantation. Renal hemodynamics influenced by KW/BW might impact SWV values.
INTRODUCTION
Interstitial fibrosis and tubular atrophy (IF/TA) is the major cause of kidney allograft loss. It arises from multiple causes including ischemia-reperfusion injury, delayed graft function, acute rejection, and nephrotoxicity due to multiple agents. IF/TA is an early event that begins soon after transplantation, and it is even observed in patients with good allograft function. Early IF/TA detection is important for effective management of progressive injury in the transplanted kidney by minimizing risk factors associated with graft injury.1–3 At present, renal biopsy is still considered the “gold standard” for assessing allograft dysfunction, but it is an invasive procedure with tangible risks.4 In addition, early detection before deterioration is difficult because the decision to perform a biopsy is usually based on renal function. For these reasons, efforts are being made to find alternative and earlier means of detecting IF/TA.5 Noninvasive methods have been developed in recent years to avoid the need to biopsy.
Among ultrasound-based elastographic methods, the acoustic radiation force impulse (ARFI) technique provides a noninvasive and safe way to quantify tissue elasticity. ARFI relies on an acoustic push pulse that radiates from a probe and converges at a small region of interest (ROI). Minute tissue deformations elicited by the push pulse generate a shear wave, which propagates within adjacent tissues at speeds dependent on their stiffness. Stiffer adjacent tissue results in faster shear wave velocity (SWV). The time between push pulse generation and shear wave detection is less than 1 s.6,7
ARFI measurement is a reliable method for assessing fibrosis in chronic liver disease.8–10 Several studies have evaluated the ability of SWV to assess interstitial fibrosis in transplanted kidneys. However, ARFI application for kidneys remains controversial.11–15 Furthermore, it is difficult to survey the effectiveness of ARFI in transplanted kidneys because of small sample sizes and subject heterogeneity.
We performed a prospective, longitudinal study to evaluate the clinical implications of ARFI in renal transplantation patients. Specifically, we assessed serial SWV changes and compared the results with those of protocol biopsies.
METHODS
Study Design and Patients
Patients who underwent single renal transplantation at Severance Hospital between September 2010 and January 2013 were included in this prospective study. Baseline ARFI measurements were performed on living donors within a week before transplantation. Post-transplant SWV values were measured at predetermined time points (1 week and 6 and 12 months after transplantation). Protocol allograft biopsies were performed at 12 months in 73 patients. Exclusion criteria were allograft from a deceased donor, pediatric transplantation, and multiorgan transplantation. All patients were prospectively enrolled after providing written informed consent. The study was approved by the Institutional Review Board of Severance Hospital, Yonsei University Health System (1-2010-0011).
ARFI Elastography
SWV values were measured using an Acuson S2000 ultrasound system (Siemens Medical Solutions, Mountain View, CA) equipped with the ARFI function. A rectangular ROI (box with fixed dimensions of 1 cm length and 0.6 cm width) was set adjacent to the lower pole of the transplanted kidney cortex. Investigators performed ARFI measurement using a 4-MHz convex probe. Three experienced radiologists were randomly assigned, and SWV values (m/s) were measured five times per patient and averaged. We measured systolic blood pressure (SBP) and serum creatinine on the same day as the ARFI evaluation.
Allograft Biopsies
After taking SWV measurements at 12 months, ultrasound-guided renal biopsies were collected from the lower pole of the allograft cortex. Sections were examined by light and electron microscopy by 1 experienced renal pathologist who was blinded to the SWV values. Interstitial fibrosis (ci) and tubular atrophy (ct) were classified using Banff criteria 2009.
Renal Function
Serum creatinine was measured by a traceable isotope-dilution mass spectrometry method. Glomerular filtration rates (GFRs) were estimated using the 4-variable Modification of Diet in Renal Disease formula (MDRD).
Kidney Weight to Body Weight Ratio (KW/BW)
Donated kidneys were weighted after an intraoperative flush with cold histidine–tryptophane–ketoglutarate (HTK) solution. Kidney graft masses are recipient bodyweight masses presented in grams and kilograms, respectively.
Statistical Analysis
The baseline characteristics of recipients and donors are expressed as means ± SDs for continuous variables or frequencies (percentages) for categorical variables. One-way analysis of variance was used to examine the interobserver reliability of SWV measurements. To explore associations between SWV and baseline parameters, Pearson's correlation coefficients and independent 2-sample t-tests were performed for continuous and categorical variables, respectively. Mixed model analysis was used to examine the correlation between SWV and SBP, and Fisher's z transformation was used to determine correlation significance. Mixed model analysis was also used to isolate the longitudinal effect of time on SWV and to examine the effect of KW/BW on longitudinal SWV changes. Post-hoc analysis was conducted to identify significant differences between time points, and univariate and multivariate logistic regression analyses were performed to identify factors influencing renal fibrosis. Two-sided P values <0.05 were considered significant. All statistical analyses were performed using SAS version 9.2 (SAS Inc, Cary, NC).
RESULTS
Baseline Characteristics
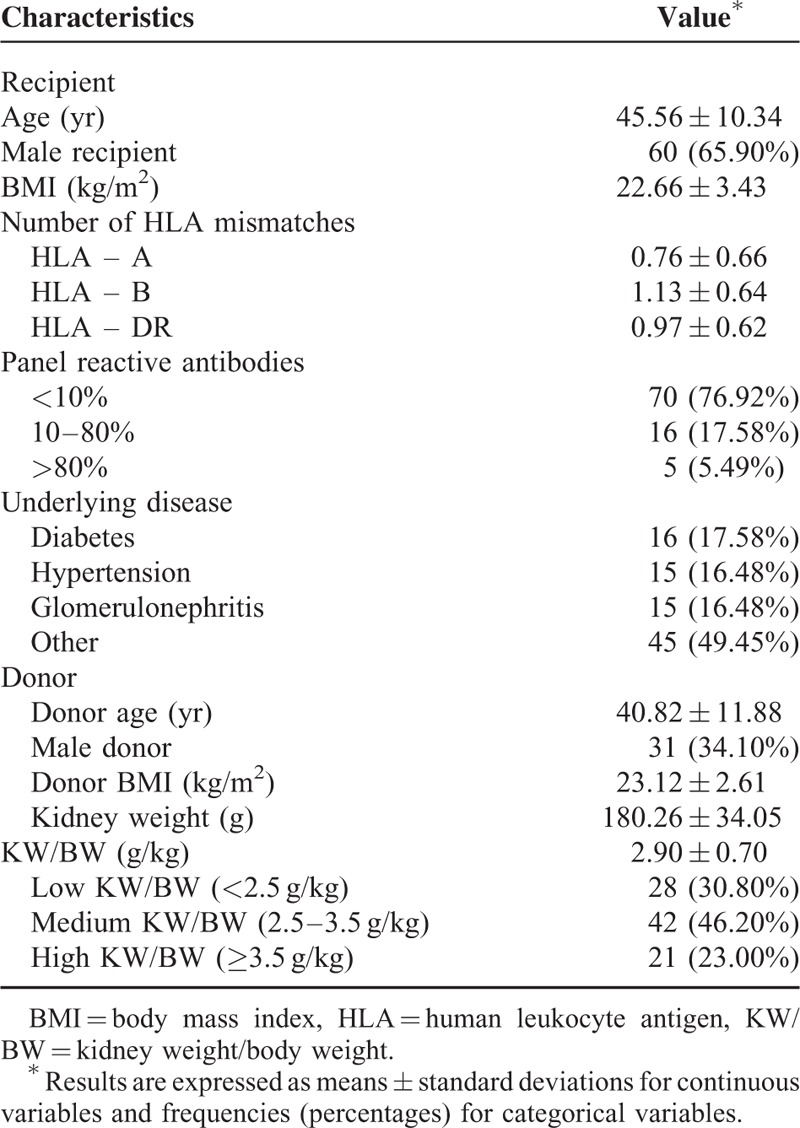
A total of 91 patients who underwent living donor kidney transplantation were included in the analysis. Their baseline characteristics are shown in Table 1. Among the recipients and donors, 65.9% and 34.1% were male, respectively, and the mean recipient and donor ages were 45.1 ± 10.3 and 40.8 ± 11.9 years, respectively. The mean kidney graft weight was 180.3 ± 34.1 g, and the mean KW/BW was 2.9 ± 0.7 g/kg.
TABLE 1.
Baseline Patient Characteristics
SWV Measurement
A total of 340 ARFI data sets were included (Figure 1). Three investigators were randomly assigned to perform ARFI measurements. The mean SWVs were 2.47 ± 0.58, 2.27 ± 0.55, and 2.69 ± 0.59 for investigators A, B, and C, respectively (P = 0.66).
FIGURE 1.
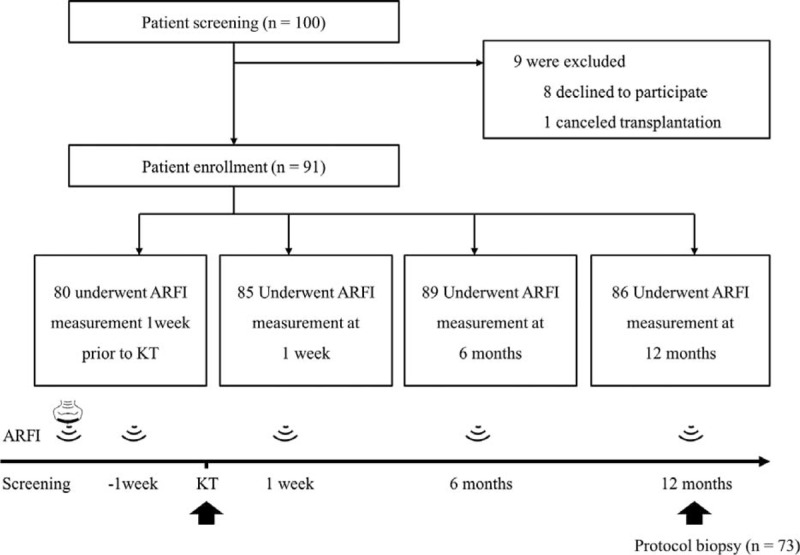
Schematic diagram of study design. ARFI = acoustic radiation force impulse, KT = kidney transplantation.
Relationship Between SWV and Baseline Parameters
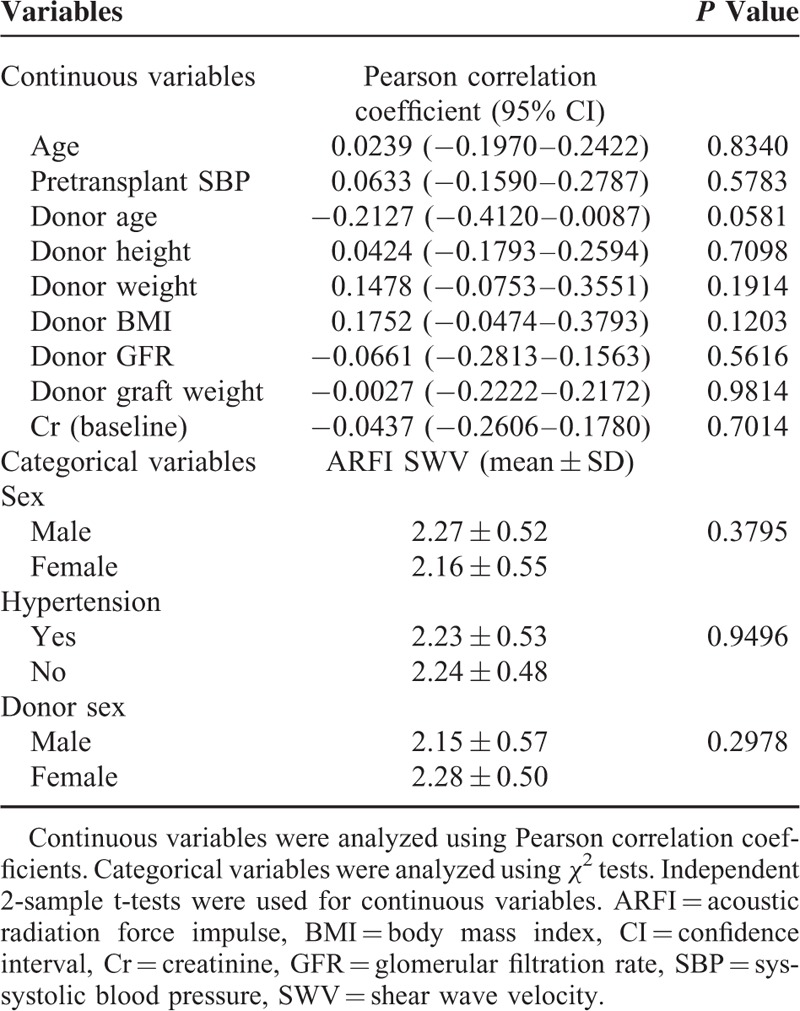
The relationships between SWV and baseline parameters are summarized in Table 2. Mechanical factors, including hypertension, SBP, kidney weight, and body mass index (BMI), were measured. The donor age was borderline significant (r = 0.2127, P = 0.0581), but mixed model analysis did not reveal a correlation between SWV and SBP or creatinine.
TABLE 2.
Relationship Between SWV and Baseline Parameters
SWV Change Over Time
The SWVs of transplanted kidneys gradually and significantly increased over the first year after transplantation (P < 0.0001). SWV temporal patterns are shown in Figure 2. Post-hoc analysis also showed significant differences in SWVs measured at the 3 time points.
FIGURE 2.
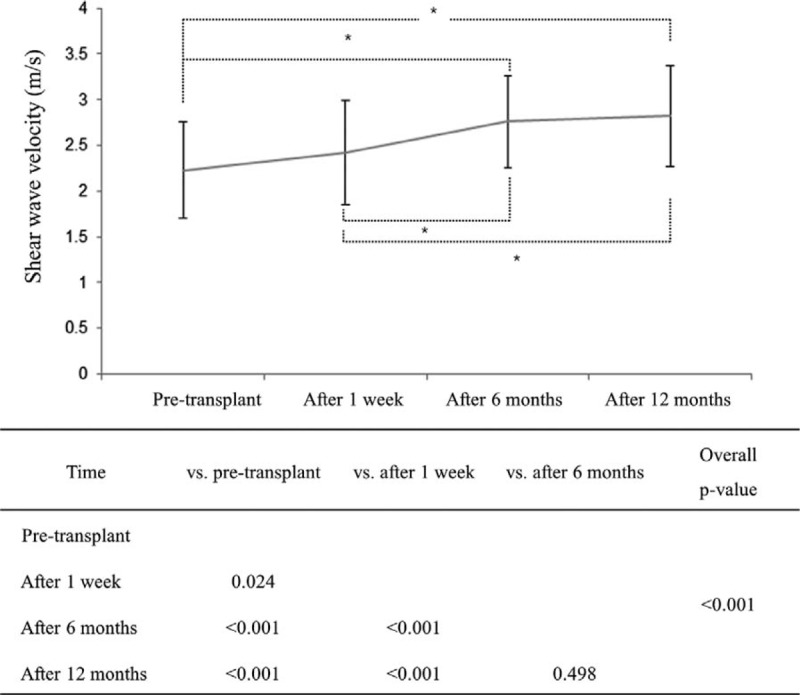
Mean SWV changes according to time. Mean ± SD at each time point. SWV = shear wave velocity. ∗Indicates the significant difference between 2 time points.
Relationship Between SWV and IF/TA
Of the 91 patients, 73 underwent a protocol biopsy at 1 year after transplantation. We did not perform protocol biopsies in patients with chronic anticoagulation (n = 18). Patients were categorized according to 1-year protocol biopsy results to normal (n = 33) or IF/TA (n = 40) groups. Members of the IF/TA group were defined as having a ci + ct ≥ 1 on 1-year protocol biopsies. The majority of patients in the group were grade I (87.5%), but 10% and 2.5% were grades II and III, respectively. SWVs were not significantly different among the 3 grades (P = 0.592).
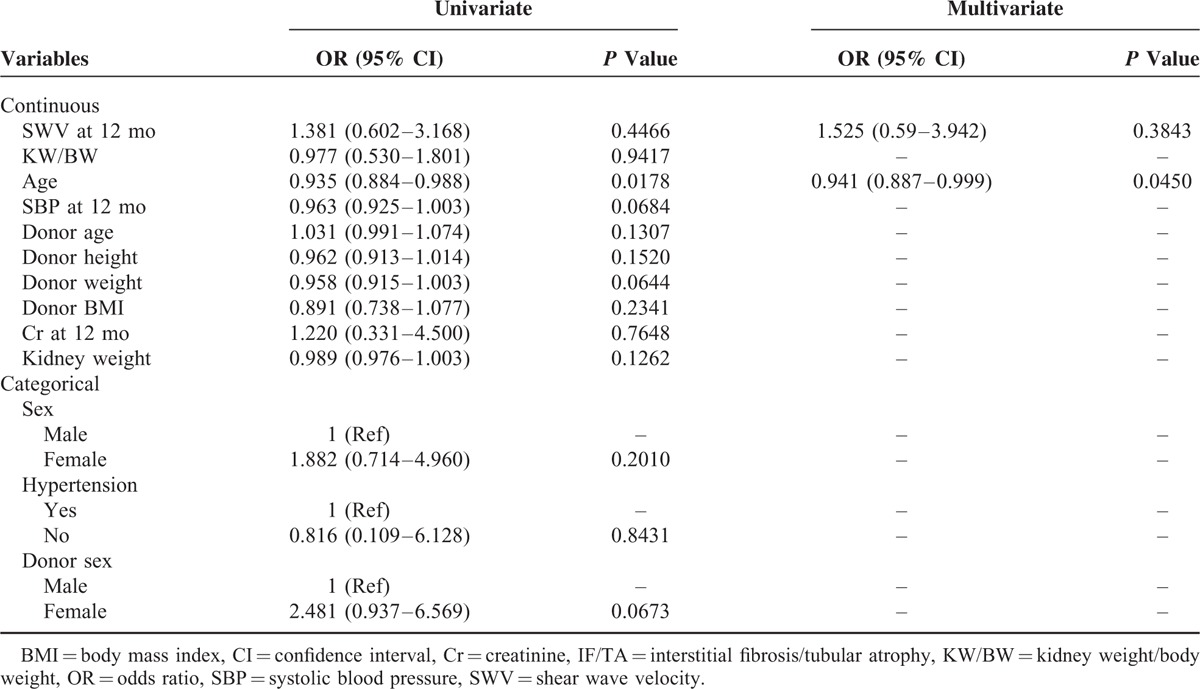
Recipient characteristics, donor factors, and 1-year SWVs for the normal and IF/TA groups are compared in Table 3. Univariate regression showed that only recipient age was associated with IF/TA (P = 0.0178), and 1-year SWV was not associated with IF/TA. Furthermore, multivariate logistic regression analysis adjusted for age confirmed the absence of an association between SWV and IF/TA.
TABLE 3.
Results of Logistic Regression Analysis on IF/TA
Relationship Between SWV and KW/BW
KW/BW ratios ranged from 1.74 to 4.95. For the analysis, patients were divided into 3 groups: low (KW/BW < 2.5 g/kg; n = 28; 30.8%), medium (2.5 ≤ KW/BW < 3.5 g/kg; n = 42; 46.2%), or high (KW/BW ≥ 3.5 g/kg; n = 21; 23.0%). In the low and medium groups, the mean SWV continuously increased over the first 12 months, whereas it decreased after 6 months in the high group (Figure 3). Mixed model analysis revealed that the group mean SWVs were significantly different regardless of time (P = 0.0315) and significantly dependent on time regardless of the KW/BW group (P < 0.0001).
FIGURE 3.
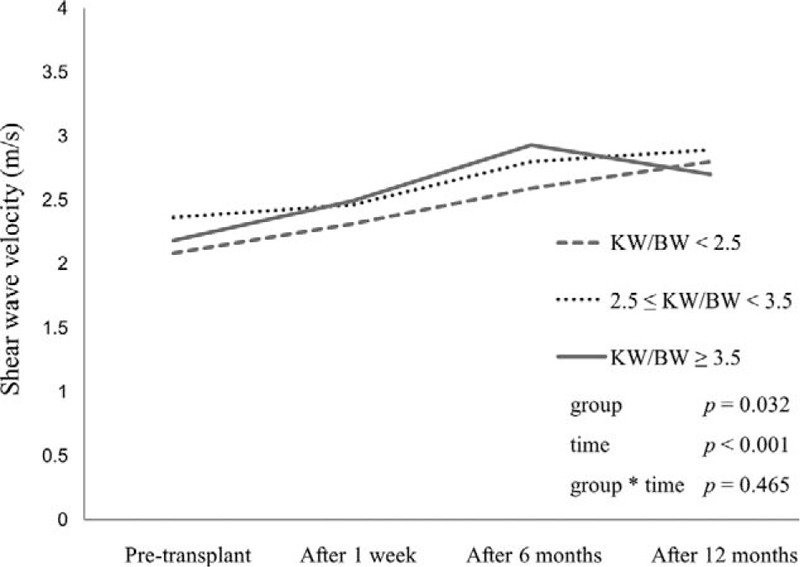
Mean SWV changes according to time and KW/BW. KW/BW = kidney weight/body weight, SWV = shear wave velocity.
DISCUSSION
ARFI measurement has been shown to provide a reliable means of assessing fibrosis in chronic liver disease.8–10 However, assessing renal fibrosis by ARFI is controversial, and the main factors that influence ARFI elastographic findings in the kidney have not been elucidated.15–17 In the present study, we compared serial changes in SWV values with biopsy findings.
Regarding the mechanism of ARFI, we expected that SWV values might reflect IF/TA or renal function. However, SWV values measured before transplantation and 1 week and 6 and 12 months after transplantation showed no significant correlation with histologic IF/TA findings. Similarly, no correlation was observed between SWV and serum creatinine by mixed model analysis adjusted for time. Instead of reflecting renal fibrosis, SWV was found to be related to the time since transplantation. In fact, mean SWV continuously increased for 1 year after renal transplantation.
Previous studies that attempted to determine the predictive value of tissue elastography in terms of renal fibrosis or function in kidney transplant recipients or chronic kidney disease patients published conflicting results. Stock et al13 described a positive correlation between SWV and histologic fibrosis in renal allografts, whereas Syversveen et al reported that SWV measurements were no different for kidney grafts with various degrees of fibrosis.14 Some authors reported a positive correlation between SWV and renal function,11,17 while others found a significant negative correlation between the two.12,18 Greiner et al found no relationship between elastography results and renal function.19
These discrepancies might be explained by the use of cross-sectional designs, whereas the present study was prospective, which allowed us to minimize the impacts of underlying characteristics such as age, sex, and immunologic background. Furthermore, times after transplantation varied in prior studies, and according to our findings, SWVs increased during the first 12 months regardless of renal function or fibrosis.
Theoretically, SWV is affected by tissue stiffness; thus, we expected a positive correlation between SWV and histologic IF/TA 1 year after transplantation. However, SWV was found to increase with time after transplantation irrespective of IF/TA. This suggests that some factor(s) other than tissue fibrosis changes with time after transplantation and affects SWV. For example, hemodynamic factors may have the potential to affect renal SWV.15,17,20
In the present study, we did not observe significant correlations between SWV and central hemodynamic factors (SBP and hypertension). Thus, we assumed that the SWV values might be influenced by renal hemodynamics. Intrarenal blood flow decreases as fibrosis increases, and these processes have opposite effects on renal tissue stiffness.15,17
We observed that serial changes in SWV were dependent on the KW/BW ratio. Approximately 20–25% of cardiac output is directed to the kidney, which constitutes less than 1% of body mass. Consequently, small differences in the KW/BW ratio would significantly affect renal hemodynamics. The mean SWV of patients with a low-to-medium KW/BW ratio continuously increased for 12 months, whereas it decreased after 6 months in those with a high KW/BW ratio. This finding probably reflects the different hemodynamic changes required to adapt to recipient metabolic demand. According to the hyperfiltration hypothesis, relatively small kidneys undergo more “adaptive” glomerular hyperfiltration.21,22 Interestingly, the low KW/BW patients showed greater adaptive increases in graft GFR compared with high KW/BW patients during the first 6 months after transplantation.23 Similarly, Codas et al reported a more rapid increase in GFR in patients with low KW/BW ratio in the first 12 months after transplantation.24 Accordingly, our results provide supportive evidence regarding the effect of the KW/BW ratio on the adaptive hyperfiltration phenomenon.
After kidney transplantation, grafts are subject to simultaneous or serial injuries that may promote IF/TA. In addition, a recent study demonstrated that IF/TA is an early event even in the setting of living donor kidney transplantation.25 However, it is difficult to determine which injuries lead to graft loss. Although allograft biopsy is the current gold standard for evaluating IF/TA, it is challenging to recognize IF/TA at a modifiable stage. In addition, serum creatinine or GFR is limited in terms of estimating graft fibrosis severity. Therefore, noninvasive, sensitive diagnostic tools are critically needed for early detection. Determining whether diagnostic tools have predictive value requires longitudinal studies,26 but the majority of investigations into ultrasound-based elastographic methods in kidney transplantation have been cross-sectional.13,14,19 The present study is strengthened by its longitudinal design and the relative homogeneity of graft kidney characteristics.
Despite our inability to detect IF/TA or renal dysfunction, we did observe that SWV values increased with time after transplantation. These results suggest that renal hemodynamics according to the KW/BW ratio might reflect the SWV. The clinical implications of ARFI in the context of kidney transplantation remain unclear; thus, further studies are needed to elucidate the potential role of elastographic techniques in renal transplantation patients.
This single-center study has several limitations. First, despite its prospective, longitudinal nature, the number of patients enrolled was relatively small. In addition, few severe IF/TA cases were included due to the short-term follow-up after transplantation. Finally, although ARFI measurements were performed by randomly assigned investigators, investigator choice might have influenced the results.
CONCLUSION
No significant correlation was observed between shear wave velocity and renal fibrosis or dysfunction. However, shear wave velocity was related to the time since transplantation. Furthermore, kidney weight to body weight ratio influenced time-dependent changes in shear wave velocity.
Footnotes
Abbreviations: ARFI = acoustic radiation force impulse, BMI = body mass index, ci = interstitial fibrosis, ct = tubular atrophy, GFR = glomerular filtration rates, HTK = histidine–tryptophane–ketoglutarate, IF/TA = interstitial fibrosis and tubular atrophy, KW/BW = kidney weight to body weight ratio, MDRD = Modification of Diet in Renal Disease formula, OR = odds ratio, ROI = region of interest, SBP = systolic blood pressure, SWV = shear wave velocity.
JL and YTO contributed equally to this work.
This work was supported by a research grant from Clinical Trials Center for Medical Devices at Severance Hospital (#1-2010-0011).
The authors have no conflicts of interest to disclose.
REFERENCES
- 1.Nankivell BJ, Borrows RJ, Fung CL, et al. The natural history of chronic allograft nephropathy. N Engl J Med 2003; 349:2326–2333. [DOI] [PubMed] [Google Scholar]
- 2.Naesens M, Kuypers DR, De Vusser K, et al. Chronic histological damage in early indication biopsies is an independent risk factor for late renal allograft failure. Am J Transplant 2013; 13:86–99. [DOI] [PubMed] [Google Scholar]
- 3.Li X, Zhuang S. Recent advances in renal interstitial fibrosis and tubular atrophy after kidney transplantation. Fibrogenesis Tissue Repair 2014; 7:15. [DOI] [PMC free article] [PubMed] [Google Scholar]
- 4.Schwarz A, Gwinner W, Hiss M, et al. Safety and adequacy of renal transplant protocol biopsies. Am J Transplant 2005; 5:1992–1996. [DOI] [PubMed] [Google Scholar]
- 5.Haas M. Chronic allograft nephropathy or interstitial fibrosis and tubular atrophy: what is in a name? Curr Opin Nephrol Hypertens 2014; 23:245–250. [DOI] [PubMed] [Google Scholar]
- 6.Nightingale K. Acoustic radiation force impulse (ARFI) imaging: a review. Curr Med Imaging Rev 2011; 7:328–339. [DOI] [PMC free article] [PubMed] [Google Scholar]
- 7.Palmeri ML, Wang MH, Dahl JJ, et al. Quantifying hepatic shear modulus in vivo using acoustic radiation force. Ultrasound Med Biol 2008; 34:546–558. [DOI] [PMC free article] [PubMed] [Google Scholar]
- 8.Rifai K, Cornberg J, Mederacke I, et al. Clinical feasibility of liver elastography by acoustic radiation force impulse imaging (ARFI). Dig Liver Dis 2011; 43:491–497. [DOI] [PubMed] [Google Scholar]
- 9.Ebinuma H, Saito H, Komuta M, et al. Evaluation of liver fibrosis by transient elastography using acoustic radiation force impulse: comparison with Fibroscan ((R)). J Gastroenterol 2011; 46:1238–1248. [DOI] [PubMed] [Google Scholar]
- 10.Yoon KT, Lim SM, Park JY, et al. Liver stiffness measurement using acoustic radiation force impulse (ARFI) elastography and effect of necroinflammation. Dig Dis Sci 2012; 57:1682–1691. [DOI] [PubMed] [Google Scholar]
- 11.Guo LH, Xu HX, Fu HJ, et al. Acoustic radiation force impulse imaging for noninvasive evaluation of renal parenchyma elasticity: preliminary findings. PLoS One 2013; 8:e68925. [DOI] [PMC free article] [PubMed] [Google Scholar]
- 12.He WY, Jin YJ, Wang WP, et al. Tissue elasticity quantification by acoustic radiation force impulse for the assessment of renal allograft function. Ultrasound Med Biol 2014; 40:322–329. [DOI] [PubMed] [Google Scholar]
- 13.Stock KF, Klein BS, Vo Cong MT, et al. ARFI-based tissue elasticity quantification in comparison to histology for the diagnosis of renal transplant fibrosis. Clin Hemorheol Microcirc 2010; 46:139–148. [DOI] [PubMed] [Google Scholar]
- 14.Syversveen T, Brabrand K, Midtvedt K, et al. Assessment of renal allograft fibrosis by acoustic radiation force impulse quantification: a pilot study. Transpl Int 2011; 24:100–105. [DOI] [PubMed] [Google Scholar]
- 15.Wang L, Xia P, Lv K, et al. Assessment of renal tissue elasticity by acoustic radiation force impulse quantification with histopathological correlation: preliminary experience in chronic kidney disease. Eur Radiol 2014; 24:1694–1699. [DOI] [PubMed] [Google Scholar]
- 16.Syversveen T, Midtvedt K, Berstad AE, et al. Tissue elasticity estimated by acoustic radiation force impulse quantification depends on the applied transducer force: an experimental study in kidney transplant patients. Eur Radiol 2012; 22:2130–2137. [DOI] [PubMed] [Google Scholar]
- 17.Asano K, Ogata A, Tanaka K, et al. Acoustic radiation force impulse elastography of the kidneys: is shear wave velocity affected by tissue fibrosis or renal blood flow? J Ultrasound Med 2014; 33:793–801. [DOI] [PubMed] [Google Scholar]
- 18.Arndt R, Schmidt S, Loddenkemper C, et al. Noninvasive evaluation of renal allograft fibrosis by transient elastography: a pilot study. Transpl Int 2010; 23:871–877. [DOI] [PubMed] [Google Scholar]
- 19.Grenier N, Poulain S, Lepreux S, et al. Quantitative elastography of renal transplants using supersonic shear imaging: a pilot study. Eur Radiol 2012; 22:2138–2146. [DOI] [PubMed] [Google Scholar]
- 20.Bob F, Bota S, Sporea I, et al. Kidney shear wave speed values in subjects with and without renal pathology and inter-operator reproducibility of acoustic radiation force impulse elastography (ARFI): preliminary results. PLoS One 2014; 9:e113761. [DOI] [PMC free article] [PubMed] [Google Scholar]
- 21.Brenner BM, Milford EL. Nephron underdosing: a programmed cause of chronic renal allograft failure. Am J Kidney Dis 1993; 21 (5 Suppl 2):66–72. [DOI] [PubMed] [Google Scholar]
- 22.Kim YS, Moon JI, Kim DK, et al. Ratio of donor kidney weight to recipient bodyweight as an index of graft function. Lancet 2001; 357:1180–1181. [DOI] [PubMed] [Google Scholar]
- 23.Giral M, Foucher Y, Karam G, et al. Kidney and recipient weight incompatibility reduces long-term graft survival. J Am Soc Nephrol 2010; 21:1022–1029. [DOI] [PMC free article] [PubMed] [Google Scholar]
- 24.Codas R, Danjou F, Dagot C, et al. Influence of allograft weight to recipient bodyweight ratio on outcome of cadaveric renal transplantation. Nephrology (Carlton) 2014; 19:420–425. [DOI] [PubMed] [Google Scholar]
- 25.Khan H, Mubarak M, Aziz T, et al. Prevalence and risk factors for early chronic allograft nephropathy in a live related renal transplant program. J Nephropathol 2014; 3:69–79. [DOI] [PMC free article] [PubMed] [Google Scholar]
- 26.Galichon P, Xu-Dubois YC, Finianos S, et al. Clinical and histological predictors of long-term kidney graft survival. Nephrol Dial Transplant 2013; 28:1362–1370. [DOI] [PubMed] [Google Scholar]


