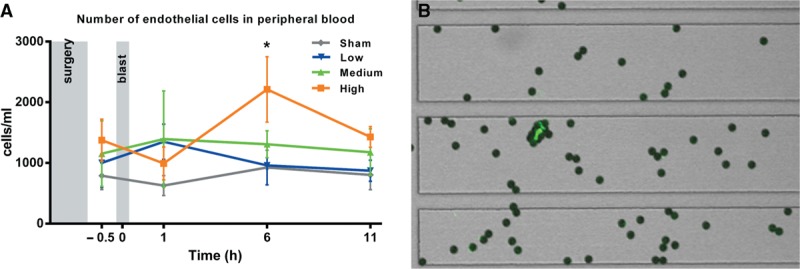
Fig. 1.

Number of endothelial cells in peripheral blood pre- and post-blast exposure (A). Sham, low, and medium groups n = 6, High group n = 9. Number of CECs was significantly higher at 6 h in high group compared with at 1 h and compared with sham at 6 h (P < 0.05, two-way ANOVA). Error bars show ± SEM. Example of a CEC stained with FITC-UEA-1 with 4 μm magnetic beads attached (B).
