Abstract
IMPORTANCE
Early detection of small asymptomatic kidney tumors presages better patient outcome. Incidental discovery of asymptomatic renal tumors by abdominal imaging is expensive and cannot reliably distinguish benign from malignant tumors.
OBJECTIVE
This investigation evaluated the clinical utility, sensitivity and specificity of urine aquaporin-1 (AQP1) and perilipin-2 (PLIN2) concentrations as unique noninvasive biomarkers to diagnose malignant clear cell or papillary renal cell carcinoma (RCC) in a screening paradigm.
DESIGN, SETTING, AND PARTICIPANTS
Urine samples were obtained from 720 patients undergoing routine abdominal CT (screening population), 80 healthy controls and 19 patients with pathologically confirmed RCC. Urine AQP1 and PLIN2 concentrations were measured by sensitive and specific ELISA and Western blot procedures, respectively.
MAIN OUTCOMES AND MEASURES
AQP1 and PLIN2 were measured prospectively in a screening paradigm in an otherwise asymptomatic population. The absence or presence of a renal mass and of RCC, were verified by abdominal computed tomography (CT) and by post-nephrectomy pathologic diagnosis, respectively.
RESULTS
Median urine AQP1 and PLIN2 concentrations in patients with known RCC were more than 12-fold higher (P<0.0001 each) than controls and the screening population. The area under the receiver operating characteristic curve for urine AQP1 and PLIN2 concentrations individually or in combination was ≥0.92, with ≥85% sensitivity and ≥87% specificity compared with control or screening patients. Three of the 720 screening patients had biomarker concentrations suggestive of RCC and were found to have an imaged renal mass by CT. Two patients, evaluated further, had RCC.
CONCLUSIONS AND RELEVANCE
These results demonstrate the clinical utility, specificity and sensitivity of urine AQP1 and PLIN2 to diagnose RCC. These novel tumor-specific proteins have high clinical validity and substantial potential as specific diagnostic and screening biomarkers for clear cell and papillary RCC, and in the differential diagnosis of imaged renal masses.
INTRODUCTION
Cancers of the kidney and renal pelvis are the most lethal urologic malignancies. There has been a steady rise in their incidence, and they now account for almost 4% of adult malignancies.1-5 The overall age-adjusted renal cancer incidence is 51.7/100,000 for individuals over 50 years of age. 5
Due to increased general diagnostic use of abdominal imaging, there has been a consequent increase in incidental discovery of occult small renal masses. Additionally, incidental rather than symptomatic discovery has resulted in a stage migration towards smaller tumors, and, consequently a higher potential for cure. 1,3,4Importantly, early detection of smaller, intrarenal RCC presages better patient outcome. Patients with pre-symptomatic, incidentally detected tumors have a 5-year disease-free survival of 85%, while patients with cancers detected symptomatically have a 5-year disease-free survival of only 62%.6,7 The prognosis for metastatic RCC is even worse; the 5-year RCC-specific survival ranges from about 40% with nodal metastases to about 20% with distant metastases.8 There are other substantial benefits to early detection. If the tumor is confined to the renal capsule at diagnosis and nephrectomy, survival can exceed 70%. Additional benefits include the opportunities for laparoscopic vs open nephrectomy and partial versus total nephrectomy. Minimally invasive laparoscopic surgery, as well as percutaneous radiofrequency and cryoablation techniques offer shorter hospitalization, faster recovery, less pain and disability, fewer complications and lower costs compared to open nephrectomy.9,10 Nephron-sparing partial nephrectomy rather than total nephrectomy preserves renal mass and long-term renal function, and minimizes future chronic kidney disease.9-13 Thus, early diagnosis of asymptomatic RCC portends identification of smaller, earlier-stage tumors, with targeted and less morbid intervention, and better prognosis.
It has been suggested that to achieve more widespread early diagnosis, and further improvement in the RCC mortality rate, would require population screening of patients.4 Nevertheless, the only currently available modalities to screen large populations for RCC (more precisely, renal masses) are computed tomography (CT) and magnetic resonance imaging (MRI). However, this is prohibitively expensive and would not be cost-effective. Furthermore, although CT and MRI are generally accurate for detecting renal cell carcinoma, certain benign masses may be indistinguishable from a renal cancer.14-19
An alternative to radiologic screening would involve the use of a sensitive and specific tumor marker. Currently there are no readily available or clinically validated screening biomarkers for RCC.18 Our previous studies have shown that urine aquaporin 1 (AQP1) and perilipin 2 (PLIN2, formerly called ADFP) concentrations are sensitive and specific biomarkers for the early noninvasive detection of clear cell or papillary subtypes of kidney cancer.20-23 These investigations demonstrated that AQP1 and PLIN2 concentrations were significantly higher in patients with clear cell and papillary cancers compared with controls, were correlated with tumor size, and stage (but not grade),20,21 and were decreased over 83% following tumor excision.20,21 Urine concentrations of AQP1 or PLIN2 were not increased in patients with a) common non-cancerous kidney diseases such as diabetic nephropathy, glomerulonephritis and urinary tract infections,20 b) non-cancerous kidney tumors (oncocytomas, angiomyolipomas),23 or c) bladder or prostate cancer.23 Thus, common kidney disease and non-renal urologic cancers do not confound the ability of AQP1 and PLIN2 to detect clear cell and papillary cancers, suggesting that these biomarkers have potential for population screening and/or differential diagnosis of imaged renal masses. These studies20-23 are consistent with the first two phases of diagnostic cancer biomarker development 24 by identifying promising biomarkers (phase 1) and establishing that the biomarkers identify clinical disease from potential confounding diseases (phase 2). Nevertheless, investigations to date have evaluated only the assay and early clinical validity, with small discovery and validation cohorts known a priori to have or not have RCC, and sensitivity and specificity have not been established in larger clinical validation cohorts, and in a prospective, blinded fashion.
The purpose of this investigation was to test the hypothesis that urine concentrations of AQP1 and PLIN2 are prospectively diagnostic of RCC in a screening paradigm. This was tested using a convenience sample of several hundred patients undergoing abdominal CT as part of routine clinical evaluation. Urine samples from a heterogeneous clinical population were thus obtained. Urine concentrations of AQP1 and PLIN2 were prospectively measured and subsequently compared to CT results radiologically establish the presence or absence of a renal mass. The presence or absence of kidney cancer was surgically confirmed to see if the biomarkers were predictive of RCC as validated by a post-surgical pathologic diagnosis. This determined whether the biomarkers were able to diagnose early preclinical disease and establish a “screen positive rule” thus satisfying phase 3 of diagnostic cancer biomarker development.24
MATERIALS AND METHODS
PATIENTS
Approval was obtained from the Washington University Institutional Review Board, and written informed consent was obtained from all patients. From February through December 2012, urine samples were obtained from a) 720 patients undergoing CT of the abdomen with contrast for a variety of benign and malignant diseases; termed a screening population, b) 19 patients preoperatively on the day of surgery who were undergoing partial or radical nephrectomy with a presumptive diagnosis of kidney cancer based on a CT imaged renal mass (and whose postoperative pathology diagnosis established clear cell or papillary kidney cancer), and c) 80 self-defined healthy controls. Owing to the prominent cancer focus of our outpatient clinics, a large fraction of the 720 patients having CT exams were current or former cancer patients. The CT cohort was subsequently designated as a) no history of cancer (n=334) or b) history of cancer, either current or remote (n=386) group. All 720 CT studies were reviewed by a subspecialty-trained abdominal radiologist to identify or exclude renal cancer.
Sample size calculations were based on results from the control group of a previous study using the mean and standard deviation of the urine AQP1 and PLIN2 concentrations.20 To detect a 2-fold (conservative assumption) increase in biomarker concentrations above control in patients with RCC, based on a two-sided t-test and 90% power, would require a minimum of 18 patients for AQP1 and 1ten for PLIN2 (0.01 significance). Based on an institutional history of incidental discovery of two per 1,000 patients with an imaged renal mass, we anticipated finding one-two patients in the screening protocol with an incidental renal mass, and to be subsequently diagnosed with RCC.
CLINICAL AND PATHOLOGICAL DATA
Demographic data and medical history were recorded including age, sex, weight, surgery performed and final diagnoses. Post-operative pathology reports for those individuals with an imaged renal mass provided cell type, size, tumor stage/node metastases/distant metastases (TNM), and Fuhrman grade.
AQP1 AND PLIN2 MEASUREMENT
Urine AQP1 concentration was determined by a ELISA using a proprietary monoclonal capture antibody and a commercially available antibody (H-55, Santa Cruz Biotechnology, Sana Cruz, CA) as detector. Detailed methodology of the AQP1 ELISA is given as a supplement. The urine PLIN2 concentration was determined by a sensitive and specific Western blot procedure as previously described.20,21,23
STATISTICAL ANALYSIS
Non-normally distributed variables were expressed as median with interquartile range and normally distributed variables were as mean ± standard deviation, as appropriate. Comparisons of age and sex were performed between all patient groups. Descriptive statistics compared age between groups using one-way ANOVA. Comparison of sex between groups was performed using the Pearson Chi-square test. Urine AQP1 and PLIN2 concentrations were compared in patients using the Kruskal-Wallis test with least square difference correction.
Receiver operating characteristic (ROC) analysis was performed for each biomarker individually using a nonparametric method.25 Since the prevalence of RCC is low,5 the cutoff of each biomarker when comparing to the healthy controls was set at the highest value of the healthy control patients to minimize the false-positive rate. For the screening analysis, data for patients undergoing nephrectomy for an imaged renal mass and pathologically-proven clear cell or papillary kidney cancer were compared to that of the screening patient population. Area under the ROC (AROC) curve for each biomarker individually was determined by the nonparametric trapezoidal method with the 95% confidence interval derived using the DeLong method of the R package AMORE and the optimal cutoff for each marker determined by maximizing the Youden Index. In addition, a logistic regression was used to model the outcome using both biomarkers together after adding together the numerical values of each patient’s AQP1 and PLIN2 concentration and median centering to determine the AROC.25 Additional AROC information was determined by a Monte Carlo resampling model comparing the urine biomarker levels of the known kidney cancer patients (22 patients with an imaged renal mass overall) in comparison to 22 randomly drawn patients from the remaining 717 screened patients. The random resampling was performed 1000 times and all AROC analyses averaged. Irrespective of the analysis, all values were considered statistically significant at the 0.05 level or less.
Statistical analysis was performed using R statistical software (http://www.r-project.org) and Analyse-it for Excel 2010 (Analyse-it Software, Ltd, Leeds, United Kingdom).
RESULTS
PATIENT CHARACTERISTICS
This investigation studied 80 healthy controls, 19 patients with pathologically proven clear cell or papillary RCC, and 720 patients (mainly outpatients) undergoing abdominal CT with contrast for various indications. The age and sex of each of the four groups are listed in Table 1. The four groups were statistically homogeneous based on age (P=0.201, 1-Way ANOVA with Tukey contrast). The sex of the healthy controls, those with no history of cancer, and those with a prior cancer history was statistically indistinguishable (P=0.756, Chi-square test for proportions). However, the 19 patients with kidney cancer as a group were slightly but significantly older than the healthy controls (P=0.015), those with no cancer history (P=0.008), and those with a history of cancer (P=0.009) (all by the Kruskal-Wallis test with least square difference contrast). Table 2 summarizes the tumor stage, grade, node involvement and incidence of distant metastases of the 19 patients following pathology-based confirmation of kidney cancer.
Table 1.
Patient Characteristics
| Number | Age (yr)* | Age Range (yr) |
Male/Female | |
|---|---|---|---|---|
| Healthy Controls | 80 | 58 ± 7 | 42 to 82 | 34/46 |
| No Cancer History | 334 | 60 ± 14 | 21 to 88 | 148/186 |
| History of Cancer** | 386 | 60 ± 12 | 30 to 87 | 152/234 |
| Known Kidney Cancer | 19 | 64 ± 7 | 54 to 80 | 15/4 |
mean ± standard deviation
Includes three subjects with incidentally discovered occult kidney cancer
Table 2.
Pathological data for the 19 prospective renal cell cancer patients.
| Number | % of Total | |
|---|---|---|
| Tumor histological subtype | ||
| Clear Cell | 13 | 69 |
| Papillary | 5 | 26 |
| Mixed (clear & chromophobe) | 1 | 5 |
| Post-op pT stage | ||
| pT1a | 9 | 48 |
| pT1b | 4 | 21 |
| pT2b | 1 | 5 |
| pT3 | 5 | 26 |
| Furhman grade | ||
| 1 | 3 | 16 |
| 2 | 8 | 42 |
| 3 | 6 | 32 |
| 4 | 2 | 10 |
| Nodes | ||
| N0 | 18 | 95 |
| N1 | 1 | 5 |
| Metastasis at nephrectomy | ||
| No | 18 | 95 |
| Yes | 1 | 5 |
URINE BIOMARKER CONCENTRATIONS
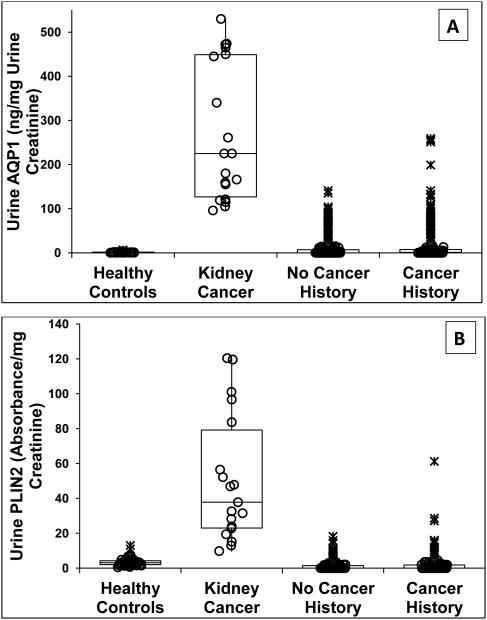
Urine AQP1 concentrations in the four patient groups are shown in Figure 1A. AQP1 concentration in patients with documented clear cell and papillary kidney cancer (median (1st, 3rd interquartile range)) was 225 (145, 445) ng/mg urine creatinine. This was significantly higher than in the healthy controls which was 1.1 (0, 1.7) (P<0.001), patients with no history of cancer which was 0 (0, 8) (P<0.001), and patients with a history of (non-renal) cancer which was 1.0 (0, 11.1) (P<0.001). The urine AQP1 concentration in patients with a history of (non-renal) cancer was not significantly different from that of the healthy controls (P=0.083). Urine AQP1 concentrations in the history of cancer group were not significantly different from that of the no cancer history group (P=0.434). There was no overlap of urine AQP1 concentrations in patients with confirmed kidney cancer and the controls. However, the urine AQP1 concentration in 35 of the 334 patients with no cancer history and 56 of the 386 patients with a cancer history did overlap with that of patients with confirmed kidney cancer (Figure 1A).
Figure 1.
Dot and box representation of urine AQP1 (A) and PLIN2 (B) concentrations. Depicted are the median, first, second, third and fourth quartiles. Values of individuals within the first through fourth quartile are represented by (O), values of individuals over 1.5 but under 3-times the interquartile range are represented by (+), and individuals exceeding 3-times the interquartile range are represented by (X). Median urine AQP1 concentration in the 19 patients enrolled a priori with confirmed kidney cancer (clear cell or papillary subtypes) is greater (P<0.001) than that of the 80 healthy controls, the 334 patients with no cancer history, and 386 patients with a history of non-kidney cancer. Median urine AQP1 concentration in the healthy controls is less than that of the cancer and no cancer groups (each P<0.001). The urine AQP1concentations in the cancer and no cancer groups are not significantly different (P=0.444). Median urine PLIN2 concentration in the 19 patients enrolled a priori with confirmed kidney cancer is greater (P<0.001) than that of the 80 healthy controls, the 334 patients with no cancer history), and 386 patients with a history of non-kidney cancer. Median urine PLIN2 concentration in the healthy controls is less than that of the no cancer group (P=0.032) but not the group with a history of cancer (P<0.085). Urine PLIN2 concentration in the no cancer and cancer groups is not different (P=0.447). Significance was determined by the Kruskal-Wallis test with least squares difference correction.
Urine PLIN2 concentrations in the four patient groups are shown in Figure 1B. The concentration in those patients with documented clear cell and papillary kidney cancer was 37.8 (27.1, 61.2) absorbance/mg urine creatinine. This was significantly higher than in the healthy controls which was 0 (0, 1.8) (P<0.001), patients with no cancer history which was also 0 (0, 1.5) (P<0.001), and patients with a history of non-renal cancer which was 3.1 (2, 4.2) (P<0.001). Urine PLIN2 concentration in the patients with a history of cancer and the patients with no cancer history were higher than in the healthy controls (each P<0.001). The urine PLIN2 concentration of the history of cancer group was not significantly different from that of the no cancer history group (P=0.438). Urine PLIN2 concentrations in two control patients slightly overlapped with that of the patients with confirmed clear cell and papillary kidney cancer. The urine PLIN2 concentration in six of the 334 patients with no cancer history and ten of the 386 patients with a cancer history did overlap with that of patients with confirmed clear cell and papillary kidney cancer (Figure 1B).
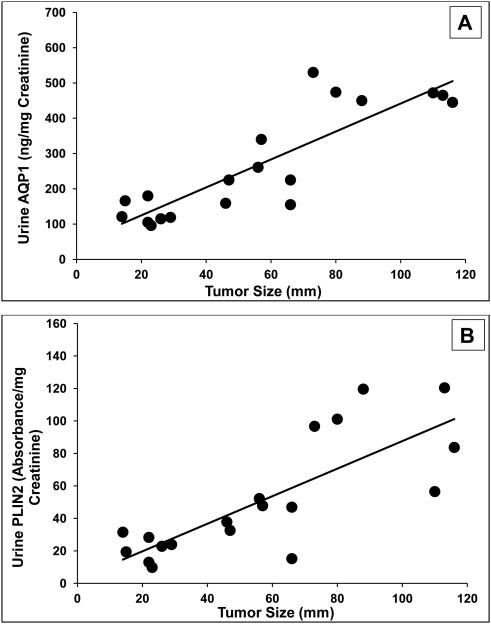
Urine biomarker concentrations in the 19 patients enrolled a priori with proven clear cell and papillary kidney cancer were proportional to the tumor size (Figure 2). There was a significant correlation between biomarker concentration and tumor size (Spearman correlation coefficients for AQP1 and PLIN2 were 0.78 and 0.72, respectively, both P<0.001). If biomarker concentrations were simply expressed per milliliter of urine rather than normalized to urine creatinine concentration, the correlation coefficients decreased to 0.67 for AQP1 and 0.63 for PLIN2 (not shown).
Figure 2.
Correlation between tumor size and urine biomarkers in the 19 patients enrolled a priori with kidney cancer (clear cell or papillary subtypes). (A) AQP1 concentrations (Spearman correlation coefficient 0.78, P<0.001) or (B) PLIN2 concentrations (Spearman coefficient 0.72, P<0.001).
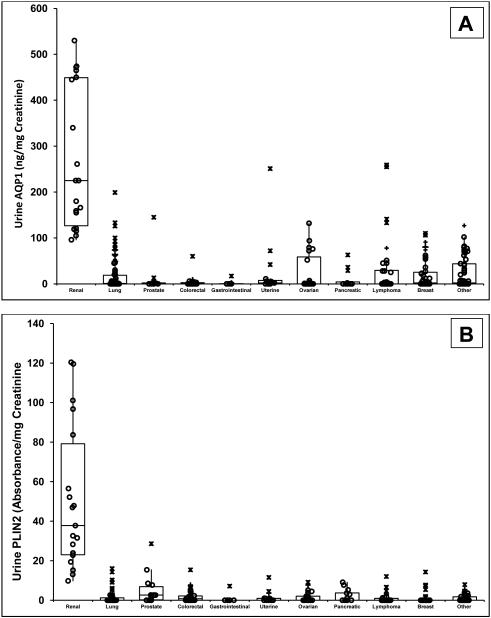
Median urine AQP1 and PLIN2 concentrations in the 19 patients enrolled with confirmed kidney cancer (clear cell or papillary subtypes) were significantly different (P<0.001 for both) from those of the 386 patients with cancer history. Comparison was also made between kidney cancer patients and those with various non-kidney cancer subgroups (Figure 3). Significant differences, or lack thereof, in urine AQP1 and PLIN2 concentrations between these different subgroups are summarized in eTable 1. Urine AQP1 and PLIN2 concentrations in patients with RCC were significantly higher than those of every other cancer subgroup evaluated (lung, prostate, colorectal, gastrointestinal, uterine, ovarian, pancreatic, lymphoma, and breast). Some patients with active lymphoma, lung, ovarian, breast and other cancers had urine AQP1 or PLIN2 levels that overlapped with that of patients with small clear cell or papillary tumors (Figure 3A and 3B).
Figure 3.
Dot and box representation of urine AQP1 (A) and PLIN2 (B) concentrations (ng or absorbance units per mg urine creatinine, respectively). Depicted are the median, first, second, third and fourth quartiles. Values of individuals within the first through fourth quartile are represented by (O), values of individuals over 1.5 but under 3-times the interquartile range are represented by (+), and individuals exceeding 3-times the interquartile range are represented by (X). The median urine AQP1 concentration for the 19 patients enrolled a priori with confirmed kidney cancer (clear cell or papillary subtypes) is significantly different (P<0.0001) from that of the 386 patients with a history of cancer in various non-kidney tissue/organs. These include lung (n=89), prostate (n=12), colorectal (n=25), gastrointestinal (n=11), uterine (n=16), ovarian (n=25), pancreatic (n=13), lymphoma (n=38), breast (n=44), and various other organs/tissues (n=95). Significant differences, or lack thereof in urine AQP1 and PLIN2 concentrations between all these different tissues/organs are summarized in eTable 1.
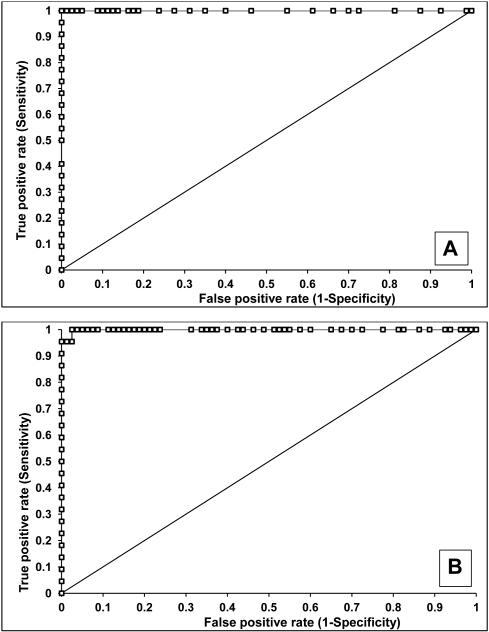
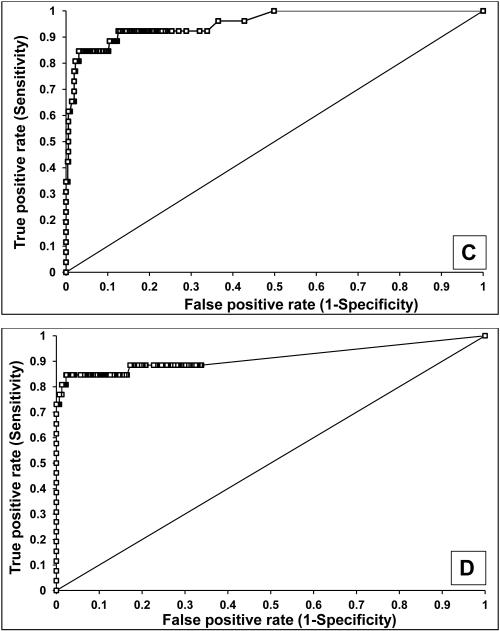
The sensitivity and specificity of AQP1 and PLIN2 (normalized to urine creatinine) to identify patients with clear cell or papillary kidney cancer was determined using receiver operating characteristic (ROC) analysis (Figure 4). Compared to healthy controls, urine AQP1 had 100% sensitivity and 100% specificity, with an area under the ROC (AROC) of 1.00 (Figure 4A) with a cutoff value of 7 ng/mg urine creatinine (the highest concentration of a healthy control). Similarly, urine PLIN2 had 100% sensitivity and 91% specificity, with an AROC of 0.99 (95% confidence interval 0.98-1.00) (Figure 4B) with a cutoff value of 14 absorbance units/mg creatinine. Compared to the 717 screened patients without renal cell cancer (see below), urine AQP1 had 92% sensitivity and 87% specificity, with an AROC of 0.95 (95% confidence interval 0.91-0.99) (Figure 4C) with a cutoff value of 52 ng/mg creatinine maximizing the Youden Index. Similarly, urine PLIN2 had 85% sensitivity and 97% specificity, with an AROC of 0.91 (95% confidence interval 0.88-0.95) (Figure 4D) with a cutoff value of 9.8 absorbance units per mg creatinine, again maximizing the Youden Index.
Figure 4.
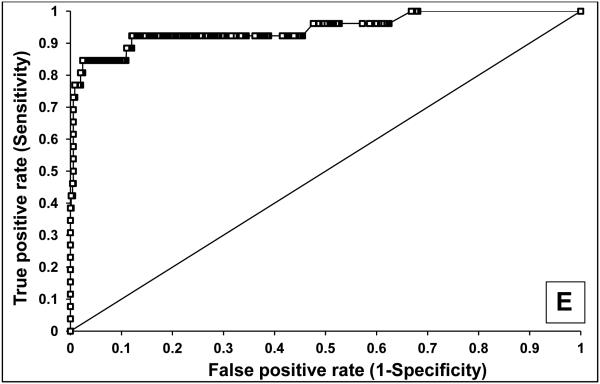
ROC analysis of urine AQP1 and PLIN2. AQP1 (A) and PLIN2 (B) concentrations in 22 patients with an imaged renal mass (19 enrolled a priori with a known renal mass and 3 incidentally discovered during CT screening - see Figure 5) compared with the 80 healthy controls. AQP1 (C) and PLIN2 (D) concentrations in the 22 patients with an imaged renal mass compared with the 717 patients without an imaged renal mass. AQP1 and PLIN2 concentrations which were added (E) compared with the 717 patients without an imaged renal mass
An internal validation of the biomarkers by means of data resampling was also conducted. Because the number of patients with kidney cancer was much smaller than the screening population, Monte Carlo analysis was performed. Data for the 717 screened patients without an imaged renal mass (see below) were randomly sampled in cohorts of 22 patients, and compared to that of the 22 patients with confirmed renal cell cancer. This was repetitively resampled 1000 times. The resulting AROC for AQP1 was 0.95 (95% confidence interval 0.92-0.98, P<0.001) and for PLIN2 was 0.92 (95% confidence interval 0.90-0.93, P<0.001) (not shown).
Additional statistical analyses were performed to assess whether both biomarkers together provided improved sensitivity and/or specificity. Adding the numerical values of each patient’s AQP1 and PLIN2 urine concentrations in a logistic regression model had 92% sensitivity and 88% specificity with an AROC of 0.94 (confidence interval 0.87-1.00) (Figure 4E). The sensitivities and specificities of the combination was not significantly different from those of the individual markers.
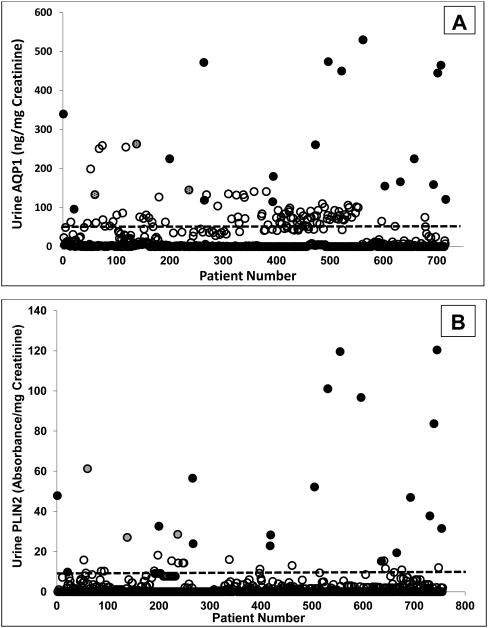
Individual patient results from the screening protocol were evaluated next. Urine AQP1 and PLIN 2 concentrations in the 19 patients enrolled a priori with an imaged renal mass undergoing nephrectomy and with pathologically-proven clear cell or papillary kidney cancer, and the 720 patients undergoing abdominal CT in the screening paradigm, are shown in Figure 5. The vast majority of non-kidney cancer patients had low concentrations of AQP1 and PLIN2, that were below the respective cut-off values (derived from the ROC analysis in Figures 4C and 4D), while those with a known renal mass presenting for nephrectomy and found to have kidney cancer had AQP1 and PLIN2 concentrations that were above the cut-off value. When the same biomarker data were expressed per milliliter of urine (without normalization to urine creatinine, eFigures 1A and 1B), the same relative relationships seen in Figures 5A and 5B remain.
Figure 5.
Urine AQP1 (A) and PLIN2 (B) concentration in individual patients enrolled between February and December 2012. The biomarker concentration (ng/mg creatinine for AQP1 and absorbance units/mg creatinine for PLIN2) is shown for each of the 720 patients screened who also underwent abdominal CT (open circles), and the 19 patients with confirmed kidney cancer (clear cell or papillary subtypes) (filled circles). Three of the 720 screened patients (shaded circles) were subsequently found to have an imaged renal mass based on their CT. The dotted lines represents the cutoff values (52 ng/mg urine creatinine for AQP1 and 9.8 absorbance/mg urine creatinine for PLIN2) derived from the receiver operating characteristic analysis shown in Figure 4.
Of significant interest were three patients in the pool of 720 screened patients who had urine AQP1 and PLIN2 concentrations that clustered with those of the 19 with documented RCC (Figure 5). These three were not known a priori to have had a renal mass or kidney cancer. In a screening paradigm, based on the cut-off values, these would have been flagged as suspicious for kidney cancer and recommended for further evaluation. Indeed, when the CT exams of these patients were evaluated, and their charts reviewed, they were each found to have an imaged renal mass. Two patients subsequently underwent partial nephrectomy and were post-surgically diagnosed with grade 2, stage T1a clear cell carcinomas. The third patient died before any further evaluation and diagnosis were available. The urine biomarker concentrations for these three incidentally discovered patients were 145 (135, 253) for AQP1 and 29 (27, 56) for PLIN2. Adding the urine biomarker concentrations of these three patients to the Spearman regression analysis (open circles, eFigures 2A and 2B), did not change the correlations.
Also of significant interest were the biomarker concentrations of16 patients initially identified with indeterminate renal CT lesions (neither clearly normal nor clearly suspicious for RCC) based on the single phase screening CT. Their median AQP1 and PLIN2 concentrations were 1(0, 48) and 0(0, 0.3), respectively. These were significantly less than the median concentration of the 3 incidentally discovered patients described above (P=0.006 for AQP1 and P<0.001 for PLIN2) and were statistically indistinguishable from biomarker concentrations of the screening patients with no cancer history (P=0.366 for AQP1 and P=0.306 for PLIN2) or the patients with a cancer history (P=0.539 for AQP1 and P=0.223 for PLIN2). In a differential diagnosis paradigm, based on AQP1 and PLIN2, the 16 patients with indeterminate renal lesions would have been considered not to have cancer. They were subsequently diagnosed with non-cancerous hemorrhagic cysts based on follow-up multi-phase CT, MRI or ultrasound.
DISCUSSION
This investigation was designed to evaluate the clinical utility of the urine biomarkers AQP1 and PLIN2 to potentially diagnose patients with clear cell and papillary RCC, thus satisfying phase 3 of cancer biomarker development.24 The major findings indicate that these two biomarkers had favorable sensitivity and specificity. In RCC patients compared with normal healthy individuals, for both biomarkers, sensitivity was 100% and 100%, the specificity was 100% and 98%, and the AROC was 1.00 and 0.99 for AQP1 and PLIN2, respectively. In RCC patients compared with a heterogeneous population of patients, both with and without a (non-kidney) cancer history, sensitivity was 85-92% and specificity was 87-100% for both biomarkers, and the AROC was 0.95 and 0.91 for AQP1 and PLIN2, respectively. While not an independent validation cohort, an internal validation by Monte Carlo data resampling found AROCs of 0.95 and 0.92 for AQP1 and PLIN2, respectively. Therefore the overall high degree of sensitivity and specificity establishes the clinical validity 24,26 of these biomarkers.
AQP1 and PLIN2 were normalized to creatinine excretion, a common approach to standardize urine analyte reporting. No significant differences in results or conclusions were observed between normalized and non-normalized results, although normalization to creatinine is the standard means of expressing excretion of analytes in urine to minimize the impact of hydration status from patient to patient or in the same patient over time.27
A major difference between this and our previous investigations was the prospective nature of the present design. In previous studies, (encompassing phases 1 and 2 of cancer biomarker development) which retrospectively studied populations known a priori to have specific diseases (although all samples were analyzed in a blinded and coded fashion), the sensitivity of urine AQP1 concentrations to differentiate patients with RCC from various common renal diseases,20 non-renal urologic cancers23 and non-RCC renal masses23 ranged from 93 to 100%, and specificities ranged from 94 to 100% with AROCs ranging from 0.96 to 1.00. The sensitivity of urine PLIN2 concentrations to differentiate patients with RCC from various common renal diseases,20 non-renal urologic cancers 23 and non-RCC renal masses 23 ranged from 91 to 100%, specificities were 88 to 100% and AROCs were 0.91 to 1.00. Another major difference between this and our previous investigations was the size of the comparator cohorts consisting of only 18-47 patients in the different studies. Thus, this present prospective, larger scale investigation replicated the sensitivities and specificities observed previously in retrospective, smaller cohort studies.
The specificity of urine AQP1 and PLIN2 for clear cell or papillary RCC, seen previously, is further expanded by the present results. AQP1 and PLIN2 were significantly higher in patients with RCC than in patients with common non-cancer kidney disease 20 (diabetic nephropathy, glomerulonephritis, urine tract infection), or in patients with non-renal urinary tract cancers 23 (bladder and prostate). This investigation showed that urine AQP1 and PLIN2 concentrations in patients with RCC were also significantly higher than that in patients with lung, prostate, colorectal, gastrointestinal, uterine, ovarian, pancreatic, lymphoma, or breast cancer.
The prospective nature of this investigation also enabled testing the predictive value of AQP1 and PLIN2. Based on a historical institutional incidental discovery rate of two per 1,000 patients with an imaged renal mass, one-two patients with an incidental renal mass subsequently diagnosed with RCC were anticipated in the screening protocol. The investigation did identify three of 720 patients who had abnormal renal cancer biomarkers. These three patients were subsequently found to have an imaged renal mass suspicious for RCC on CT exam. Two of these patients were found to have pathologically-confirmed clear cell carcinoma after undergoing nephrectomy (while the third died before further evaluation). This prospective use of AQP1 and PLIN2 to screen populations for and identify RCC presages a potential clinical use of these biomarkers. Both comparator populations of healthy volunteers and patients were representative of populations which might be screened for RCC using these biomarkers. Thus a major implication of this investigation is that wider application of AQP1 and PLIN2 might be suitable for population screening for RCC.
A second major implication of this investigation, supported by the clinical validation of AQP1 and PLIN2, is their potential use in differential diagnosis of imaged renal masses, specifically to differentiate clear cell or papillary RCC from other imaged renal masses such as non-malignant oncocytomas, angiomyolipomas, or radiologically indeterminate lesions.23 Although approximately two-thirds of imaged renal masses are clear cell RCC, approximately 15-20% of imaged masses are benign.28-30 Imaging alone may struggle to distinguish benign lesions such as oncocytomas and relatively lipid-poor angiomyolipomas from renal cell carcinoma.14-19,28-30 Since the common clinical approach to an imaged renal mass is partial or total nephrectomy,8,9,11-13,18 this may result in unnecessary partial or total renal excision.8,28-30 Indeed, in one study, about a third of patients with a benign tumor underwent a radical nephrectomy.29 One approach to differential diagnosis of imaged renal masses is renal biopsy,16,29,30 however, only about 80% of renal mass biopsies are of diagnostic value while the remaining 20% are non-diagnostic.16,29 Moreover, renal biopsy is invasive with potential for complications. In contrast, the sensitivity and specificity of AQP1 and PLIN2 for RCC versus other renal masses demonstrates their analytical and clinical validity, potential superiority compared with renal biopsy, and potential application in the differential diagnosis and further evaluation of incidentally identified imaged renal masses. As exemplified in this investigation, AQP1 and PLIN2 might obviate the need for follow-up multi-phase CT, MRI or ultrasound, or even surgical removal, of indeterminate renal CT lesions. In addition bladder, prostate and renal cancers have in common hematuria as a presenting sign, as do other non-cancerous urinary tract diseases, and AQP1 and PLIN2 may be useful in differentiating RCC from other diseases causing hematuria. Thus, AQP1 and PLIN2 have potential application in differential diagnosis of imaged renal masses, further differentiation of radiologically indeterminate lesions, and the potential to obviate removal of a non-cancerous kidney.
There are some caveats to the present investigation. The cumbersome nature of Western blotting precludes application of PLIN2 to large scale investigations or clinical implementation for renal cancer screening. Development of a sensitive and specific ELISA in urine for PLIN2 will increase assay efficiency and enable widespread implementation. In contrast, the method for AQP1 is an ELISA, and is presently applicable for screening and diagnosis. A second consideration is that while urine AQP1 and PLIN2 detect clear cell and papillary RCC, the chromophobe subtype of RCC is not detected by these biomarkers.20,21,23 However, this subtype accounts for only about 5% of RCC, while clear cell and papillary cancer together account for almost 90%. A third consideration is that the screened patient population was heavily skewed towards those with a variety of (non-renal) cancers (386 of the 720 patients). This may account for the higher background levels of urine AQP1 (Figures 3A, 4A and eFigure 1A) compared to the smaller cohort (18-44 patients each study) of comparator groups (common non-cancerous kidney diseases, bladder and prostate cancer, non-cancerous imaged renal masses) in our previous studies.20,21,23 Further improvements in the AQP1 ELISA may potentially reduce this background. PLIN2 concentrations in the screened patients (Figures 3B, 5B and eFigure1B) were generally lower, and the 3 highest concentrations were in those patients incidentally discovered to have an CT imaged renal mass. Therefore, at present it appears optimal to measure both AQP1 and PLIN2 in urine for identifying patients with clear cell or papillary RCC.
This investigation supports the ability of urine AQP1 and PLIN2 concentrations to diagnose patients with occult RCC in a screening protocol. Overall, it validates the clinical utility of urine AQP1 and PLIN2 as biomarkers with applicability for early and non-invasive detection and screening for RCC satisfying phase 3 of cancer biomarker discovery. In addition, urine AQP1 and PLIN2 have potential application for differential diagnosis of imaged renal masses.
Supplementary Material
ACKNOWLEDGEMENTS
The authors thank Marilee Fisher, B.A., Jay McQuillan, B.S., Jane Blood, B.S, R.N., Jeanine Wade, R.T.R. and Ruth Holdener, R.T.R. (CT) and (M) for their expert help in the study. Careful review of the manuscript and thoughtful input by Dr, Graham Colditz is gratefully appreciated.
The authors utilized the Biostatistics and the Imaging and Response Assessment Cores of the Siteman Cancer Center under NCI Cancer Center Support P30 CA91842. Washington University has a European Patent on the use of urine AQP1 to diagnose renal cancer.
Support was provided by the Barnes-Jewish Hospital Frontier Fund and the Department of Anesthesiology, Washington University in St. Louis School of Medicine. Additional support was provided by the Bear Cub Fund of Washington University, a grant from the Barnes-Jewish Hospital Foundation as a sub award of Washington University Institute of Clinical and Translational Science UL1 TR000448, and a grant from the National Cancer, Institute R01CA141521 each to JJM, and the Department of Urology, Washington University School of Medicine.
Washington University in St. Louis has a European patent for the use of AQP1 to diagnose kidney cancer.
Footnotes
Trial Registration: clinical trials.gov Identifier: NCT00851994.
REFERENCES
- 1.Chow WH, Devesa SS, Warren JL, Fraumeni JF., Jr. Rising incidence of renal cell cancer in the United States. JAMA : the journal of the American Medical Association. 1999 May 5;281(17):1628–1631. doi: 10.1001/jama.281.17.1628. [DOI] [PubMed] [Google Scholar]
- 2.Decastro GJ, McKiernan JM. Epidemiology, clinical staging, and presentation of renal cell carcinoma. The Urologic clinics of North America. 2008 Nov;35(4):581–592. doi: 10.1016/j.ucl.2008.07.005. vi. [DOI] [PubMed] [Google Scholar]
- 3.Nepple KG, Yang L, Grubb RL, 3rd, Strope SA. Population based analysis of the increasing incidence of kidney cancer in the United States: evaluation of age specific trends from 1975 to 2006. The Journal of urology. 2012 Jan;187(1):32–38. doi: 10.1016/j.juro.2011.09.028. [DOI] [PubMed] [Google Scholar]
- 4.Pantuck AJ, Zisman A, Belldegrun AS. The changing natural history of renal cell carcinoma. The Journal of urology. 2001 Nov;166(5):1611–1623. [PubMed] [Google Scholar]
- 5.Siegel R, Naishadham D, Jemal A. Cancer statistics, 2012. CA: a cancer journal for clinicians. 2012 Jan-Feb;62(1):10–29. doi: 10.3322/caac.20138. [DOI] [PubMed] [Google Scholar]
- 6.Frank I, Blute ML, Cheville JC, Lohse CM, Weaver AL, Zincke H. Solid renal tumors: an analysis of pathological features related to tumor size. The Journal of urology. 2003 Dec;170(6):2217–2220. doi: 10.1097/01.ju.0000095475.12515.5e. Pt 1. [DOI] [PubMed] [Google Scholar]
- 7.Lee CT, Katz J, Shi W, Thaler HT, Reuter VE, Russo P. Surgical management of renal tumors 4 cm. or less in a contemporary cohort. The Journal of urology. 2000 Mar;163(3):730–736. [PubMed] [Google Scholar]
- 8.Karakiewicz PI, Trinh QD, Bhojani N, et al. Renal cell carcinoma with nodal metastases in the absence of distant metastatic disease: prognostic indicators of disease-specific survival. European urology. 2007 Jun;51(6):1616–1624. doi: 10.1016/j.eururo.2006.12.015. [DOI] [PubMed] [Google Scholar]
- 9.Rini BI, Campbell SC, Escudier B. Renal cell carcinoma. Lancet. 2009 Mar 28;373(9669):1119–1132. doi: 10.1016/S0140-6736(09)60229-4. [DOI] [PubMed] [Google Scholar]
- 10.Steffens S, Junker K, Roos FC, et al. Small renal cell carcinomas--how dangerous are they really? Results of a large multicenter study. European journal of cancer. 2014 Mar;50(4):739–745. doi: 10.1016/j.ejca.2013.11.020. [DOI] [PubMed] [Google Scholar]
- 11.Huang WC, Elkin EB, Levey AS, Jang TL, Russo P. Partial nephrectomy versus radical nephrectomy in patients with small renal tumors--is there a difference in mortality and cardiovascular outcomes? The Journal of urology. 2009 Jan;181(1):55–61. doi: 10.1016/j.juro.2008.09.017. discussion 61-52. [DOI] [PMC free article] [PubMed] [Google Scholar]
- 12.Pettus JA, Jang TL, Thompson RH, Yossepowitch O, Kagiwada M, Russo P. Effect of baseline glomerular filtration rate on survival in patients undergoing partial or radical nephrectomy for renal cortical tumors. Mayo Clinic proceedings. Mayo Clinic. 2008 Oct;83(10):1101–1106. doi: 10.4065/83.10.1101. [DOI] [PMC free article] [PubMed] [Google Scholar]
- 13.Peycelon M, Hupertan V, Comperat E, et al. Long-term outcomes after nephron sparing surgery for renal cell carcinoma larger than 4 cm. The Journal of urology. 2009 Jan;181(1):35–41. doi: 10.1016/j.juro.2008.09.025. [DOI] [PubMed] [Google Scholar]
- 14.Akdogan B, Gudeloglu A, Inci K, Gunay LM, Koni A, Ozen H. Prevalence and predictors of benign lesions in renal masses smaller than 7 cm presumed to be renal cell carcinoma. Clinical genitourinary cancer. 2012 Jun;10(2):121–125. doi: 10.1016/j.clgc.2012.01.005. [DOI] [PubMed] [Google Scholar]
- 15.Halverson SJ, Kunju LP, Bhalla R, et al. Accuracy of determining small renal mass management with risk stratified biopsies: confirmation by final pathology. The Journal of urology. 2013 Feb;189(2):441–446. doi: 10.1016/j.juro.2012.09.032. [DOI] [PubMed] [Google Scholar]
- 16.Lim A, O'Neil B, Heilbrun ME, Dechet C, Lowrance WT. The contemporary role of renal mass biopsy in the management of small renal tumors. Frontiers in oncology. 2012;2:106. doi: 10.3389/fonc.2012.00106. [DOI] [PMC free article] [PubMed] [Google Scholar]
- 17.Menogue SR, O'Brien BA, Brown AL, Cohen RJ. Percutaneous core biopsy of small renal mass lesions: a diagnostic tool to better stratify patients for surgical intervention. BJU international. 2013 Apr;111(4 Pt B):E146–151. doi: 10.1111/j.1464-410X.2012.11384.x. [DOI] [PubMed] [Google Scholar]
- 18.Russo P, Huang W. The medical and oncological rationale for partial nephrectomy for the treatment of T1 renal cortical tumors. The Urologic clinics of North America. 2008;35(4):635–643. doi: 10.1016/j.ucl.2008.07.008. vii. [DOI] [PubMed] [Google Scholar]
- 19.Wang R, Wolf JS, Jr., Wood DP, Jr., Higgins EJ, Hafez KS. Accuracy of percutaneous core biopsy in management of small renal masses. Urology. 2009 Mar;73(3):586–590. doi: 10.1016/j.urology.2008.08.519. discussion 590-581. [DOI] [PubMed] [Google Scholar]
- 20.Morrissey JJ, Kharasch ED. The specificity of urinary aquaporin 1 and perilipin 2 to screen for renal cell carcinoma. The Journal of urology. 2013 May;189(5):1913–1920. doi: 10.1016/j.juro.2012.11.034. [DOI] [PMC free article] [PubMed] [Google Scholar]
- 21.Morrissey JJ, London AN, Luo J, Kharasch ED. Urinary biomarkers for the early diagnosis of kidney cancer. Mayo Clinic proceedings. Mayo Clinic. 2010 May;85(5):413–421. doi: 10.4065/mcp.2009.0709. [DOI] [PMC free article] [PubMed] [Google Scholar]
- 22.Morrissey JJ, Mobley J, Song J, et al. Urinary concentrations of aquaporin-1 and perilipin-2 in patients with renal cell carcinoma correlate with tumor size and stage but not grade. Urology. Jan 2014;83(1):256 e259–214. doi: 10.1016/j.urology.2013.09.026. [DOI] [PMC free article] [PubMed] [Google Scholar]
- 23.Morrissey JJMJ, Figenshau RS, Vetter J, Bhayani S, Kharasch ED. Urine Aquaporin 1 and Perilipin 2 Differentiate Renal Carcinomas from Other Imaged Renal Masses and Bladder and Prostate Cancer. Mayo Clinic Proceedings. 2014 doi: 10.1016/j.mayocp.2014.10.005. [DOI] [PMC free article] [PubMed] [Google Scholar]
- 24.Pepe MS, Etzioni R, Feng Z, et al. Phases of biomarker development for early detection of cancer. Journal of the National Cancer Institute. 2001 Jul 18;93(14):1054–1061. doi: 10.1093/jnci/93.14.1054. [DOI] [PubMed] [Google Scholar]
- 25.Hajian-Tilaki KO, Hanley JA, Joseph L, Collet JP. A comparison of parametric and nonparametric approaches to ROC analysis of quantitative diagnostic tests. Medical decision making : an international journal of the Society for Medical Decision Making. 1997 Jan-Mar;17(1):94–102. doi: 10.1177/0272989X9701700111. [DOI] [PubMed] [Google Scholar]
- 26.Parkinson DR, McCormack RT, Keating SM, et al. Evidence of clinical utility: an unmet need in molecular diagnostics for patients with cancer. Clinical cancer research : an official journal of the American Association for Cancer Research. 2014 Mar 15;20(6):1428–1444. doi: 10.1158/1078-0432.CCR-13-2961. [DOI] [PubMed] [Google Scholar]
- 27.McMahon GM, Waikar SS. Biomarkers in nephrology: Core Curriculum 2013. American journal of kidney diseases : the official journal of the National Kidney Foundation. 2013 Jul;62(1):165–178. doi: 10.1053/j.ajkd.2012.12.022. [DOI] [PMC free article] [PubMed] [Google Scholar]
- 28.Caoili EM, Davenport MS. Role of Percutaneous Needle Biopsy for Renal Masses. Seminars in interventional radiology. 2014 Mar;31(1):20–26. doi: 10.1055/s-0033-1363839. [DOI] [PMC free article] [PubMed] [Google Scholar]
- 29.Leppert JT, Hanley J, Wagner TH, et al. Utilization of renal mass biopsy in patients with renal cell carcinoma. Urology. 2014 Apr;83(4):774–779. doi: 10.1016/j.urology.2013.10.073. [DOI] [PMC free article] [PubMed] [Google Scholar]
- 30.Leveridge MJ, Finelli A, Kachura JR, et al. Outcomes of small renal mass needle core biopsy, nondiagnostic percutaneous biopsy, and the role of repeat biopsy. European urology. 2011 Sep;60(3):578–584. doi: 10.1016/j.eururo.2011.06.021. [DOI] [PubMed] [Google Scholar]
- 31.Morrissey JJ, London AN, Lambert MC, Kharasch ED. Sensitivity and specificity of urinary neutrophil gelatinase-associated lipocalin and kidney injury molecule-1 for the diagnosis of renal cell carcinoma. American journal of nephrology. 2011;34(5):391–398. doi: 10.1159/000330851. [DOI] [PubMed] [Google Scholar]
Associated Data
This section collects any data citations, data availability statements, or supplementary materials included in this article.


