Abstract
In photosystem II (PSII), the Mn4CaO5 cluster catalyses the water splitting reaction. The crystal structure of PSII shows the presence of a hydrogen-bonded water molecule directly linked to O4. Here we show the detailed properties of the H-bonds associated with the Mn4CaO5 cluster using a quantum mechanical/molecular mechanical approach. When O4 is taken as a μ-hydroxo bridge acting as a hydrogen-bond donor to water539 (W539), the S0 redox state best describes the unusually short O4–OW539 distance (2.5 Å) seen in the crystal structure. We find that in S1, O4 easily releases the proton into a chain of eight strongly hydrogen-bonded water molecules. The corresponding hydrogen-bond network is absent for O5 in S1. The present study suggests that the O4-water chain could facilitate the initial deprotonation event in PSII. This unexpected insight is likely to be of real relevance to mechanistic models for water oxidation.
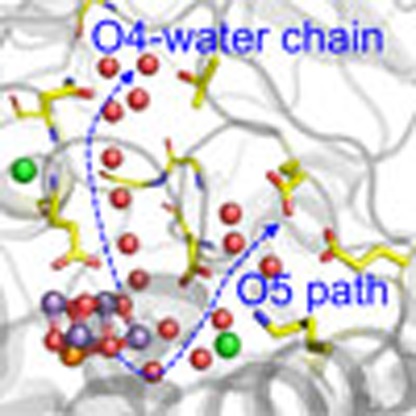 The availability of crystal structures of photosystem II opens up the possibility of gaining insights into its mechanism. Here, the authors use a computational approach and propose a deprotonation event at O4 followed by long-range proton-transfer along a chain of strongly bonded water molecules.
The core of the photosystem II (PSII) reaction center is composed of D1/D2, a heterodimer of protein subunits that contains the cofactors involved in photochemical charge separation, quinone reduction and water oxidation. In PSII, the Mn4CaO5 cluster catalyses the water splitting reaction: 2H2O→O2+4H++4e– (reviewed in refs 1, 2). The release of protons has been observed in response to changes in the oxidation state (the Sn state, where the subscript represents the number of oxidation steps accumulated) of the oxygen-evolving complex and occurs with a typical stoichiometry of 1:0:1:2 for the S0→S1→S2→S3→S0 transitions, respectively (for example, refs 3, 4). Although the relevant pathway for proton transfer (PT) in each S-state transition is not yet clear, PT may proceed via different pathways in the PSII protein, depending on the S-state transition5,6,7. Candidates for the relevant PT pathways have been reviewed recently7,8,9,10,11,12 and site-directed mutagenesis studies are testing the various possibilities13.
The majority view in the current literature is that the best resolved X-ray crystal structure (1.9 Å) of the Mn4CaO5 cluster14 represents an over-reduced form due to its reduction by the X-ray beam (for example, ref. 1 but see also for example, ref. 15 for an alternative explanation). This was suggested to explain the elongation of Mn–Mn and Mn–O distances compared with those obtained from extended X-ray absorption fine structure (EXAFS; for example, refs 16, 17, 18, 19, 20, 21). Detailed oxidation states of the 1.9-Å crystal structure are discussed in recent theoretical studies (see ref. 22 and references therein). Electron spin echo envelope modulation (ESSEM) and electron-nuclear double resonance (ENDOR) studies have suggested that all of the μ-oxo bridges of the Mn4CaO5 cluster are deprotonated in the S2 state, and that the water molecules, W1 and W2, bound to Mn4 are H2O or OH– (refs 23, 24). Because proton release is not observed in the S1–S2 transition, the ESEEM and ENDOR data thus imply that the μ-oxo bridges of the Mn4CaO5 cluster are already deprotonated in S1 (refs 16, 19, 20, 21, 25). The 1.9-Å structure revealed that two water molecules, W1 and W2, were ligands to the Mn4 atom of the Mn4CaO5 cluster, and two waters, W3 and W4, were ligands to the Ca atom14. W3 has been proposed as a candidate deprotonation site because it is one of the closest water molecules to the redox active TyrZ14 and because the W3–Sr bond in the Mn4SrO5 cluster was specifically longer compared to that in the Mn4CaO5 cluster26. All of these bound water molecules are candidates not only as potential substrates for water oxidation (for example, refs 14, 27, 28, 29, 30, 31, 32) but also as ionizable groups that could undergo deprotonation during the enzyme cycle in which positive charge equivalents are accumulated21.
In recent experimental (for example, ref. 33) and theoretical studies (for example, refs 34, 35) it has been proposed that the proton released on the S0–S1 transition involves hydroxyl form of O5, an oxygen atom that occupies one of the corners of the cubane, linking the Ca, Mn3 and Mn1 and connecting the cubane to Mn4. Recently however, in the radiation-damage-free PSII crystal structure obtained using the X-ray free electron laser, which is assumed to be in the S1 state, Suga et al.36 proposed that O5 is a hydroxide ion in S1. This was based on the observation of significantly long distances between O5 and the adjacent Mn ions36. This would be conflict with the already deprotonated μ-oxo bridges in S1 suggested from the ESEEM and ENDOR data19,20,21. Recent report comparing published quantum mechanical/molecular mechanical (QM/MM) data and EXAFS data37 with the free electron laser structure36 suggested that the crystals used for this study could contain significant amount of the reduced S0 state38. Notably, the activation energy is specifically low in the S0–S1 transition, and can be rationalized as a rate-limiting electron transfer followed by a deprotonation step21.
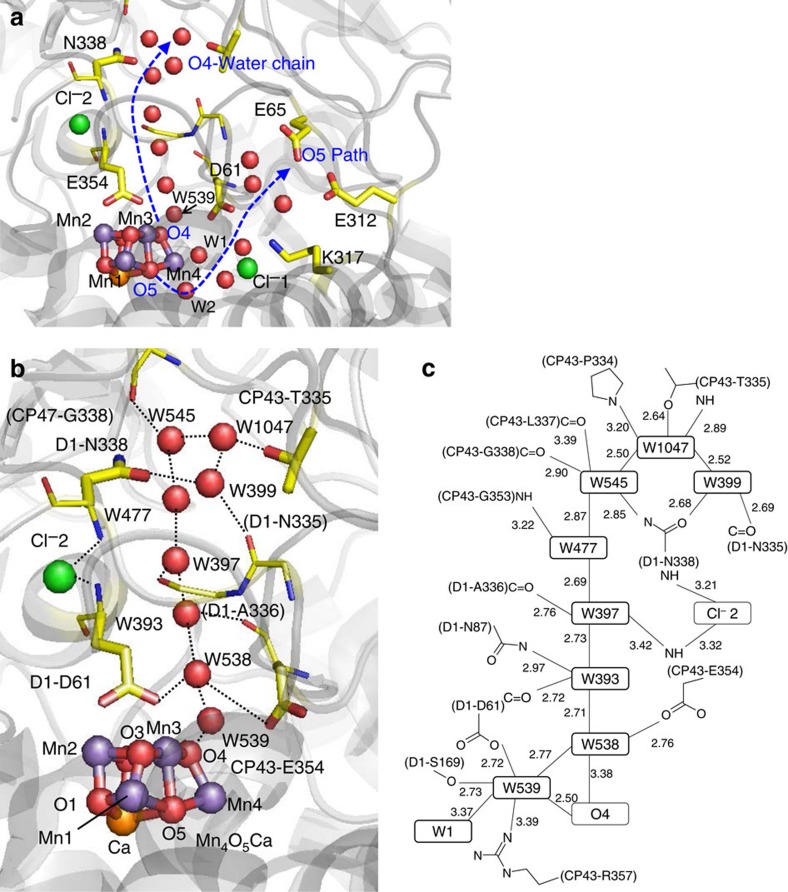
The 1.9-Å structure shows the presence of a chain of strongly H-bonded eight-water molecules (O4-water chain) directly linked to O4 (linking Mn4 and Mn3 in the Mn3CaO4-cubane), whereas O5 has no direct-H-bond partner14. As far as we are aware, none of the QM/MM studies have considered the O4-water chain explicitly. In the 1.9-Å structure, the water molecule W539 (B-factor: monomer A=23.9, monomer B=25.2) is situated near the O4 atom of the Mn4CaO5 cluster14. Remarkably, the H-bond between O4 and W539 (O4–OW539) is unusually short (∼2.5 Å) in comparison with typical O–O distances of ∼2.8 Å for standard (asymmetric) H-bonds in H2O (refs 39, 40), even if we consider the uncertainty of ∼0.16 Å in the measured distances within the 1.9-Å structure14. Notably, ‘single-well H-bonds' are very short and typically have O–O distances of 2.4–2.5 Å (refs 41, 42). This results in an essentially barrier-less potential between the H-bond donor and acceptor moieties. The appearance of single-well H-bonds in protein environments is often associated with PT events43,44,45.
Here we look for short H-bonds in the environment of the Mn4CaO5 complex and investigate their significance in energy terms by adopting a large-scale QM/MM approach based on the crystal structure analysed at 1.9 Å resolution14.
Results
A short H-bond between O4 and W539
The O4–OW539 bond is unusually short in the original 1.9-Å structure (2.50 Å, Fig. 1)14. When an H-bond is assumed for the O4–OW539 bond, two H-bond patterns are possible. Case 1: the H atom is from O4, an OH– moiety, so that the bond can be written O4–H…OW539. Case 2: the H atom is from the water, W539, so that O4 is O2– and the bond can be written as O4…H–OW539 (Supplementary Fig. 1). Using these two cases, we investigated whether formation of the short H-bond between O4 and W539 is energetically possible in the S–1 to S1 states of the high oxidation state model. In the low oxidation state model these Mn valence states correspond to the S1–S3 states15 and this option was also investigated (Table 1), however in the present study, if not otherwise specified, the S-states given refer to the high oxidation state model. For discussions of the Mn oxidation state of the low oxidation state model46, see Supplementary Discussion.
Figure 1. H-bond networks near the Mn4CaO5 cluster.
(a) Overview. The O4-water chain is the H-bond network directly linked to the Mn4CaO5 cluster (O4–OW539=2.50 Å). The O5 path is not directly H-bonded to the Mn4CaO5 cluster (O5–OW2=3.08 Å). (b) The water chain linked to O4 of the Mn4CaO5 cluster in the 1.9-Å structure14. Water molecules (red), Cl−2 (green) and Mn4CaO5 (purple, orange, and red for Mn, Ca, and O atoms, respectively) are depicted as balls. H-bonds or ionic interactions are represented by dotted lines. (c) H-bond distances in the water chain (Å).
Table 1. H-bond geometries (in Ångstroms) of the O4 site.
| pre-PT (O4=OH−) | post-PT (O4=O2−) | ||||||
|---|---|---|---|---|---|---|---|
| High (low)* | S1 (S3) | S0 (S2) | S−1 (S1) | S1 (S3) | S0 (S2) | S−1 (S1) | |
| Mn1–4 | X-ray | III, IV, IV, III | III, IV, III, III | III, III, IV, II | III, IV, IV, III | III, IV, III, III | III, III, IV, II |
| O4–539 | 2.50 | 2.45 | 2.55 | 2.64 | 2.58 | 2.57 | 2.49 |
| 539–538 | 2.77 | 2.55 | 2.59 | 2.61 | 2.78 | 2.72 | 2.76 |
| 538–393 | 2.71 | 2.60 | 2.64 | 2.66 | 2.70 | 2.68 | 2.65 |
| 393–397 | 2.73 | 2.62 | 2.64 | 2.67 | 2.75 | 2.72 | 2.71 |
| 397–477 | 2.69 | 2.83 | 2.83 | 2.87 | 2.68 | 2.66 | 2.64 |
| 477–545† | 2.87 | 2.72 | 2.71 | 2.71 | 2.71 | 2.70 | 2.69 |
| 545–1047 | 2.50 | 2.61 | 2.61 | 2.60 | 2.66 | 2.66 | 2.66 |
| 1047–399 | 2.52 | 2.71 | 2.70 | 2.68 | 2.53 | 2.54 | 2.56 |
| RMSD: Mn4Ca | 0.11 | 0.20 | 0.18 | 0.16 | 0.24 | 0.16 | |
| RMSD: Mn4CaO5 | 0.27 | 0.31 | 0.30 | 0.30 | 0.30 | 0.30 |
RMSD, root-mean-square deviation.
*High oxidation state model in normal script (low oxidation state model in italics and parenthesis15).
†The large deviation of the W477–W545 length from the 1.9-Å structure14 originates from the poorer density specifically for W477 in the crystal (Supplementary Fig. 8). In the O4-water chain, W477 is the only water molecule that does not donate an H-bond to a backbone C=O but accepts an H-bond from the backbone NH of CP43-G353 (Fig. 1) and this seems to be associated with the greater disorder.
O5=O2−; O4=OH– in pre-PT and O2− in post-PT. RMSD of the optimized heavy atoms with respect to those of the 1.9-Å structure. Short H-bond distances (< ∼2.5 Å) are in bold.
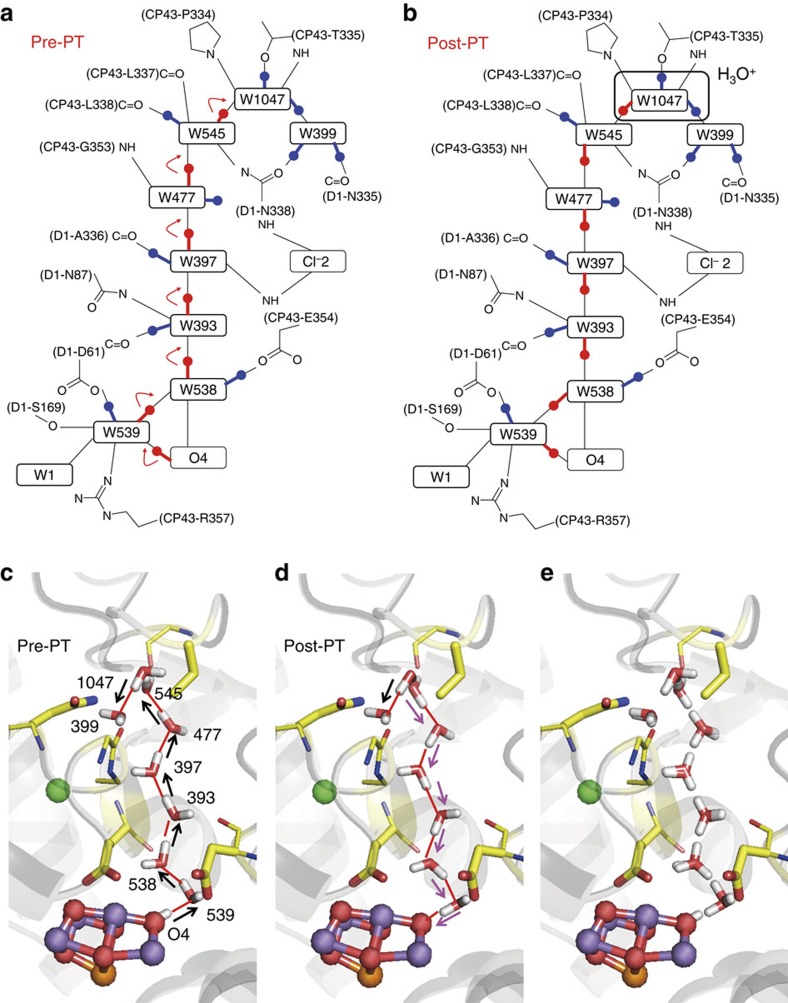
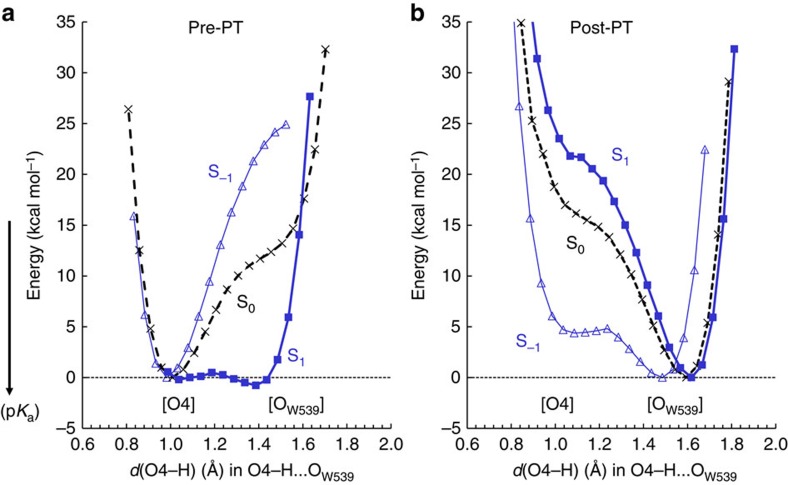
Case 1. O4 is an H-bond donor (O4=OH−) to W539 (“pre-PT” H-bond pattern). In S0 ((Mn1, Mn2, Mn3, Mn4)=(III, IV, III, III)), QM/MM calculations reproduced a short H-bond distance of ∼2.5 Å (2.55 Å, Table 1) for O4–OW539 only when O4 was OH– and donated an H-bond to W539 (‘pre-PT' pattern in Fig. 2; Table 1). In S1, the energy profile of the O4–OW539 bond (Fig. 3a) resembles an energetically unstable single-well H-bond (Supplementary Fig. 2). These results indicate that matching of the pKa values of the donor (that is, O4, Supplementary Fig. 1) and acceptor (that is, W539) moieties occurs in S1. Due to the presence of the single-well H-bond (for example, ref. 47), the ‘pre-PT' H-bond pattern (Fig. 2) was energetically unstable in S1 (discussed later). Note that a single-well H-bond has its energy minimum only at the O–O distance of ∼2.5 Å (for example, not 2.6 or 2.7 Å (ref. 43)).
Figure 2. H-bond pattern change of the entire water chain induced by a release of a proton from O4.
(a,b) The two H-bond patterns (pre- and post-PT) possess the same net charge and the same number of H atoms. Altered and unaltered H-bonds are indicated by red and blue lines and balls, respectively. (c) QM/MM optimized geometries in the pre-PT, (d) post-PT and (e) both conformations. Initial donor-to-acceptor orientations are indicated by black arrows, whereas altered donor-to-acceptor orientations in the post-PT conformation are indicated by magenta arrows.
Figure 3. The energy profiles along the PT coordinate for the O4–OW539 bond.
(a) pre-PT and (b) post-PT in S1 (blue solid curve), S0 (black dotted curve) and S−1 (blue thin solid curve). For comparison, the energy minimum in the O4 moiety was set to zero for all S states.
Case 2. W539 is an H bond donor to O4 (O4=O2−) (“post-PT” H-bond pattern). In the over-reduced state, S–1, QM/MM calculations also reproduced the short H-bond distance of ∼2.5 Å for O4–OW539 (Table 1) but only when O4 was O2– and when it accepted an H-bond from W539 (‘post-PT' pattern in Fig. 2).
PT from OH– at O4 along the O4-water chain
In the QM/MM calculations, OH– at O4 was stable as an H-bond donor to W539 in S0 and lower S states (Fig. 3). However, in the S1 state, OH– at O4 was energetically unstable due to formation of the single-well H-bond, leading to the release of a proton from OH– at O4 and the formation of O2– at O4. Remarkably, the released proton was stabilized at W1047 in the form of H3O+, which is 13.5 Å away from O4 (Fig. 1). Overall, the pre-PT pattern (Fig. 2) in the initial state completely transformed into the post-PT pattern (Fig. 2) as a result of PT.
The short O4–OW539 in the pre-PT conformation lengthened to ∼2.58 Å in the post-PT pattern in S0 or S1 (Table 1) from 2.50 Å in the 1.9-Å structure. This longer H-bond in S0 or S1 is consistent with O4–OW539 distances of 2.59 Å in both PSII monomers in the recent radiation-damage-free PSII crystal structure obtained using the X-ray free electron laser (Supplementary Table 1)36. These results seem to correspond to a situation in which the free electron laser structure36 has the S0 or S1 state in which the O4 is deprotonated, while in the earlier conventional X-ray diffraction structure (1.9-Å structure)14 the Mn4CaO4 is in a more reduced state and exhibiting a single-well H-bond between O4 and OW539.
In the 1.9-Å structure, W1047 has unusually short H-bonds, OW1047–OW545 (2.50 Å) and OW1047–OW399 (2.52 Å)14. Intriguingly, the short O–O distances were reproduced only when we assumed the post-PT H-bond pattern of the O4-water chain (2.46–2.54 Å, Table 1 and Supplementary Table 2). In general, typical H2O…H3O+ (that is, the Zundel cation) has an unusually short O–O distance of ∼2.4 Å (refs 39, 40). Therefore, the short H-bond distances of W1047 in the 1.9-Å structure imply that W1047 is capable of forming H3O+. Remarkably, the X-ray free electron laser structure36 also has unusually short H-bonds at the corresponding positions (Supplementary Table 1), a further indication that the X-ray free electron laser structure represents the post-PT state. The presence of these single-well H-bonds indicates that local movement of a proton within the O4–OW539 bond of ∼2.5 Å results in a sequential downhill PT from O4 to W1047 over a distance of 13.5 Å (Fig. 2 and Supplementary Fig. 3).
A working model
The results indicate that PT occurs through the O4-water chain and thence towards the lumenal bulk surface via PsbU (Supplementary Discussion). This PT reaction is specifically associated with the S0–S1 transition. This is supported by the following arguments.
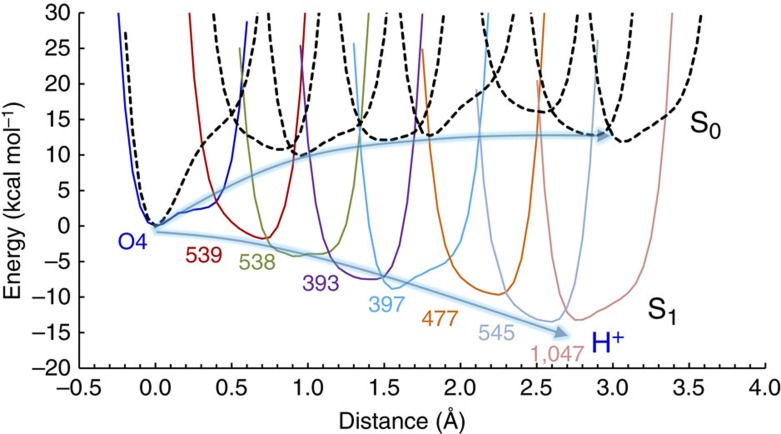
The O4-water chain is the H-bond network in the 1.9-Å structure14 that is directly linked with the O atoms of the Mn4CaO5 cluster (via the O4–OW539 bond). The energy barrier for PT along the O4–OW539 bond is clearly the lowest among all the possible Mn4CaO5 deprotonation sites in the 1.9-Å structure14. This should contribute to a smaller activation energy for deprotonation, a property consistent with the known characteristics of the S0–S1 transition, which includes its rate being insensitive to H2O/D2O exchange and its activation energy being low compared that of the S2–S3 transition21,48,49. In the energy profiles of the H-bonds studied here, a proton became energetically more stable as it moved away from Mn4CaO5, indicating that a downhill PT reaction occurs specifically on the S0–S1 transition (Fig. 4). The driving force for the PT towards the protein surface in S1 is attributed to the increased positive charge on Mn4CaO5 on the S0–S1 transition and this conclusion was supported by the observation that lower S-states resulted in the uphill PT reaction (Fig. 4 and Supplementary Fig. 4).
Figure 4. The energy profiles along the PT coordinate for all of the H-bonds along the O4-water chain in the pre-PT conformation; S1 (coloured solid curves) and S0 (black dotted curves).
For comparison, the energy minimum in the O4 moiety was set to zero for all S states. For efficient analysis, the small QM region was adopted. In QM/MM calculations the electrostatic interactions, which are calculated from parametrized partial atomic charge, are sometimes intentionally overestimated. The correct treatment of long-range electrostatics in QM/MM calculations is hard to achieve (see for example, ref. 69) and some improvements are in progress (for example, ref. 70). The present results are to be considered qualitatively.
The remarkable linear, eight-water molecular chain acting as Grotthuss-like proton conduit, which is reported here, might be expected to work with very fast kinetics. However, proton release on this step occurs relatively slowly (tens of microseconds21). This is easily understandable since the electron transfer step occurs before H+ release and is thus rate-limiting21.
Energetics of proton release from O5
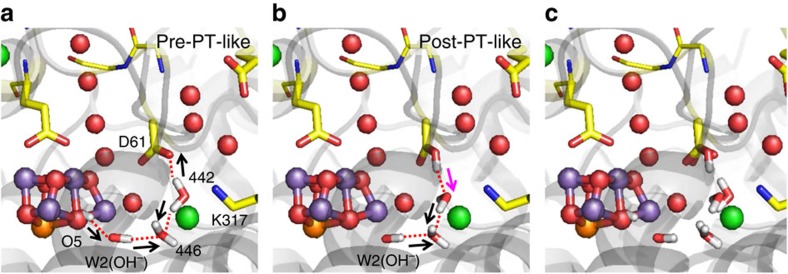
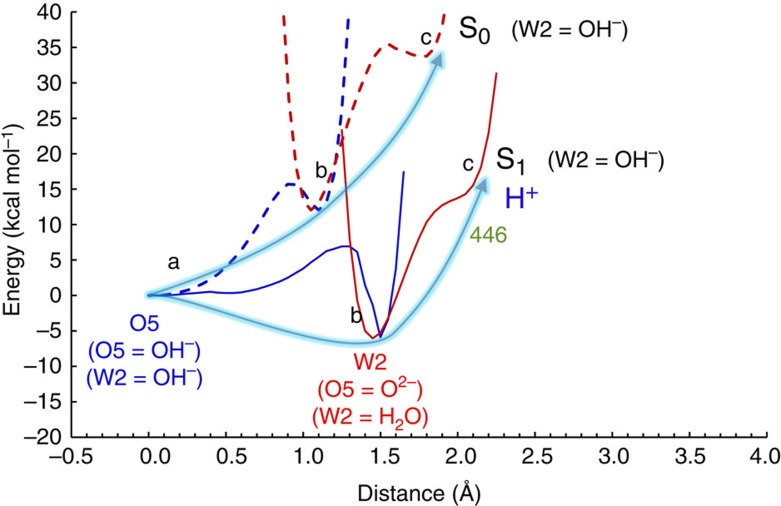
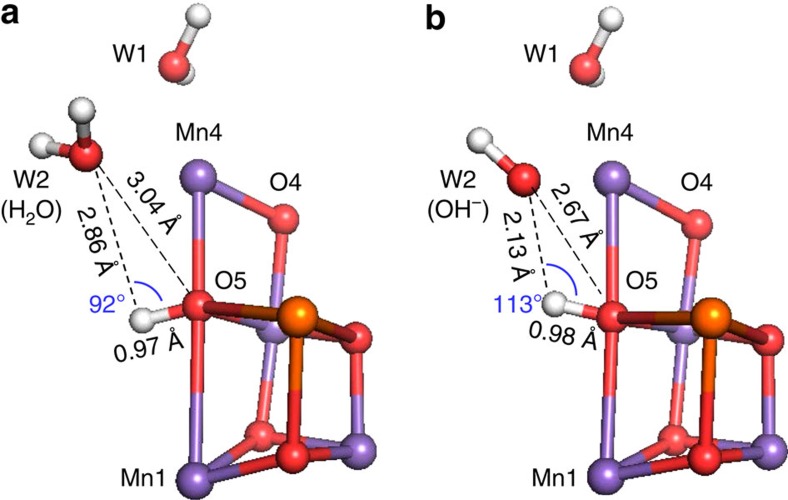
In the present work we also analysed the energy profiles of the PT along the O5 path that proceeds from O5 to D1-Asp61 via the water molecules, W2, W446 and W442 (Fig. 5). W2 is the only possible proton acceptor from OH– at O5 when the original geometry of the 1.9-Å (ref. 14) or X-ray free electron laser36 structure is maintained (see below and Supplementary Discussion). When OH– at W2 becomes H2O by accepting the proton from OH– at O5 (Fig. 6b and Supplementary Fig. 5b), W2 cannot release a proton easily to its H-bond acceptor W446 (Fig. 6b,c and Supplementary Fig. 5b,c, see Supplementary Discussion for details), thus causing a significant energy barrier for further PT (Fig. 6). Note that the PT from O5 to W2 is more unlikely when W2=H2O (Supplementary Fig. 6) due to the even less appropriate H-bond angle for O5…W2 (Fig. 7).
Figure 5. QM/MM optimized geometries.
(a) pre-PT-like, (b) post-PT-like and (c) both conformations. Initial donor-to-acceptor orientations are indicated by black arrows, whereas altered donor-to-acceptor orientations in the post-PT conformation are indicated by magenta arrows.
Figure 6. The energy profiles along the PT coordinate for all of the H-bonds along the O5 path.
In the pre-PT conformation; S1 (solid curves) and S0 (dotted curves) for W2=OH− (see Supplementary Fig. 6 for W2=H2O). For comparison, the energy minimum in the O5 moiety was set to zero for all S states. Labels a–c correspond to the states in Supplementary Fig. 5a–c, respectively.
Figure 7. H-bond patterns of the O5 and W2 moiety in the QM/MM geometry.
(a) W2=H2O and (b) W2=OH−. For clarity, only the Mn4CaO5 cluster, W1, and W2 are shown.
For a PT, formation of a proton conducting wire (that is, proton donor and acceptor pairs), which is itself an activated process, must occur first50. The activation-less ‘pre-organized' proton conducting wire possesses well-arranged water groups along the O4-water chain (Fig. 2e) and appears to be achieved by the ‘pre-organized protein dipole51' of PSII. A corresponding feature is absent (for example, a partial H-bond network) in the O5 path (Fig. 5), suggesting that a sequential downhill PT from O5 is unlikely. It seems clear that deprotonation of a putative OH– at O5 is less likely than OH– at O4. The activation barrier of the O5 path appears to remain high in S1 (Fig. 6); it might be possible however that this path becomes active in proton conduction in higher S states.
Alternative O5 deprotonation models
Although some studies have suggested or assumed that O5 (=OH–) deprotonation occurs on the S0–S1 transition33,34,35, it should also be noted that O5 has no direct-H-bond partner in the original geometry of the 1.9-Å structure14 (Fig. 7) and in the free electron laser structure36. Recent QM/MM studies by Pal et al.34 also demonstrated that OH– at O5 has no direct-H-bond partner in their S0 model; this implies that the ‘energy barrier' for PT with O5 must be high. Indeed, Pal et al. demonstrated that O5 deprotonation only occurred when using ‘a small model of the oxidized S0′ state' (that is, not ‘the QM/MM S0 model', see supplementary Fig. 7b in ref. 34), in line with our conclusions.
Siegbahn put forward a model in which O5 (=OH–) deprotonation occurred on the S0–S1 transition by assuming an additional water molecule near O5 in density functional theory (DFT) calculations35, a water molecule that is not visible not only in the original 1.9-Å structure14 but also in the recent radiation-damage-free PSII crystal structure36. This extra water molecule was positioned so that it could accept an H-bond from O5 (ref. 35). An appropriately oriented proton acceptor for O5 would significantly decrease the energy barrier for release of a proton from O5. In this case however, the actual 1.9-Å structure shows that the water molecule cannot be located at the corresponding position due to the presence of a conserved hydrophobic amino acid side-chain, D1-Val185 (CγVal185−Owater=∼2.1 Å in Supplementary Fig. 7). This feature is also present in the free electron laser structure, which is assumed to be in the S1 state36. In the O5 deprotonation model, D1-Val185 was not included in the calculation and hence was absent from the model35. Furthermore, the O5 deprotonation model also included a significant structural modification in the vicinity of the H-bond accepting water: the side-chain of D1-His332 was twisted (by ∼90°) along the Mn1-NɛHis332 axis35 compared with its position in the 1.9-Å structure. These two structural differences compared with the reference crystal structure thus allowed the water to be located close to O5 without the steric repulsion that would have occurred in the unmodified 1.9-Å structure (Supplementary Fig. 7). It could be argued ad hoc that a conformational change may occur resulting in the situation modelled. However the most recent unreduced structure of the enzyme shows no sign of such changes36, so arguments for such a conformational change are not compelling. Without specific justification for the ∼90° twist of the Mn-ligated D1-His332 side-chain and the relocation of the conserved hydrophobic D1-Val185 side-chain away from the O5 moiety, it seems unjustified to place a water molecule at the position required for it to accept an H-bond from O5 for modelling the S0 and S1 transition.
The O5 deprotonation model also showed significantly large deviations of the atomic coordinates from those of the original 1.9-Å structure35 not only for D1-His332 (root-mean-square deviation=1.28 Å) but also for CP43-Arg357 (1.19 Å) and D1-Glu189 (0.51 Å, Supplementary Table 3). Furthermore, the H-bond partner of O4, that is, W539, and the entire O4-water chain were also absent in the earlier model35. These changes and omissions are expected to affect the resulting energy of the system in that model.
Overall then based on the current data, it seems clear that the deprotonation of a OH– at O5, as suggested earlier34,35, is less likely than deprotonation of OH– at O4, as suggested in the present work.
Deprotonation of the substrate oxygen and protonation of O4
It has been proposed that the exchangeable μ-oxo bridge is likely to be O5 (refs 24, 29, 33, 52; see also relevant articles19,20 published before the detailed 1.9-Å structure14), and thus O5 is a plausible candidate for the slow exchanging substrate water molecule Ws (ref. 53). This is not incompatible with the presence of protonated O4 in S0: it is possible that the liberation of O2 on formation of S0 is associated with the release of a proton from the substrate ending up on μ-oxo bridge O4. A similar protonation of a μ-oxo bridge on liberation of O2 has been proposed in manganese catalases54.
The O4-water chain and the low S0/S1 redox potential
The conversion of the S0 state into the S1 state55 due to its oxidation by TyrD· showed that the S0/S1 redox potential is lower than that of TyrD redox potential56, the latter was estimated to be ∼720–760 mV (refs 57, 58). Given that all the S0 present is converted to S1 by TyrD·, the S0/S1 redox potential can be taken to be ≤700 mV assuming the estimates for TyrD redox couple are reasonable. In contrast, the S1/S2 and S2/S3 redox potentials are clearly higher since they oxidize TyrD56 and they have been suggested to be ∼900–950 mV (ref. 58). Thus, the barrier-less deprotonation and the subsequent downhill PT reaction occurring on the S0–S1 transition may contribute to the uniquely low redox potential of this redox couple, compared with those of the other S-state transitions. As demonstrated by Warshel and coworkers47,51, low-barrier H-bonds (including single-well H-bonds), where the pKa difference for the donor and acceptor moieties is nearly zero (that is, less polarized), are particularly unstable in polar protein environments. An O4–OW539 H-bond will become a very unstable low-barrier H-bond upon oxidation to S1, resulting in the release of the proton via the O4-water chain (Table 1). This is consistent with the observation that S1 does not spontaneously back-react to form S0 (ref. 59). PT may proceed through different pathways depending on the S-state transitions5,6,7. Intriguingly, it has been reported that the rate constant for the S0–S1 transition is essentially pH-independent, whereas that for S2–S3 transition is pH-dependent21,48,49. Ionizable groups are more likely to be involved in a PT pathway for a pH-dependent process than a pH-independent process; this fits with the suggestion that the uncharged O4-water chain may be active in the S0–S1 transition.
Changes in Mn–Mn distances by Mn oxidation/deprotonation
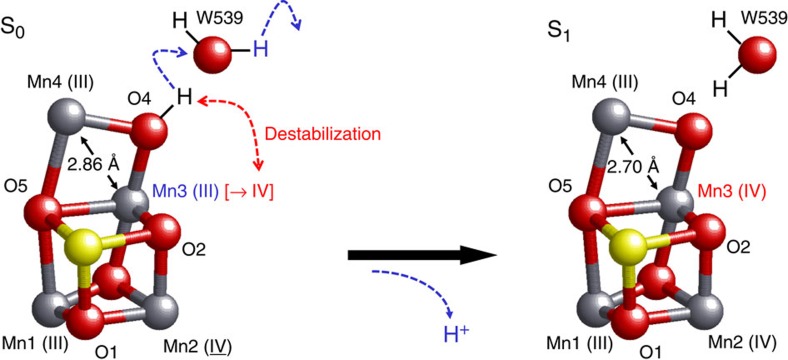
On proton release from O4, the Mn ion undergoing oxidation was Mn3 (Fig. 8). We note that the Mn undergoing oxidation is unlikely to be Mn4 because it appears to be the most reduced site, that is, it has the highest potential (for example, refs 29 and 60). Our results suggest that on formation of S1, oxidation of Mn3 from the III valence to IV favours the release of the proton from OH− at O4 (Fig. 8). From ENDOR, electron paramagnetic resonance (EPR) and simulation of the EXAFS, it has been proposed that a Mn–Mn distance of ∼2.85 Å in the S0 state is decreased to ∼2.7 Å in the S1 state (2.83–2.73 Å (ref. 16), 2.85–2.72 Å (ref. 19) or 2.85–2.75 Å (ref. 20)). In the present calculations, Mn3–Mn4 was the only distance that was decreased by ∼0.1 Å from 2.86 Å in S0 to 2.70 Å in S1 (Table 2 and Supplementary Table 4). Note that the corresponding change was 2.90, a slightly longer distance, to 2.71 Å when O5 was assumed to be the deprotonation site34. These results suggest that the decreased Mn–Mn distance reported in EXAFS studies16,17,18,19,20,21 corresponds to the Mn3–Mn4 distance, which is decreased by deprotonation of O4 in the S0–S1 transition.
Figure 8. Oxidation states of the four Mn ions and protonation states of the O atoms.
The release of a proton from O4 occurs due to oxidation at O4 via the single-well H-bond with W539 upon formation of S1.
Table 2. Mn–Mn distances (Å).
| S0: pre-PT (O4=OH−) | S1: post-PT (O4=O2−) | |
|---|---|---|
| Mn1–4 | III, IV, IV, III | III, IV, IV, III |
| Mn1–Mn2 | 2.75 | 2.75 |
| Mn2–Mn3 | 2.76 | 2.76 |
| Mn1–Mn3 | 3.36 | 3.28 |
| Mn3–Mn4 | 2.86 | 2.70* |
| Mn1–Mn4 | 4.74 | 4.81 |
*Essentially consistent with the value of 2.71 Å in S1 (O4 and O5=O2−) in other studies (for example, ref. 34).
Mn3–Mn4 is a key distance that can allow us to evaluate the reduction state of PSII crystal structures with respect to geometries obtained from ENDOR, EPR or simulation of the EXAFS16,17,18,19,20,21 in both S0 and S1. The Mn3–Mn4 distance of 2.87 Å in the free electron laser structure36, which was reproduced (2.91 Å with OH– at O5 in S1) in QM/MM studies by Shoji et al.61 is close to the distance of S0 (∼2.85 Å), not the distance of S1 (∼2.73 Å), obtained from ENDOR, EPR and EXAFS. This is in line with the presence of significant amount of the reduced S0 state suggested from recent QM/MM studies by Askerka et al.38 It seems likely that the geometry of the free electron laser structure does not represent a pure S1 state detected ENDOR, EPR and EXAFS16,17,18,19,20,21 and is probably in a more reduced state.
An argument for the presence of a hydroxide ion at O5 for the free electron laser structure proposed by Suga et al.36 was the observation of significantly lengthened distances between O5 and the adjacent Mn ions. The presence of a hydroxide ion at O5 was considered likely because recent QM/MM studies by Shoji et al.61 have reproduced two of the three significantly lengthened distances between O5 and the adjacent Mn ions, Mn1–O5 (2.70 Å (ref. 36) and 2.73 Å (ref. 61)) and Mn4–O5 (2.33 Å (ref. 36) and 2.34 Å (ref. 61)), by assuming OH– at O5 in S1 (ref. 61). However, it should also be noted that one of the three significantly lengthened distances in the free electron laser structure, Mn3–O5, could not be reproduced in this study61; in fact Mn3–O5 was significantly shortened in the QM/MM geometry (2.20 Å (ref. 36) to 1.96 Å (ref. 61)). Indeed, the 1.9 Å structure has an even longer Mn3–O5 distance of 2.38 Å (ref. 14). Notably, a similar Mn3–O5 distance of 2.37 Å was obtained, assuming reduced Mn(II) for Mn4 in DFT studies by Petrie et al.62.
These features of the free electron laser structure, (i) the lengthened Mn3–Mn4 distance with respect to S0 of ENDOR, EPR and EXAFS16,17,18,19,20,21 and (ii) the lengthened Mn3–O5 distance with respect to the QM/MM geometry (S1 with OH– at O5 (ref. 61)), suggest that Mn4CaO5 of the free electron laser structure is probably reduced and cannot be simply explained as representing a single oxidation (and protonation) state.
Discussion
Based on the findings reported here, we are able to propose a mechanism for PT along the O4-water chain. (Note that the role of the O4-water chain as a proton channel as proposed here does not exclude a role as a substrate channel on other steps of the cycle.) On the S0–S1 transition deprotonation of a μ-hydroxo group at the O4 position occurs due to oxidation of Mn3(III) to Mn3(IV) (Fig. 8). This deprotonation results in a decrease in the Mn3–Mn4 distance from 2.86 to 2.70 Å (Table 2 and Supplementary Table 4); a similar decrease in the Mn–Mn separation has been reported in ENDOR, EPR or EXAFS studies16,19,20. The nature of the O4-water chain, being composed exclusively of water molecules, is consistent with and may explain the pH-independence of PT in the S0–S1 transition 21,48,49. At the start of the O4-water chain, the proton in the barrier-less O4–OW539 H-bond is likely to move away from the positively charged S1 when it forms. Thus, the O4–OW539 H-bond is energetically less stable in S1, resulting in the sequential (Fig. 2) and downhill (Fig. 4) PT reaction. The presence of the O4-water chain may explain why formation of the S1 state is less inhibited by Cl– depletion63. It may also explain the apparently irreversibility of S0–S1 step59 and the redox potential of S0/S1 being uniquely low, lower than the TyrD redox potential56,58, resulting in the conversion of S0–S1 in the dark55,56.
It has been suggested that in bacteriorhodopsin, the PT occurs to the Schiff base along a chain of three water molecules, by transforming from the pre-PT to post-PT patterns64. As far as we are aware the O4-water chain is the longest PT channel of water molecules (∼8-water molecules) identified in protein crystal structures. This unusually long and straight water chain, which seems to function as a PT pathway in the water-oxidizing enzyme, is worthy of study in its own right.
Methods
Coordinates and atomic partial charges
The atomic coordinates of PSII were taken from the X-ray structure of PSII monomer unit ‘A' of the PSII complexes from Thermosynechococcus vulcanus at a resolution of 1.9 Å (Protein Data Bank (PDB) code, 3ARC)14. Hydrogen atoms were generated and energetically optimized with CHARMM65, whereas the positions of all non-hydrogen atoms were fixed, and all titratable groups were kept in their standard protonation states (that is, acidic groups were ionized and basic groups were protonated). For the QM/MM calculations, we added additional counter ions to neutralize the entire system. Atomic partial charges of the amino acids were adopted from the all-atom CHARMM22 (ref. 66) parameter set. The atomic charges of cofactors were taken from our previous studies of PSII43.
QM/MM calculations
We employed the electrostatic embedding QM/MM scheme, in which electrostatic and steric effects created by a protein environment were explicitly considered, and we used the Qsite67 programme code, as used in previous studies43. We employed the unrestricted DFT method with the B3LYP functional and LACVP** basis sets. To analyse H-bond potential-energy profiles of the O4–OW539 bond, the QM region was defined as the Mn4CaO5 cluster (including the ligands), water molecules shown in Fig. 1, side-chains of D1-Asp61, D1-Asn338, D2-Asn350, and CP43-Thr335, and backbones of D1-Asp61, D1-Asn335, D1-Ala336, D2-Asn350 and CP43-Gly338, whereas other protein units and all cofactors were approximated by the MM force field. To analyse all of the H-bonds along the O4-water chain (Fig. 1) in the pre-PT conformation, a slightly smaller QM region was defined as (the Mn4CaO5 cluster (including the ligands), water molecules shown in Fig. 1 and the side-chain of CP43-Thr335) for efficiency (small QM). The two QM regions did not essentially alter the results and conclusions. The resulting geometries were essentially identical regardless of the size of the QM region (Supplementary Tables 2 and 4). The results obtained on the basis of the large QM region were described in the main text. To analyse all of the H-bonds along the O5 path (Fig. 1) in the pre-PT-like conformation, the QM region was defined as (the Mn4CaO5 cluster (including the ligands), water molecules of W1, W2, W3, W4, W539, W538, W446, and W442, side-chains of D1-Asp61, D1-Asn181, and D2-Lys317 and a chloride ion (Cl-1)). To analyze H-bond patterns of the O5 and W2 moiety (Fig. 7), we used the QM region same as that in ref. 68. The geometries were refined by constrained QM/MM optimization. Specifically, the coordinates of the heavy atoms in the surrounding MM region were fixed at their original X-ray coordinates, while those of the H atoms in the MM region were optimized using the OPLS2005 force field. All of the atomic coordinates in the QM region were fully relaxed (that is, not fixed) in the QM/MM calculation. Note that the resulting atomic coordinates of the QM region essentially did not alter upon full relaxation of the entire atoms (including heavy atoms) in the surrounding MM region68. The Mn4CaO5 cluster was considered to be ferromagnetically coupled; for example, the total spin S=7 in S1 and the resulting Mn oxidation state (Mn1, Mn2, Mn3, Mn4)=(III, IV, IV, III) (see Supplementary Discussion for further details). The potential-energy profiles of H-bonds were obtained as follows: first, we prepared the QM/MM optimized geometry without constraints and used the resulting geometry as the initial geometry. The H atom under investigation was then moved from the H-bond donor atom (Odonor) towards the acceptor atom (Oacceptor) by 0.05 Å, after which the geometry was optimized by constraining the Odonor–H and H–Oacceptor distances. The energy of the resulting geometry was calculated. This procedure was repeated until the H atom reached the Oacceptor atom. See Supplementary Data 1 for the atomic coordinates of the QM region (that is, Mn4CaO5). As discussed later, OH– at O5 has no direct-H-bond in the protein environment of PSII. Thus, to analyse the PT from O5, we assumed W2 (O5…OW2=3.1 Å (ref. 14)) as the plausible proton acceptor, and analysed the energy profile by constraining the H–OW2 distance. We also calculated the 1H NMR chemical shift for OH− at O5 (see Supplementary Methods and Supplementary Discussion).
Additional information
How to cite this article: Saito, K. et al., Energetics of proton release on the first oxidation step in the water-oxidizing enzyme. Nat. Commun. 6:8488 doi: 10.1038/ncomms9488 (2015).
Supplementary Material
Supplementary Figures 1-8, Supplementary Tables 1-4, Supplementary Discussion, Supplementary Methods and Supplementary References
Atomic coordinates for QM/MM calculations
Acknowledgments
This research was supported by the JST PRESTO programme (K.S.), JSPS KAKENHI (22740276 and 26800224 to K.S. and 15H00864, 25107517, 26105012 and 26711008 to H.I.), Tokyo Ohka Foundation for The Promotion of Science and Technology (H.I.), and Biotechnological and Biological Sciences Research Council Grant (BB/K002627/1 to A.W.R.). A.W.R. is the recipient of a Wolfson Merit Award of the Royal Society.
Footnotes
Author contributions H.I. designed research; K.S. and H.I. performed research; K.S., A.W.R. and H.I. analysed data; and A.W.R. and H.I. wrote the paper.
References
- Dau H., Zaharieva I. & Haumann M. Recent developments in research on water oxidation by photosystem II. Curr. Opin. Chem. Biol. 16, 3–10 (2012) . [DOI] [PubMed] [Google Scholar]
- Cox N. & Messinger J. Reflections on substrate water and dioxygen formation. Biochim. Biophys. Acta 1827, 1020–1030 (2013) . [DOI] [PubMed] [Google Scholar]
- Schlodder E. & Witt H. T. Stoichiometry of proton release from the catalytic center in photosynthetic water oxidation. J. Biol. Chem. 274, 30387–30392 (1999) . [DOI] [PubMed] [Google Scholar]
- Suzuki H., Sugiura M. & Noguchi T. pH dependence of the flash-induced S-state transitions in the oxygen-evolving center of photosystem II from Thermosynechoccocus elongatus as revealed by Fourier transform infrared spectroscopy. Biochemistry 44, 1708–1718 (2005) . [DOI] [PubMed] [Google Scholar]
- Haumann M. & Junge W. Photosynthetic water oxidation: a simplex-scheme of its partial reactions. Biochim. Biophys. Acta 1411, 86–91 (1999) . [DOI] [PubMed] [Google Scholar]
- Vrettos J. S., Limburg J. & Brudvig G. W. Mechanism of photosynthetic water oxidation: combining biophysical studies of photosystem II with inorganic model chemistry. Biochim. Biophys. Acta 1503, 229–245 (2001) . [DOI] [PubMed] [Google Scholar]
- Renger G. Photosynthetic water oxidation to molecular oxygen: apparatus and mechanism. Biochim. Biophys. Acta 1503, 210–228 (2001) . [DOI] [PubMed] [Google Scholar]
- Murray J. W. & Barber J. Structural characteristics of channels and pathways in photosystem II including the identification of an oxygen channel. J. Struct. Biol. 159, 228–237 (2007) . [DOI] [PubMed] [Google Scholar]
- Ho F. M. & Styring S. Access channels and methanol binding site to the CaMn4 cluster in photosystem II based on solvent accessibility simulations, with implications for substrate water access. Biochim. Biophys. Acta 1777, 140–153 (2008) . [DOI] [PubMed] [Google Scholar]
- Vassiliev S., Zaraiskaya T. & Bruce D. Exploring the energetics of water permeation in photosystem II by multiple steered molecular dynamics simulations. Biochim. Biophys. Acta 1817, 1671–1678 (2012) . [DOI] [PubMed] [Google Scholar]
- Ogata K., Yuki T., Hatakeyama M., Uchida W. & Nakamura S. All-atom molecular dynamics simulation of photosystem II embedded in thylakoid membrane. J. Am. Chem. Soc. 135, 15670–15673 (2013) . [DOI] [PubMed] [Google Scholar]
- Linke K. & Ho F. M. Water in photosystem II: structural, functional and mechanistic considerations. Biochim. Biophys. Acta 1837, 14–32 (2014) . [DOI] [PubMed] [Google Scholar]
- Dilbeck P. L., Bao H., Neveu C. L. & Burnap R. L. Perturbing the water cavity surrounding the manganese cluster by mutating the residue D1-valine 185 has a strong effect on the water oxidation mechanism of photosystem II. Biochemistry 52, 6824–6833 (2013) . [DOI] [PubMed] [Google Scholar]
- Umena Y., Kawakami K., Shen J.-R. & Kamiya N. Crystal structure of oxygen-evolving photosystem II at a resolution of 1.9Å. Nature 473, 55–60 (2011) . [DOI] [PubMed] [Google Scholar]
- Gatt P., Petrie S., Stranger R. & Pace R. J. Rationalizing the 1.9 Å crystal structure of photosystem II—a remarkable Jahn-Teller balancing act induced by a single proton transfer. Angew. Chem. Int. Ed. 51, 12025–12028 (2012) . [DOI] [PubMed] [Google Scholar]
- Baldwin M. J. et al. Structural and magnetic effects of successive protonations of oxo bridges in high-valent manganese dimers. J. Am. Chem. Soc. 116, 11349–11356 (1994) . [Google Scholar]
- Yano J. et al. X-ray damage to the Mn4Ca complex in single crystals of photosystem II: a case study for metalloprotein crystallography. Proc. Natl Acad. Sci. USA 102, 12047–12052 (2005) . [DOI] [PMC free article] [PubMed] [Google Scholar]
- Grabolle M., Haumann M., Muller C., Liebisch P. & Dau H. Rapid loss of structural motifs in the manganese complex of oxygenic photosynthesis by X-ray irradiation at 10-300 K. J. Biol. Chem. 281, 4580–4588 (2006) . [DOI] [PubMed] [Google Scholar]
- Robblee J. H. et al. The Mn cluster in the S0 state of the oxygen-evolving complex of photosystem II studied by EXAFS spectroscopy: are there three di-μ-oxo-bridged Mn2 moieties in the tetranuclear Mn complex? J. Am. Chem. Soc. 124, 7459–7471 (2002) . [DOI] [PMC free article] [PubMed] [Google Scholar]
- Kulik L. V., Epel B., Lubitz W. & Messinger J. Electronic structure of the Mn4OxCa cluster in the S0 and S2 states of the oxygen-evolving complex of photosystem II based on pulse 55Mn-ENDOR and EPR spectroscopy. J. Am. Chem. Soc. 129, 13421–13435 (2007) . [DOI] [PubMed] [Google Scholar]
- Dau H. & Haumann M. The manganese complex of photosystem II in its reaction cycle? Basic framework and possible realization at the atomic level. Coord. Chem. Rev. 252, 273–295 (2008) . [Google Scholar]
- Krewald V. et al. Metal oxidation states in biological water splitting. Chem. Sci. 6, 1676–1695 (2015) . [DOI] [PMC free article] [PubMed] [Google Scholar]
- Britt R. D. et al. Recent pulsed EPR studies of the photosystem II oxygen-evolving complex: implications as to water oxidation mechanisms. Biochim. Biophys. Acta 1655, 158–171 (2004) . [DOI] [PubMed] [Google Scholar]
- Rapatskiy L. et al. Detection of the water-binding sites of the oxygen-evolving complex of photosystem II using W-band 17O electron-electron double resonance-detected NMR spectroscopy. J. Am. Chem. Soc. 134, 16619–16634 (2012) . [DOI] [PubMed] [Google Scholar]
- Messinger J. Evaluation of different mechanistic proposals for water oxidation in photosynthesis on the basis of Mn4OxCa structures for the catalytic site and spectroscopic data. Phys. Chem. Chem. Phys. 6, 4764–4771 (2004) . [Google Scholar]
- Koua F. H., Umena Y., Kawakami K. & Shen J. R. Structure of Sr-substituted photosystem II at 2.1Å resolution and its implications in the mechanism of water oxidation. Proc. Natl Acad. Sci. USA 110, 3889–3894 (2013) . [DOI] [PMC free article] [PubMed] [Google Scholar]
- Hillier W., Messinger J. & Wydrzynski T. Kinetic determination of the fast exchanging substrate water molecule in the S3 state of photosystem II. Biochemistry 37, 16908–16914 (1998) . [DOI] [PubMed] [Google Scholar]
- Kusunoki M. S1-state Mn4Ca complex of photosystem II exists in equilibrium between the two most-stable isomeric substates: XRD and EXAFS evidence. J. Photochem. Photobiol. B 104, 100–110 (2011) . [DOI] [PubMed] [Google Scholar]
- Cox N., Pantazis D. A., Neese F. & Lubitz W. Biological water oxidation. Acc. Chem. Res. 46, 1588–1596 (2013) . [DOI] [PubMed] [Google Scholar]
- Sproviero E. M. et al. QM/MM computational studies of substrate water binding to the oxygen-evolving centre of photosystem II. Philos. Trans. R. Soc. Lond. B Biol. Sci. 363, 1149–1156 (2008) . [DOI] [PMC free article] [PubMed] [Google Scholar]
- Siegbahn P. E. Substrate water exchange for the oxygen evolving complex in PSII in the S1, S2, and S3 states. J. Am. Chem. Soc. 135, 9442–9449 (2013) . [DOI] [PubMed] [Google Scholar]
- Perez Navarro M. et al. Ammonia binding to the oxygen-evolving complex of photosystem II identifies the solvent-exchangeable oxygen bridge (μ-oxo) of the manganese tetramer. Proc. Natl Acad. Sci. USA 110, 15561–15566 (2013) . [DOI] [PMC free article] [PubMed] [Google Scholar]
- McConnell I. L. et al. EPR-ENDOR characterization of (17O, 1H, 2H) water in manganese catalase and its relevance to the oxygen-evolving complex of photosystem II. J. Am. Chem. Soc. 134, 1504–1512 (2012) . [DOI] [PMC free article] [PubMed] [Google Scholar]
- Pal R. et al. S-State model of the oxygen-evolving complex of photosystem II. Biochemistry 52, 7703–7706 (2013) . [DOI] [PubMed] [Google Scholar]
- Siegbahn P. E. Water oxidation mechanism in photosystem II, including oxidations, proton release pathways, O–O bond formation and O2 release. Biochim. Biophys. Acta 1827, 1003–1019 (2013) . [DOI] [PubMed] [Google Scholar]
- Suga M. et al. Native structure of photosystem II at 1.95 Å resolution viewed by femtosecond X-ray pulses. Nature 517, 99–103 (2015) . [DOI] [PubMed] [Google Scholar]
- Grundmeier A. & Dau H. Structural models of the manganese complex of photosystem II and mechanistic implications. Biochim. Biophys. Acta 133, 88–105 (2012) . [DOI] [PubMed] [Google Scholar]
- Askerka M., Vinyard D. J., Wang J., Brudvig G. W. & Batista V. S. Analysis of the radiation-damage-free X-ray structure of photosystem II in light of EXAFS and QM/MM data. Biochemistry 54, 1713–1716 (2015) . [DOI] [PubMed] [Google Scholar]
- Mikenda W. Stretching frequency versus bond distance correlation of O-D(H)...Y (Y=N, O, S, Se, Cl, Br, I) hydrogen bonds in solid hydrates. J. Mol. Struct. 147, 1–15 (1986) . [Google Scholar]
- Limbach H.-H. et al. OHO hydrogen bond geometries and NMR chemical shifts: from equilibrium structures to geometric H/D isotope effects, with applications for water, protonated water, and compressed ice. Isr. J. Chem. 49, 199–216 (2009) . [Google Scholar]
- Jeffrey G. A. An Introduction To Hydrogen Bonding Oxford University Press (1997) . [Google Scholar]
- Frey P. A. in Isotope Effects In Chemistry And Biology (eds Kohen A., Limbach H.-H. 975–993CRC press (2006) . [Google Scholar]
- Saito K., Shen J.-R., Ishida T. & Ishikita H. Short hydrogen-bond between redox-active tyrosine YZ and D1-His190 in the photosystem II crystal structure. Biochemistry 50, 9836–9844 (2011) . [DOI] [PubMed] [Google Scholar]
- Saito K., Rutherford A. W. & Ishikita H. Mechanism of proton-coupled quinone reduction in photosystem II. Proc. Natl Acad. Sci. USA 110, 954–959 (2013) . [DOI] [PMC free article] [PubMed] [Google Scholar]
- Ishikita H. & Saito K. Proton transfer reactions and hydrogen-bond networks in protein environments. J. R. Soc. Interface 11, 20130518 (2014) . [DOI] [PMC free article] [PubMed] [Google Scholar]
- Guskov A. et al. Cyanobacterial photosystem II at 2.9-Å resolution and the role of quinones, lipids, channels and chloride. Nat. Struct. Mol. Biol. 16, 334–342 (2009) . [DOI] [PubMed] [Google Scholar]
- Warshel A., Papazyan A. & Kollman P. A. On low-barrier hydrogen bonds and enzyme catalysis. Science 269, 102–106 (1995) . [DOI] [PubMed] [Google Scholar]
- Renger G. & Hanssum B. Studies on the reaction coordinates of the water oxidase in PS II membrane fragments from spinach. FEBS Lett. 299, 28–32 (1992) . [DOI] [PubMed] [Google Scholar]
- Haumann M., Bögershausen O., Cherepanov D., Ahlbrink R. & Junge W. Photosynthetic oxygen evolution: H/D isotope effects and the coupling between electron and proton transfer during the redox reactions at the oxidizing side of photosystem II. Photosynth. Res. 193, 193–208 (1997) . [Google Scholar]
- Stuchebrukhov A. A. Mechanisms of proton transfer in proteins: localized charge transfer versus delocalized soliton transfer. Phys. Rev. E Stat. Nonlin. Soft Matter Phys. 79, 031927 (2009) . [DOI] [PMC free article] [PubMed] [Google Scholar]
- Schutz C. N. & Warshel A. The low barrier hydrogen bond (LBHB) proposal revisited: the case of the Asp... His pair in serine proteases. Proteins 55, 711–723 (2004) . [DOI] [PubMed] [Google Scholar]
- Galstyan A., Robertazzi A. & Knapp E. W. Oxygen-evolving Mn cluster in photosystem II: the protonation pattern and oxidation state in the high-resolution crystal structure. J. Am. Chem. Soc. 134, 7442–7449 (2012) . [DOI] [PubMed] [Google Scholar]
- Hillier W. & Wydrzynski T. The affinities for the two substrate water binding sites in the O2 evolving complex of photosystem II vary independently during S-state turnover. Biochemistry 39, 4399–4405 (2000) . [DOI] [PubMed] [Google Scholar]
- Whittaker M. M., Barynin V. V., Antonyuk S. V. & Whittaker J. W. The oxidized (3,3) state of manganese catalase. Comparison of enzymes from Thermus thermophilus and Lactobacillus plantarum. Biochemistry 38, 9126–9136 (1999) . [DOI] [PubMed] [Google Scholar]
- Vermaas W. F. J., Renger G. & Dohnt G. The reduction of the oxygen-evolving system in chloroplasts by thylakoid components. Biochim. Biophys. Acta 764, 194–202 (1984) . [Google Scholar]
- Styring S. & Rutherford A. W. In the oxygen-evolving complex of photosystem II the S0 state is oxidized to the S1 state by D+ (signal IIslow). Biochemistry 26, 2401–2405 (1987) . [Google Scholar]
- Boussac A. & Etienne A. L. Midpoint potential of signal II (slow) in Tris-washed photosystem-II particles. Biochim. Biophys. Acta 766, 576–581 (1984) . [Google Scholar]
- Vass I. & Styring S. pH-dependent charge equilibria between tyrosine-D and the S states in photosystem II. Estimation of relative midpoint redox potentials. Biochemistry 30, 830–839 (1991) . [DOI] [PubMed] [Google Scholar]
- Kok B., Forbush B. & McGloin M. Cooperation of charges in photosynthetic O2 evolution–I. A linear four step mechanism. Photochem. Photobiol. 11, 457–475 (1970) . [DOI] [PubMed] [Google Scholar]
- Kurashige Y., Chan G. K. & Yanai T. Entangled quantum electronic wavefunctions of the Mn4CaO5 cluster in photosystem II. Nat. Chem. 5, 660–666 (2013) . [DOI] [PubMed] [Google Scholar]
- Shoji M. et al. Theoretical studies of the damage-free S1 structure of the CaMn4O5 cluster in oxygen-evolving complex of photosystem II. Chem. Phys. Lett. 623, 1–7 (2015) . [Google Scholar]
- Petrie S., Pace R. J. & Stranger R. Resolving the differences between the 1.9 Å and 1.95 Å crystal structures of photosystem II: a single proton relocation defines two tautomeric forms of the water-oxidizing complex. Angew. Chem. Int. Ed. 54, 7120–7124 (2015) . [DOI] [PubMed] [Google Scholar]
- Wincencjusz H., van Gorkom H. J. & Yocum C. F. The photosynthetic oxygen evolving complex requires chloride for its redox state S2→S3 and S3→S0 transitions but not for S0→S1 or S1→S2 transitions. Biochemistry 36, 3663–3670 (1997) . [DOI] [PubMed] [Google Scholar]
- Freier E., Wolf S. & Gerwert K. Proton transfer via a transient linear water-molecule chain in a membrane protein. Proc. Natl Acad. Sci. USA 108, 11435–11439 (2011) . [DOI] [PMC free article] [PubMed] [Google Scholar]
- Brooks B. R. et al. CHARMM: a program for macromolecular energy minimization and dynamics calculations. J. Comput. Chem. 4, 187–217 (1983) . [Google Scholar]
- MacKerell A. D. Jr et al. All-atom empirical potential for molecular modeling and dynamics studies of proteins. J. Phys. Chem. B 102, 3586–3616 (1998) . [DOI] [PubMed] [Google Scholar]
- QSite, version 5 8, Schrödinger, LLC, New York, NY, 2012 .
- Saito K. & Ishikita H. Influence of the Ca2+ ion on the Mn4Ca conformation and the H-bond network arrangement in photosystem II. Biochim. Biophys. Acta 1837, 159–166 (2014) . [DOI] [PubMed] [Google Scholar]
- Bathelt C. M., Mulholland A. J. & Harvey J. N. QM/MM studies of the electronic structure of the compound I intermediate in cytochrome c peroxidase and ascorbate peroxidase. Dalton Trans. 3470–3476 (2005) . [DOI] [PubMed] [Google Scholar]
- Wang B. & Truhlar D. G. Screened electrostatic interactions in molecular mechanics. J. Chem. Theory Comput. 10, 4480–4487 (2014) . [DOI] [PubMed] [Google Scholar]
Associated Data
This section collects any data citations, data availability statements, or supplementary materials included in this article.
Supplementary Materials
Supplementary Figures 1-8, Supplementary Tables 1-4, Supplementary Discussion, Supplementary Methods and Supplementary References
Atomic coordinates for QM/MM calculations


