

Abstract
Neuroimaging and modern computational techniques like spatial covariance analysis have contributed greatly to the understanding of neural system abnormalities in neurodegenerative disorders such as Parkinson’s disease (PD). The application of network analysis to metabolic PET data obtained from patients with PD has led to the identification and validation of two distinct spatial covariance patterns associated with the motor and cognitive manifestations of the disease. Quantifying the activity of these patterns in individual subjects has provided an objective tool for the assessment of treatment efficacy and differential diagnosis. We have found that activity of the PD motor-related network is modulated by antiparkinsonian treatments such as dopaminergic therapy, deep brain stimulation (DBS), and subthalamic nucleus (STN) gene therapy. By contrast, the cognitive-related network is not altered by these interventions for PD motor symptoms. This pattern may however change in response to therapies targeting the cognitive symptoms of this disorder. Recent work has focused on the identification of specific network biomarkers for atypical parkinsonian conditions such as multiple system atrophy (MSA) and progressive supranuclear palsy (PSP). These disease-related patterns can potentially be used in an automated imaging-based algorithm to classify patients with these disorders.
Keywords: positron emission tomography, Parkinson’s disease, brain metabolism, differential diagnosis, treatment response
INTRODUCTION
Positron emission tomography (PET) imaging with 18F-fluorodeoxyglucose (FDG) has revealed valuable information concerning abnormal functional connectivity in neurodegenerative disease by the advent of network image analysis. By mapping cerebral glucose metabolism at a voxel level, this imaging approach provides a measure of regional synaptic activity.1,2 Localized pathology can alter functional connectivity across the entire brain in a disease-specific manner. In recent years, spatial covariance analysis has been applied to identify network abnormalities that are associated with neurodegenerative diseases including Parkinson’s disease (PD), Alzheimer’s disease (AD), and Huntington’s disease (HD).3 This approach is based on principal components analysis and has been described in detail elsewhere.4,5 In addition to creating the means to identify and validate specific metabolic covariance patterns related to disease, this computational method can be used to quantify these patterns in individual subjects. This application is particularly suitable for the study of novel therapies6, and in the investigation of presymptomatic individuals at risk for disease.7,8
This review will focus on metabolic imaging and network analysis as applied to PD. Firstly, we will show how PD-related networks are linked to the pathophysiology of the disease. Secondly, we will review the use of imaging to assess the effects of different treatment strategies on network activity.
BRAIN NETWORK ANALYSIS IN PD
PD-Related Metabolic Spatial Covariance Pattern
The cardinal symptoms of PD (i.e., tremor, rigidity, and slowness of movement) are associated with the expression of an abnormal disease-related pattern found in resting-state metabolic images such as those acquired with FDG PET.9–11 This PD-related spatial covariance pattern (PDRP) is characterized by increased pallidothalamic and pontine activity, covarying with relative metabolic reductions in the premotor cortex, supplementary motor area, dorsolateral prefrontal cortex, and parieto-occipital association regions (Fig. 1, left). To date, the PDRP has been identified in seven discrete patient populations scanned in the rest state with either FDG PET or ECD SPECT perfusion imaging.9,12,13 Ma et al. (2007) recently reported highly stable PDRP expression in single subjects, with excellent test–retest reproducibility over hours to weeks.14 There is also substantial evidence linking PDRP activity to motor disability (i.e. Unified Parkinson’s Disease Rating Scale [UPDRS] part 3 composite scores)12,15–18, and to independent PET measures of nigrostriatal dopamine deficiency.10,19
FIG. 1.
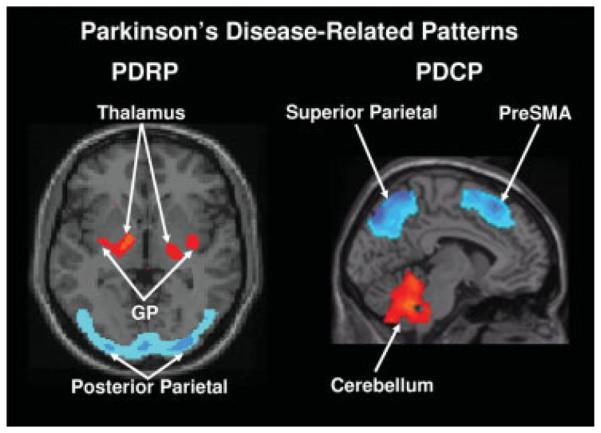
Left: Parkinson’s Disease-Related Pattern (PDRP). This motor-related metabolic spatial covariance pattern is characterized by hypermetabolism in the thalamus, globus pallidus (GP), pons, and motor cortex, associated with relative metabolic reductions in the lateral premotor and posterior parietal areas.14 Right: Parkinson’s Disease-Related Cognitive Pattern (PDCP). This cognition-related metabolic spatial covariance pattern is characterized by hypometabolism of dorsolateral prefrontal cortex, rostral supplementary motor area (preSMA), and superior parietal regions, associated with relative metabolic increases in the cerebellum.17 [In the representative slices, relative metabolic increases are displayed in red; relative metabolic decreases are displayed in blue. For both patterns, the slices were overlaid on a standard MRI brain template.]
The functional/anatomical basis for the PDRP topography has been described in detail previously.20–22 Interestingly, the hypermetabolic nodes of the PDRP are associated with areas of high synaptic activity in both rodent and primate models of parkinsonism. These nodes include the putamen (elevated cortical inputs), both pallidal segments (elevated putamen-GPe and STN-GPi inputs), motor thalamus (elevated GPi thalamic input), and pedunculopontine nucleus (PPN; elevated GPi-pontine input). Although rudimentary, this explanation of the PDRP topography conforms well to traditional “box and line” models of the motor corticostriato-pallido-thalamocortical (CSPTC) loops.23 That said, spatial covariance analysis has disclosed a highly significant correlation between PDRP activity and subject differences in intraoperative recordings of STN firing rates in patients with PD.24 This suggests that the motor-related PD metabolic network is closely related to neuronal activity in a critical modulator of basal ganglia output.25
PD-Related Cognitive Pattern
In addition to motor symptoms, patients with PD may also develop non-motor symptoms that include cognitive impairment and affective disorder. In an FDG PET study conducted in patients with PD without dementia, we reported that neuropsychological performance was associated with the activity of a separate metabolic pattern that was unrelated to the PDRP.17 This PD-related cognitive pattern (PDCP) is characterized by reduced metabolic activity in prefrontal and parietal cortices, with relative increases in dentate nuclei and cerebellar hemispheres (Fig. 1, right). PDCP expression is correlated with impairments in memory and executive functioning as seen in non-demented patients with PD. Like the PDRP, PDCP activity was found to be highly reproducible in individual patients. However, unlike the PDRP, its expression was not altered by the treatment of motor symptoms with either levodopa or stimulation of the subthalamic nucleus (STN).17 In a recent study, we noted elevated PDCP expression in patients with clinically defined mild cognitive impairment compared with patients who were cognitively intact.26 These findings suggest that the PDCP is a network independent from the PDRP and a potential biomarker of cognitive function at early disease stage.
EFFECTS OF DISEASE PROGRESSION ON NETWORK ACTIVITY
Recent longitudinal PD studies in which PDRP/ PDCP measurements were performed in conjunction with dopaminergic imaging and UPDRS assessments have shed light on the activity of these networks in the early stages of disease. Fifteen early stage PD patients (disease duration <2 years) underwent FDG PET scanning (after the cessation of antiparkinsonian medications for at least 12 hours) at baseline, 24 months, and 48 months.19 The patients were also scanned with 18F-fluoropropyl-β-CIT to quantify dopamine transporter binding in the caudate and putamen, which served as an index of presynaptic nigrostriatal dopaminergic dysfunction. We noted that PDRP activity increased linearly over time, and was significantly elevated compared to control values at all three timepoints (Fig. 2). These changes correlated with reductions in UPDRS motor ratings and dopamine transporter binding in the putamen.9 The magnitude of these correlations was modest, and no more than a third of the variability in any one of the biomarkers of progression, such as clinical ratings, dopaminergic imaging, and PDRP was explained by either of the remaining two biomarkers. Thus, these measures are not interchangeable; rather each captures a unique feature of the neurodegenerative process. Further studies with both approaches will be needed to assess their comparative sensitivity to disease progression in the presymptomatic period of PD.
FIG. 2.
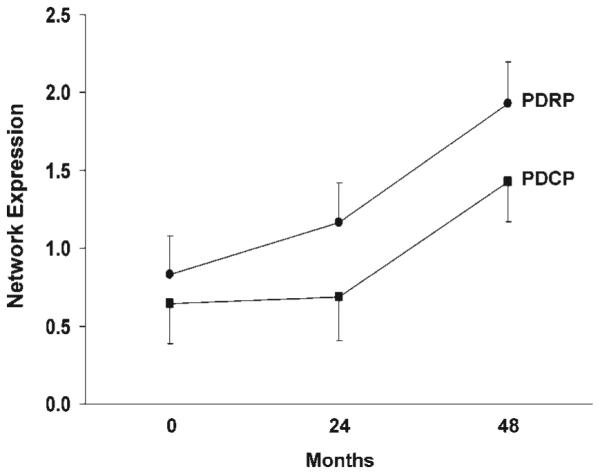
Mean network activity at baseline, 24 and 48 months. Z-transformed values for the PD-related motor and cognitive spatial covariance patterns (PDRP and PDCP; see Figure 1) were computed at each timepoint and displayed relative to the mean for 15 age-matched healthy subjects.19 Network activity increased significantly over time for both patterns, with the PDRP progressing faster than the PDCP. [Bars represent the standard error at each timepoint.] [Brain 130(Part 7), 1834–1846 Copyright © 2007 by Oxford University Press].
On the other hand, PDCP activity increased (P < 0.0001) at a different rate than the PDRP, starting out slow and then accelerating at later timepoints (Fig. 2). Unlike PDRP expression, which was abnormal at baseline, PDCP expression did not reach abnormal levels until the final time point. Moreover, PDCP expression was not associated with a worsening of motor ratings or dopamine transporter binding in the caudate or putamen. Thus, the effects of disease progression differ between the motor and cognitive pathways and different therapeutic approaches may be needed to slow the development of functional disturbances in each pathway.
EFFECTS OF THERAPY ON GLUCOSE METABOLISM
The quantification of network activity during therapeutic interventions for PD may provide an objective means of assessing the effects of treatment on brain function. This network imaging approach may be particularly useful for screening new forms of symptomatic therapy in that significant network modulation has been detected with as little as seven subjects.20,27 Over the past several years, we have studied the effects of l-dopa and stereotaxic surgical interventions on resting glucose metabolism. By quantifying the activity of multiple covariance patterns in FDG PET scan data, we studied the differential effects of treatment on parallel neural systems mediating the motor and cognitive manifestations of PD.
l-Dopa
Imaging studies conducted with PD patients on l-dopa therapy have revealed changes in glucose metabolism, particularly reductions in cerebellar vermis, putamen, GP, thalamus, and precentral gyrus.16,28 Additionally, other researchers have reported treatment-mediated metabolic reductions in the ventral orbitofrontal cortex and in the thalamus and lentiform nucleus.29,30 Interestingly, we have found that l-dopa infusion significantly suppresses the expression of the motor-related PD network, but not that of the cognition-related pattern.16,17,28 The changes observed in PDRP activity correlated significantly with clinical improvement in UPDRS motor ratings.16,28 This suggests that the underlying pathophysiology of the motor and cognitive symptoms of PD are distinct. Quantitative measurements of PDCP activity may therefore prove useful for future investigations aimed at treating the cognitive symptoms of this disorder. Moreover, l-dopa therapy has had only a minimal effect on pontine metabolism, perhaps explaining the typical lack of improvement in gait, locomotion, autonomic function, or sleep disturbances with dopaminergic therapy.19 That said, oral l-dopa may improve gait impairment and locomotion difficulties when used in conjunction with PPN DBS.31
Although not significant, the results of an FDG PET study with apomorphine, a mixed D1/D2 receptor agonist, showed similar metabolic reductions in the lenticular nucleus, occipital cortex and thalamus.32 In animal models of PD, l-dopa administration normalized elevations in pallidothalamic glucose utilization33,34 and decreased GPi firing rates.35,36 These findings, along with the PET results, support the notion that l-dopa treatment can lead to a deactivation of excitatory projections to the GPi.
Subthalamic Nucleus Lesioning, Deep Brain Stimulation, and Gene Therapy
In a unilateral subthalamotomy study a group of patients with PD underwent FDG PET scanning preoperatively, as well as 3 and 12 months following surgery.37,38 When compared with baseline, 3-month postoperative cerebral metabolism was significantly reduced in the ipsilateral midbrain (larger than actual ablation site), GPi, ventral thalamus, and pedunculopontine nucleus (PPN), with increased metabolism in the cerebellum.37 Although elevated at baseline, PDRP activity was significantly reduced ipsilateral to subthalamotomy, but not contralateral to the lesion, and was unchanged 12 months after surgery. Reductions in PDRP expression at 12 months, relative to baseline, correlated with improvement in contralateral bradykinesia and rigidity, whereas tremor ratings only demonstrated a trend. Sustained metabolic reductions in GPi, pons, and ventral thalamus were observed at 12-month follow-up scanning, while clinical evaluation demonstrated a worsening of tremor, gait, and postural stability.38 By contrast, GPe metabolism increased between the two postoperative visits, nearly rising to preoperative baseline levels. As demonstrated by these PET data, subthalamotomy resulted in changes in metabolic activity of STN projections to GPi/SNr with subsequent reductions in inhibitory outflow to PPN. These physiological changes may explain the clinical improvement seen in contralateral limb and axial symptoms with this intervention. Because STN-GPe microcircuitry is the central pacemaker of the basal ganglia, it may also contribute to the pathophysiology of tremor.39,40
Bilateral STN Deep Brain Stimulation (DBS) has been found to be associated with reduced rest-state glucose utilization in the putamen, globus pallidus, and primary motor and prefrontal cortex, as well as in the cerebellar vermis.16 Indeed, reductions in PDRP activity induced by this intervention correlated with the degree of postoperative motor benefit that was observed.16,41 Hilker et al.42 have also demonstrated similar PET findings in patients with STN DBS. These findings are in line with the results of a 2-deoxyglucose study of parkinsonian primates in which STN DBS reversed baseline metabolic elevations in the GPi and ventral thalamus, while concomitantly giving rise to local increases in the STN.43 Although PDRP activity can be modulated by STN DBS, the reduction in network expression is less than that seen with subthalamotomy.16 Indeed, the extent to which PDRP expression is reduced appears to be dependent on the surgical target or the mode of treatment (Fig. 3). Our metabolic imaging data as well as clinical observations made by other researchers25,44 suggest that the treatment effects obtained by targeting the STN are greater in magnitude than those targeting the GPi.
FIG. 3.
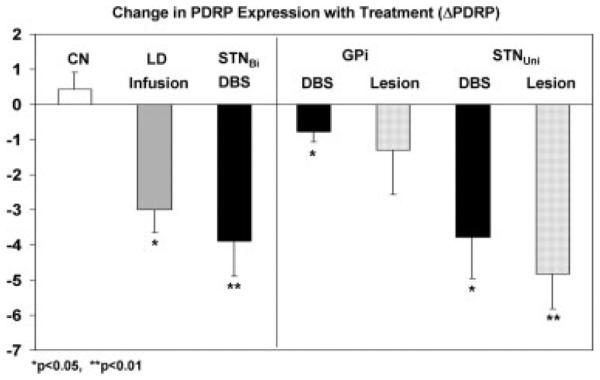
Bar graph illustrating treatment-mediated changes (±SE) in the expression of the PD-related metabolic covariance pattern. Difference values from the levodopa infusion (LD), STN stimulation (DBS), and the test–retest control (CN) groups are presented in the left panel.16 These measures were compared with those from previous PET studies of patients with PD undergoing unilateral stereotaxic procedures of the internal globus pallidus (GPi) or the subthalamic nucleus (STN).41,58 The latter data are presented in the right panel. [ON/OFF PDRP differences in the DBS cohorts are displayed as black bars. Treatment-mediated differences in the LD cohort and the stereotaxic lesioning cohorts are displayed as filled and dotted gray bars, respectively. Asterisks represent P-values with respect to the untreated condition (paired Student’s t-test).] *P < 0.05, **P < 0.01.
The PDRP network has recently been demonstrated to be a useful in vivo marker of treatment response in trials of novel PD therapies. This approach was used in a phase I clinical trial of unilateral STN adeno-associated virus-glutamic acid decarboxylase (AAV-GAD) gene therapy for advanced PD.6,45 Twelve patients were scanned with FDG PET at baseline as well as 6 and 12 months following gene therapy. In this unblinded dose-escalation study, there was a significant change in motor-related PDRP activity on the treated side when compared with the unoperated hemisphere (Fig. 4, left). These changes correlated with improvement in UPDRS motor ratings. By contrast, gene therapy did not alter the activity of the cognitive-related PDCP network in either of the two hemispheres (Fig. 4, right), in concordance with the results of concurrent neuropsychological evaluations.45 These results indicate the potential use of network quantification in the objective assessment of novel PD therapies.
FIG. 4.
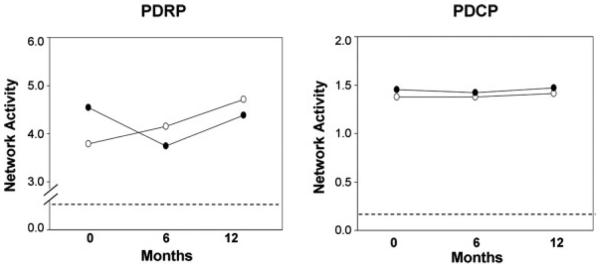
Changes in mean network activity following gene therapy for the operated (filled circles) and the unoperated (open circles) hemispheres.6 There was a significant difference (P < 0.002) in the time course of PDRP activity across the two hemispheres (left). In the unoperated hemisphere, network activity increased continuously over the 12 months after surgery. By contrast, in the operated hemisphere, a decline in network activity was evident during the first 6 months. Over the subsequent 6 months, network activity on this side increased in parallel with analogous values on the unoperated side. There was no change (P = 0.72) in PDCP activity over time in either of the two hemispheres (right). [The dashed line represents one standard error above the normal mean value of zero]. [Proc Natl Acad Sci USA, 104, 19559–19564 Copyright © 2007 National Academy of Sciences, U.S.A.]
METABOLIC IMAGING AND DIFFERENTIAL DIAGNOSIS OF ATYPICAL PARKINSONIAN SYNDROMES
Although PD is the most common form of parkinsonism, there is a wide-range of other etiologies that present similarly at the clinical level. This can lead to misdiagnosis and implementation of incorrect treatment strategies in approximately one quarter of patients.46 Nevertheless, neuroimaging modalities such as PET and MRI have revealed that each atypical variant bears a distinct underlying brain pathology and specific metabolic pattern, which can be applied to differential diagnosis.47–49 Using FDG PET and voxel-based spatial covariance analysis, we have recently identified specific metabolic patterns associated with multiple system atrophy (MSA) and progressive supranuclear palsy (PSP) (Fig. 5).49 The metabolic pattern for MSA is characterized by reductions in the putamen and cerebellum. By contrast, PSP is associated with metabolic decrements in midline frontal regions, superior frontal, anterior cingulate area, medial thalamus and caudate nuclei, and brainstem. In a recent validation study, we computed MSAand PSP-related pattern expression on an individual scan basis in two independent patient groups and a subsequent control group.50 Both patterns were stable and accurately discriminated patients from controls. Indeed, we have recently implemented a fully automated diagnostic procedure based upon these disease-related covariance patterns and the PDRP. This approach, involving FDG PET scans from 150 patients, allowed for the correct diagnosis to be reached in ~90% of patients.51
FIG. 5.

Disease-related spatial covariance patterns associated with MSA (left) and PSP (right).50 For MSA, the disease-related pattern is characterized by covarying metabolic decreases in the putamen and the cerebellum. For PSP, the disease-related pattern is characterized by covarying metabolic decreases in the medial prefrontal cortex (PFC), the frontal eye fields, the ventrolateral prefrontal cortex (VLPFC), the caudate nuclei, the medial thalamus, and the upper brainstem. For both diseases, individual measures of pattern expression (subject scores) accurately discriminated patients from controls in the original network analysis and in prospectively scanned patient and control cohorts. [In the representative slices, relative metabolic decreases are displayed in blue. For both patterns, the slices were overlaid on a standard MRI brain template.] [Revised illustration based on Mov Disord 23: 727–733 Copyright © 2008 John Wiley & Sons Inc.]
Neuroimaging can also help minimize the introduction of potential confounds to clinical trials designed to assess the effects of antiparkinsonian treatments. Used as a screening tool for study enrollment into neuroprotective trials, FDG PET can potentially minimize the inclusion of subjects who do not have classical PD.52 Earlier studies have found dopaminergic imaging to be normal in up to 21% of parkinsonian patients enrolled in therapeutic trials.53–56 Such cases have been termed “scans without evidence of dopaminergic deficit (SWEDD)”. Characteristics of these patients with SWEDD include poor l-dopa response, lack of progression on sequential dopaminergic imaging, unlikely diagnosis of PD upon follow-up clinical examination, and withdrawal of antiparkinsonian medication without an observable worsening of symptoms.54,57 In fact, with FDG PET, we found that patterns of metabolic abnormality in the patients with SWEDD were inconsistent with classical PD, as well as MSA, PSP, and CBGD, the most common atypical neurodegenerative parkinsonian variant conditions.52
SUMMARY
The identification and prospective validation of characteristic disease-related spatial covariance patterns has enabled investigators to develop automated computational procedures to differentiate between PD and atypical forms of parkinsonism. These new diagnostic approaches are potentially more objective and have broader applicability than routine radiological assessments. Likewise, the evaluation of changes in pattern expression following treatment may provide a useful means of assessing the utility of new therapeutic agents for PD and related disorders.
Acknowledgments
The work reported in this review was funded in part by NIH NINDS R01 35069, P50 NS 38370, The General Clinical Research Center of the NS-LIJ Health System (NIH RR M01 018535), Neurologix Inc., and the Parkinson’s Disease Foundation.
Footnotes
Potential confict of interest: None reported.
REFERENCES
- 1.Mata M, Fink DJ, Gainer H, et al. Activity-dependent energy metabolism in rat posterior pituitary primarily reflects sodium pump activity. J Neurochem. 1980;34:213–215. doi: 10.1111/j.1471-4159.1980.tb04643.x. [DOI] [PubMed] [Google Scholar]
- 2.Schwartz WJ, Smith CB, Davidsen L, et al. Metabolic mapping of functional activity in the hypothalamo-neurohypophysial system of the rat. Science. 1979;205:723–725. doi: 10.1126/science.462184. [DOI] [PubMed] [Google Scholar]
- 3.Trošt M, Dhawan V, Feigin A, Eidelberg D. PET and SPECT. In: Beal MF, Lang A, Ludolph A, editors. Neurodegenerative diseases: neurobiology pathogenesis and therapeutics. Cambridge University Press; Cambridge: 2005. pp. 290–300. [Google Scholar]
- 4.Habeck C, Stern Y. Neural network approaches and their reproducibility in the study of verbal working memory and Alzheimer’s disease. Clin Neurosci Res. 2007;6:381–390. doi: 10.1016/j.cnr.2007.05.004. [DOI] [PMC free article] [PubMed] [Google Scholar]
- 5.Alexander GE, Moeller JR. Application of the scaled subprofile model to functional imaging in neuropsychiatric disorders: a principal component approach to modeling brain function in disease. Hum Brain Mapp. 1994;2:1–16. [Google Scholar]
- 6.Feigin A, Kaplitt MG, Tang C, et al. Modulation of metabolic brain networks after subthalamic gene therapy for Parkinson’s disease. Proc Natl Acad Sci USA. 2007;104:19559–19564. doi: 10.1073/pnas.0706006104. [DOI] [PMC free article] [PubMed] [Google Scholar]
- 7.Feigin A, Tang C, Ma Y, et al. Thalamic metabolism and symptom onset in preclinical Huntington’s disease. Brain. 2007;130:2858–2867. doi: 10.1093/brain/awm217. [DOI] [PMC free article] [PubMed] [Google Scholar]
- 8.Trošt M, Carbon M, Edwards C, et al. Primary dystonia: is abnormal functional brain architecture linked to genotype? Ann Neurol. 2002;52:853–856. doi: 10.1002/ana.10418. [DOI] [PubMed] [Google Scholar]
- 9.Eckert T, Tang C, Eidelberg D. Assessment of the progression of Parkinson’s disease: a metabolic network approach. Lancet Neurol. 2007;6:926–932. doi: 10.1016/S1474-4422(07)70245-4. [DOI] [PMC free article] [PubMed] [Google Scholar]
- 10.Eidelberg D, Moeller JR, Ishikawa T, et al. Early differential diagnosis of Parkinson’s disease with 18F-fluorodeoxyglucose and positron emission tomography. Neurology. 1995;45:1995–2004. doi: 10.1212/wnl.45.11.1995. [DOI] [PubMed] [Google Scholar]
- 11.Moeller JR, Nakamura T, Mentis MJ, et al. Reproducibility of regional metabolic covariance patterns: comparison of four populations. J Nucl Med. 1999;40:1264–1269. [PubMed] [Google Scholar]
- 12.Feigin A, Antonini A, Fukuda M, et al. Tc-99m ethylene cysteinate dimer SPECT in the differential diagnosis of parkinsonism. Mov Disord. 2002;17:1265–1270. doi: 10.1002/mds.10270. [DOI] [PubMed] [Google Scholar]
- 13.Eckert T, Van Laere K, Tang C, et al. Quantification of Parkinson’s disease-related network expression with ECD SPECT. Eur J Nucl Med Mol Imaging. 2007;34:496–501. doi: 10.1007/s00259-006-0261-9. [DOI] [PubMed] [Google Scholar]
- 14.Ma Y, Tang C, Spetsieris PG, Dhawan V, Eidelberg D. Abnormal metabolic network activity in Parkinson’s disease: test–retest reproducibility. J Cereb Blood Flow Metab. 2007;27:597–605. doi: 10.1038/sj.jcbfm.9600358. [DOI] [PMC free article] [PubMed] [Google Scholar]
- 15.Lozza C, Baron JC, Eidelberg D, Mentis MJ, Carbon M, Marie RM. Executive processes in Parkinson’s disease: FDG-PET and network analysis. Hum Brain Mapp. 2004;22:236–245. doi: 10.1002/hbm.20033. [DOI] [PMC free article] [PubMed] [Google Scholar]
- 16.Asanuma K, Tang C, Ma Y, et al. Network modulation in the treatment of Parkinson’s disease. Brain. 2006;129:2667–2678. doi: 10.1093/brain/awl162. [DOI] [PMC free article] [PubMed] [Google Scholar]
- 17.Huang C, Mattis P, Tang C, Perrine K, Carbon M, Eidelberg D. Metabolic brain networks associated with cognitive function in Parkinson’s disease. Neuroimage. 2007;34:714–723. doi: 10.1016/j.neuroimage.2006.09.003. [DOI] [PMC free article] [PubMed] [Google Scholar]
- 18.Eidelberg D, Moeller JR, Ishikawa T, et al. Assessment of disease severity in parkinsonism with fluorine-18-fluorodeoxyglucose and PET. J Nucl Med. 1995;36:378–383. [PubMed] [Google Scholar]
- 19.Huang C, Tang C, Feigin A, et al. Changes in network activity with the progression of Parkinson’s disease. Brain. 2007;130:1834–1846. doi: 10.1093/brain/awm086. [DOI] [PMC free article] [PubMed] [Google Scholar]
- 20.Carbon M, Edwards C, Eidelberg D. Functional brain imaging in Parkinson’s disease. Adv Neurol. 2003;91:175–181. [PubMed] [Google Scholar]
- 21.Eidelberg D, Moeller JR, Dhawan V, et al. The metabolic topography of parkinsonism. J Cereb Blood Flow Metab. 1994;14:783–801. doi: 10.1038/jcbfm.1994.99. [DOI] [PubMed] [Google Scholar]
- 22.Eidelberg D, Moeller JR, Kazumata K, et al. Metabolic correlates of pallidal neuronal activity in Parkinson’s disease. Brain. 1997;120:1315–1324. doi: 10.1093/brain/120.8.1315. [DOI] [PubMed] [Google Scholar]
- 23.Wichmann T, DeLong MR. Basal ganglia discharge abnormalities in Parkinson’s disease. J Neural Transm Suppl. 2006;70:21–25. doi: 10.1007/978-3-211-45295-0_5. [DOI] [PubMed] [Google Scholar]
- 24.Lin T, Huang C, Tang C, Eidelberg D. Metabolic correlates of subthalamic nucleus activity in Parkinson’s disease. Brain. 2008;131:1373–1380. doi: 10.1093/brain/awn031. [DOI] [PubMed] [Google Scholar]
- 25.Hamani C, Saint-Cyr JA, Fraser J, Kaplitt M, Lozano AM. The subthalamic nucleus in the context of movement disorders. Brain. 2004;127:4–20. doi: 10.1093/brain/awh029. [DOI] [PubMed] [Google Scholar]
- 26.Huang C, Mattis P, Perrine K, Brown N, Dhawan V, Eidelberg D. Metabolic abnormalities associated with mild cognitive impairment in Parkinson’s disease. Neurology. 2008;70:1470–1477. doi: 10.1212/01.wnl.0000304050.05332.9c. [DOI] [PMC free article] [PubMed] [Google Scholar]
- 27.Eckert T, Eidelberg D. Neuroimaging and therapeutics in movement disorders. NeuroRx. 2005;2:361–371. doi: 10.1602/neurorx.2.2.361. [DOI] [PMC free article] [PubMed] [Google Scholar]
- 28.Feigin A, Fukuda M, Dhawan V, et al. Metabolic correlates of levodopa response in Parkinson’s disease. Neurology. 2001;57:2083–2088. doi: 10.1212/wnl.57.11.2083. [DOI] [PubMed] [Google Scholar]
- 29.Hilker R, Voges J, Thiel A, et al. Deep brain stimulation of the subthalamic nucleus versus levodopa challenge in Parkinson’s disease: measuring the on- and off-conditions with FDG-PET. J Neural Transm. 2002;109:1257–1264. doi: 10.1007/s00702-002-0696-5. [DOI] [PubMed] [Google Scholar]
- 30.Berding G, Odin P, Brooks DJ, et al. Resting regional cerebral glucose metabolism in advanced Parkinson’s disease studied in the off and on conditions with [(18)F]FDG-PET. Mov Disord. 2001;16:1014–1022. doi: 10.1002/mds.1212. [DOI] [PubMed] [Google Scholar]
- 31.Stefani A, Lozano AM, Peppe A, et al. Bilateral deep brain stimulation of the pedunculopontine and subthalamic nuclei in severe Parkinson’s disease. Brain. 2007;130:1596–1607. doi: 10.1093/brain/awl346. [DOI] [PubMed] [Google Scholar]
- 32.Broussolle E, Cinotti L, Pollak P, et al. Relief of akinesia by apomorphine and cerebral metabolic changes in Parkinson’s disease. Mov Disord. 1993;8:459–462. doi: 10.1002/mds.870080407. [DOI] [PubMed] [Google Scholar]
- 33.Wooten GF, Collins RC. Effects of dopaminergic stimulation on functional brain metabolism in rats with unilateral substantia nigra lesions. Brain Res. 1983;263:267–275. doi: 10.1016/0006-8993(83)90319-0. [DOI] [PubMed] [Google Scholar]
- 34.Guigoni C, Li Q, Aubert I, et al. Involvement of sensorimotor, limbic, and associative basal ganglia domains in l-3,4-dihydroxyphenylalanine-induced dyskinesia. J Neurosci. 2005;25:2102–2107. doi: 10.1523/JNEUROSCI.5059-04.2005. [DOI] [PMC free article] [PubMed] [Google Scholar]
- 35.Papa SM, Desimone R, Fiorani M, Oldfield EH. Internal globus pallidus discharge is nearly suppressed during levodopa-induced dyskinesias. Ann Neurol. 1999;46:732–738. doi: 10.1002/1531-8249(199911)46:5<732::aid-ana8>3.0.co;2-q. [DOI] [PubMed] [Google Scholar]
- 36.Boraud T, Bezard E, Guehl D, Bioulac B, Gross C. Effects of l-DOPA on neuronal activity of the globus pallidus externalis (GPe) and globus pallidus internalis (GPi) in the MPTP-treated monkey. Brain Res. 1998;787:157–160. doi: 10.1016/s0006-8993(97)01563-1. [DOI] [PubMed] [Google Scholar]
- 37.Su PC, Ma Y, Fukuda M, et al. Metabolic changes following subthalamotomy for advanced Parkinson’s disease. Ann Neurol. 2001;50:514–520. doi: 10.1002/ana.1232. [DOI] [PubMed] [Google Scholar]
- 38.Trošt M, Su PC, Barnes A, et al. Evolving metabolic changes during the first postoperative year after subthalamotomy. J Neurosurg. 2003;99:872–878. doi: 10.3171/jns.2003.99.5.0872. [DOI] [PubMed] [Google Scholar]
- 39.Bevan MD, Magill PJ, Terman D, Bolam JP, Wilson CJ. Move to the rhythm: oscillations in the subthalamic nucleus-external globus pallidus network. Trends Neurosci. 2002;25:525–531. doi: 10.1016/s0166-2236(02)02235-x. [DOI] [PubMed] [Google Scholar]
- 40.Levy R, Ashby P, Hutchison WD, Lang AE, Lozano AM, Dos-trovsky JO. Dependence of subthalamic nucleus oscillations on movement and dopamine in Parkinson’s disease. Brain. 2002;125:1196–1209. doi: 10.1093/brain/awf128. [DOI] [PubMed] [Google Scholar]
- 41.Trošt M, Su S, Su P, et al. Network modulation by the subthalamic nucleus in the treatment of Parkinson’s disease. Neuroimage. 2006;31:301–307. doi: 10.1016/j.neuroimage.2005.12.024. [DOI] [PMC free article] [PubMed] [Google Scholar]
- 42.Hilker R, Voges J, Weisenbach S, et al. Subthalamic nucleus stimulation restores glucose metabolism in associative and limbic cortices and in cerebellum: evidence from a FDG-PET study in advanced Parkinson’s disease. J Cereb Blood Flow Metab. 2004;24:7–16. doi: 10.1097/01.WCB.0000092831.44769.09. [DOI] [PubMed] [Google Scholar]
- 43.Meissner W, Guigoni C, Cirilli L, et al. Impact of chronic subthalamic high-frequency stimulation on metabolic basal ganglia activity: a 2-deoxyglucose uptake and cytochrome oxidase mRNA study in a macaque model of Parkinson’s disease. Eur J Neurosci. 2007;25:1492–1500. doi: 10.1111/j.1460-9568.2007.05406.x. [DOI] [PubMed] [Google Scholar]
- 44.Volkmann J. Deep brain stimulation for the treatment of Parkinson’s disease. J Clin Neurophysiol. 2004;21:6–17. doi: 10.1097/00004691-200401000-00003. [DOI] [PubMed] [Google Scholar]
- 45.Kaplitt MG, Feigin A, Tang C, et al. Safety and tolerability of gene therapy with an adeno-associated virus (AAV) borne GAD gene for Parkinson’s disease: an open label, phase I trial. Lancet. 2007;369:2097–2105. doi: 10.1016/S0140-6736(07)60982-9. [DOI] [PubMed] [Google Scholar]
- 46.Tolosa E, Wenning G, Poewe W. The diagnosis of Parkinson’s disease. Lancet Neurol. 2006;5:75–86. doi: 10.1016/S1474-4422(05)70285-4. [DOI] [PubMed] [Google Scholar]
- 47.Eckert T, Eidelberg D. The role of functional neuroimaging in the differential diagnosis of idiopathic Parkinson’s disease and multiple system atrophy. Clin Auton Res. 2004;14:84–91. doi: 10.1007/s10286-004-0167-1. [DOI] [PubMed] [Google Scholar]
- 48.Antonini A, Kazumata K, Feigin A, et al. Differential diagnosis of parkinsonism with [18F]fluorodeoxyglucose and PET. Mov Disord. 1998;13:268–274. doi: 10.1002/mds.870130212. [DOI] [PubMed] [Google Scholar]
- 49.Eckert T, Barnes A, Dhawan V, et al. FDG PET in the differential diagnosis of Parkinsonian disorders. Neuroimage. 2005;26:912–921. doi: 10.1016/j.neuroimage.2005.03.012. [DOI] [PubMed] [Google Scholar]
- 50.Eckert T, Tang C, Ma Y, et al. Abnormal metabolic networks in atypical parkinsonism. Mov Disord. 2008;23:727–733. doi: 10.1002/mds.21933. [DOI] [PubMed] [Google Scholar]
- 51.Spetsieris PG, Ma Y, Dhawan V, Eidelberg D. Differential diagnosis of parkinsonian syndromes using functional PCA-based imaging features. NeuroImage. 2009;45:1241–1252. doi: 10.1016/j.neuroimage.2008.12.063. [DOI] [PubMed] [Google Scholar]
- 52.Eckert T, Feigin A, Lewis DE, Dhawan V, Frucht S, Eidelberg D. Regional metabolic changes in Parkinsonian patients with normal dopaminergic imaging. Mov Disord. 2007;22:167–173. doi: 10.1002/mds.21185. [DOI] [PubMed] [Google Scholar]
- 53.Whone AL, Watts RL, Stoessl AJ, et al. Slower progression of Parkinson’s disease with ropinirole versus levodopa: the REAL-PET study. Ann Neurol. 2003;54:93–101. doi: 10.1002/ana.10609. [DOI] [PubMed] [Google Scholar]
- 54.Fahn S, Oakes D, Shoulson I, et al. Levodopa and the progression of Parkinson’s disease. N Engl J Med. 2004351:2498–2508. doi: 10.1056/NEJMoa033447. [DOI] [PubMed] [Google Scholar]
- 55.Parkinson Study Group Dopamine transporter brain imaging to assess the effects of pramipexole vs levodopa on Parkinson disease progression. JAMA. 2002;287:1653–1661. doi: 10.1001/jama.287.13.1653. [DOI] [PubMed] [Google Scholar]
- 56.Seibyl J, Jennings D, Tabamo R, Marek K. The role of neuroimaging in the early diagnosis and evaluation of Parkinson’s disease. Minerva Med. 2005;96:353–364. [PubMed] [Google Scholar]
- 57.Marshall VL, Patterson J, Hadley DM, Grosset KA, Grosset DG. Successful antiparkinsonian medication withdrawal in patients with Parkinsonism and normal FP-CIT SPECT. Mov Disord. 2006;21:2247–2250. doi: 10.1002/mds.21159. [DOI] [PubMed] [Google Scholar]
- 58.Fukuda M, Mentis MJ, Ma Y, et al. Networks mediating the clinical effects of pallidal brain stimulation for Parkinson’s disease: a PET study of resting-state glucose metabolism. Brain. 2001;124:1601–1609. doi: 10.1093/brain/124.8.1601. [DOI] [PubMed] [Google Scholar]