

Highlights
-
•
Youth-onset severe obesity warrants particular concern in urban female populations.
-
•
Among 2226 girls, prevalence was 8.3% at age 7–10, 10.8% at age 12–15 and fairly stable over teen years.
-
•
Severe obesity prevalence increased more rapidly with age for girls born in 1995 versus 1992.
-
•
Severely obese girls' BMI grew 2.6 times as fast as normal-BMI peers in the transition to adolescence.
-
•
Late childhood and early adolescence is a key developmental window for prevention and treatment.
Keywords: Obesity, Adolescent, Urban health, Epidemiology, Body weight, Longitudinal studies
Abbreviations: BMI, body mass index; CFI, comparative fit index; CI, confidence Interval; CVRF, cardiovascular risk factors; EM, expectation maximization algorithm; LGCMs, unconditional latent growth curve models; PGS, Pittsburgh Girls Study; RMSEA, root mean-square error of approximation; SD, standard deviation; TLI, Tucker–Lewis index
Abstract
Objective
To understand the incidence and persistence of severe obesity (≥1.2 × 95th BMI percentile-for-age) in girls across the transition to adolescence, and map developmental trajectories of adolescent severe obesity in a high-risk sample.
Methods
We examined ten years of prospectively collected data from a population sample of urban girls (n = 2226; 53% African American, aged 7–10 in 2003–2004). We determined severe obesity prevalence and incidence by age. Logistic regression evaluated for secular trend in the association between age and severe obesity prevalence. Unconditional latent growth curve models (LGCMs) compared BMI development through the adolescence transition between girls with severe obesity versus healthy BMI.
Results
Severe obesity prevalence was 8.3% at age 7–10 and 10.1% at age 16–19 (white: 5.9%; African American: 13.2%; p < 0.001). Age-specific prevalence increased more rapidly among the latest-born, versus earliest-born, girls (p = 0.034). Incidence was 1.3% to 2.4% annually. When we compared 12–15 year-old girls with severe obesity versus healthy BMI, average body weight was already distinct 5 years earlier (16.5 kg versus 25.7 kg; p < 0.001) and the BMI difference between groups increased annually. LGCMs between ages 7–10 and 11–14 indicated an increase of 3.32 kg/m2 in the healthy-BMI group and 8.50 kg/m2 in the severe obesity group, a 2.6-fold difference.
Conclusions
Youth-onset severe obesity warrants particular concern in urban girls due to high prevalence and an increasing secular prevalence trend. Late childhood and early adolescence may represent a key developmental window for prevention and treatment, but is too late to prevent youth-onset severe obesity entirely.
Introduction
Between 1976–1980 and 1999–2004, the prevalence of severe obesity in US youth aged 2–19 years more than tripled [1], [2]. Over the same time frame, severe obesity prevalence increased disproportionately among the poor [1], [2]. One recent analysis shows that among major racial/ethnic groups, non-Hispanic black girls, aged 12–19 years, have the highest prevalence (12.6%; SE 1.0) [2]. Prevalence estimates for non-Hispanic white girls and Hispanic girls of the same age were 4.8% (SE 0.8) and 6.3% (SE 0.8), respectively [2]. Since poor and minority youth are not only at particular risk for severe obesity, but are also likely to lack resources for treatment, an understanding of the natural history of severe obesity in that group is critical as a first step towards prevention strategies.
As youth-onset severe obesity prevalence has risen, its definition has been in flux. In 2007, an expert committee defined severe childhood obesity as a body mass index (BMI) ≥ 99th percentile-for-age, calculated by extrapolation from CDC growth charts [3]. However, since then, an alternative approach of defining severe obesity (≥120% of the 95th percentile-for-age) has been widely adopted [2], [4], [5], [6], [7]. It provides a better fit to empirical 99th BMI percentile values than do 99th percentile values extrapolated from the CDC growth chart lambda-mu-sigma parameters. In addition, the definition based on 120% of the 95th percentile-for age avoids the concern that CDC growth-chart values above the 97th percentile are beyond the range of the data from which growth chart parameters were calculated [8].
National data from 1999 to 2004 show that among youth aged 5–17 years with BMI ≥99th percentile-for-age, 59% exhibited at least 2 cardiovascular risk factors (CVRF) and 11% at least 4 CVRF. For those with BMI in the general obesity range (≥95th percentile-for-age), the corresponding estimates were substantially lower at 39% and 5% [9]. Furthermore, over 30% of US youth with BMI ≥99th percentile-for-age have findings consistent with the metabolic syndrome, versus only 13–17% of youth with a BMI-for-age in the 95–97th percentile (p ≤ 0.04) [1]. They also show significantly higher systolic and diastolic blood pressure, insulin, and liver function tests, along with lower HDL cholesterol [1]. Youth-onset severe obesity (BMI≥1.2 × 95th percentile-for-age), has likewise been cross-sectionally associated with gallstone disease [6], fatigue and diminished mobility [7]. Furthermore, youth-onset severe obesity may be unlikely to reverse; in one analysis of severely obese children, 100% of individuals with adult follow-up data were found to be obese and 65% to have extreme obesity (BMI ≥ 40 kg/m2) in adulthood [9]. In another sample, 70.5% of severely obese adolescents remained severely obese in adulthood [10]. This persistence of adolescent severe obesity into adulthood heightens concerns for long-term health implications because adult severe obesity is linked with numerous adverse outcomes, including mortality, coronary heart disease, hypertension, diabetes and poor physical health-related quality of life [11], [12], [13].
Common weight management practices for overweight and obesity are less effective for severe obesity, suggesting that prevention is essential [14]. Yet longitudinal data on how severe obesity develops – essential for informing preventive interventions – are lacking. Furthermore, published studies have aggregated data across a wide range of ages, so the timing of youth-onset severe obesity is poorly understood beyond its incidence prior to adulthood. To better understand the development and health implications of youth-onset severe obesity, we examined a population-based sample of urban US girls. We (a) estimated prevalence and incidence rates of severe obesity and determined the persistence of severe obesity in late childhood and early adolescence in a population of particular importance for cardiovascular prevention, due to high lifetime risk for severe obesity and weight-related health complications; (b) examined for a secular trend in youth-onset severe obesity, as an indicator of how rapidly the development of extreme body weight in youth has shifted; (c) compared rates of increase in weight development across early adolescence from ages 7 to 10 among girls who were severely obese, versus those with BMI in the healthy range, at 12–15 years of age; and (d) investigated the role of poverty in accelerated weight development in girls.
Methods
Sample description
The Pittsburgh Girls Study (PGS; n = 2451) comprises urban girls aged 5–8 upon initial assessment (2000–2001) and their primary caretakers [15]. They have been followed annually since enrollment. Low income urban neighborhoods in Pittsburgh were oversampled; neighborhoods in which at least 25% of families were living at or below poverty level were fully enumerated and approximately 50% of households in other neighborhoods in Pittsburgh were randomly selected for enumeration. Overall, 83.7% of girls listed by the US Census were identified. Analyses presented here use 10 annual data waves collected from wave 3 (ages 7–10; the first year with weight measurement) to wave 12 (ages 16–19). We excluded 225 PGS participants: 114 did not complete the PGS wave 3 survey and an additional 111 did not provide wave 3 weight data. Of our sample (n = 2226), on average, 92.6% (range: 88.0% to 97.3%) completed a PGS interview and 86.5% (range: 75.8% to 94.4%) provided data for BMI calculations annually in waves 4–12.
Data collection
Separate in-home interviews for girls and caretakers were conducted annually by trained interviewers. Interviewers also measured girls' height and weight. Families were compensated for their participation. Study procedures were approved by the University of Pittsburgh Institutional Review Board.
Measures
Caregivers' report of several demographic variables were assessed in wave 3: girl's age and race, family poverty (i.e., receipt of public assistance), whether the girl lived in a single-parent household, and caregiver education. Girls' BMI was calculated from annually measured height and weight. Weight data were excluded for any data wave in which a girl was pregnant. National reference data were used to calculate BMI-for-age percentiles and then determine age-and sex-specific weight status: underweight (<5th percentile); healthy weight (5th percentile to <85th percentile); overweight (85th to <95th percentile); obese (≥95th percentile) [16]. We used the ≥120% of the 95th percentile-for-age definition for severe obesity in these analyses, due to measurement advantages described above, widespread adoption [2], [4], [5], [6], [7], and clinical relevance [17]. Girls who were obese, but not severely obese, were categorized as mild/moderately obese.
Analytic plan
We examined wave 3 (baseline; age 7–10) descriptive statistics for the full sample and for those girls with wave 8 (age 12–15) BMI in the healthy or severely obese ranges (the LGCM subgroup). To capitalize on the richness of the repeated measures data, we used several approaches to examine the development of severe obesity in this cohort. Prevalence and incidence of severe obesity in each of ten annual sample waves (waves 3–12) were calculated for the sample. To examine for a secular trend in weight development, we examined mean BMI and severe obesity prevalence for girls in the oldest and youngest birth cohorts. For this analysis, we fit a quadratic regression to the mean BMI by age with a cohort interaction using random effects modeling, and a logistic regression to severe obesity with a linear trend and a cohort interaction. To examine the persistence of severe obesity in childhood, we identified the girls who were severely obese in wave 3 (age 7–10), and (a) estimated the prevalence of severe obesity in this group annually through wave 12 (age 16–19) then (b) examined the distribution of body weight categories in this group in wave 12.
We examined weight development specifically across the transition to adolescence, comparing girls in wave 8 (12–15 years) who had (a) severe obesity or (b) healthy BMI. We compared demographic variables between the two groups at ages 7–10 and 12–15. We used logistic regression to assess for a cross-sectional relationship between family poverty and severe obesity, modeling the outcome of severe obesity at wave 8 (versus healthy BMI) as a function of race and family poverty in wave 3. Unconditional latent growth curve models (LGCMs) characterized the developmental trajectories of girls' BMI separately for the two weight-defined groups across waves 3–7. These models were estimated using a robust maximum likelihood estimator in Mplus 5.2 [18]. Missing data on dependent variables were handled with the expectation maximization (EM) algorithm. Model fit was evaluated using the χ2 goodness of fit test, comparative fit index (CFI), Tucker–Lewis index (TLI), and root-mean-square error of approximation (RMSEA). For CFI and TLI, we used the conventional cutoff ≥0.90 for acceptable fit, and ≥0.95 for good fit. RMSEA values between 0.05 and 0.08 represent acceptable fit, while values <0.05 indicate good fit [19]. Girls who became pregnant between waves 3–8 were excluded from this analysis.
To assess any bias in our estimates due to missing data, for each age between 9 and 20, we identified individuals with and without BMI data, and compared them in terms of prior-year BMI. The PGS sampling design requires the use of sampling weights if we were to generalize to all Pittsburgh girls in this age range. Our primary goal was to understand weight development in areas with a high proportion of disadvantaged girls which is more aligned with un-weighted analyses. Weighted incidence and prevalence analyses were conducted but did not have an impact on estimates or inference (see Supplementary Materials). Therefore, for simplicity, we present un-weighted analyses here.
LGCM analyses were completed using Mplus 5.2, Los Angeles, CA. All other analyses used Stata 12.1, College Station, TX.
Results
Sample description
At baseline, the sample's mean age was 9.1 (SD =1.3) in wave 3, with primarily white (40.7%) or African American (53.4%) race and 30.8% of families received public assistance (Table 1). Over 40% of girls were in single-parent households and approximately half of caregivers had 12 or fewer years of education. The mean BMI was 18.8 (SD 4.4) and over 30% of the sample was overweight or obese (≥85th percentile-for-age). BMI values for responders and non-responders differed only at ages 14 and 15 (see Supplementary Materials), suggesting that any impact of body size on study retention was minimal.
Table 1.
Sample description at baseline (wave 3; ages 7–10; sample year 2003–2004)b
| Variable | Full sample (n = 2226) | Girls with severe obesity in Wave 8 (N = 209) | Girls with healthy BMI in Wave 8 (N = 1076) | p-valuea |
|---|---|---|---|---|
| Mean (SD) or n (%) | Mean (SD) or n (%) | Mean (SD) or n (%) | ||
| Age [years; mean (SD)] | 9.1 (1.3) | 9.0 (1.3) | 9.1 (1.3) | 0.241 |
| Race [n (%)] | <0.001 | |||
| White | 905 (40.7) | 51 (24.4) | 496 (46.1) | |
| African American | 1189 (53.4) | 147 (70.3) | 525 (48.8) | |
| Asian | 16 (0.72) | 0 (0.0) | 6 (0.6) | |
| Multi-racial | 113 (5.1) | 11 (5.3) | 48 (4.5) | |
| Other | 0 (0) | 0 (0.0) | 0 (0.0) | |
| Not reported | 3 (0.13) | 0 (0.0) | 1 (0.1) | |
| Family poverty [n (%)] | 685 (30.8) | 74 (35.4) | 321 (29.8) | 0.110 |
| Weight status [n (%)]c | <0.001 | |||
| Underweight | 79 (3.6) | 0 (0.0) | 55 (5.1) | |
| Healthy weight | 1398 (62.8) | 11 (5.2) | 929 (86.3) | |
| Overweight | 341 (15.3) | 25 (12.0) | 74 (6.9) | |
| Mild/Moderately obese | 223 (10.0) | 57 (27.3) | 14 (1.3) | |
| Severely obese | 185 (8.3) | 116 (55.5) | 4 (0.37) | |
| Single parent caregivera [n (%)] | 962 (43.3) | 108 (51.7) | 429 (39.9) | 0.002 |
| Caregiver education ≤ 12 years [n (%)]b | 1069 (48.0) | 103 (49.3) | 509 (47.3) |
Comparison between girls with severe obesity in Wave 8 and girls with healthy BMI in wave 8; t-test used for age; chi-squared test for all else.
Data are shown for the full sample and for the 2 subgroups (identified according to BMI in wave 8) analyzed with latent growth curve models.
Among those with obesity (≥95th percentile-for-age), girls with BMI ≥1.2 × 95th BMI percentile-for-age are categorized as severely obese and all others are categorized as mild/moderately obese.
Incidence, prevalence and persistence of severe obesity
Annual incidence rates for severe obesity ranged from 129 to 241 cases per 10 000 person-years (Table 2). In wave 3 (age 7–10), 8.3% of girls were severely obese. Prevalence increased in late childhood, but stayed relatively stable at about 10% as the participants moved through their teenage years. For example, in wave 8 (age 12–15), 10.8% were severely obese (white: 6.6%; African American: 14.1%, p < 0.001) while in wave 12 (age 16–19), 10.1% were severely obese (white: 5.9%; African American: 13.2%, p < 0.001). A large proportion of severe obesity cases were persistent. When the sample was aged 16–19, 55.9% of severely obese girls had also been severely obese in wave 3.
Table 2.
Incidence and prevalence rates of severe obesity (≥1.2 × 95th BMI percentile-for-age)
| Wave | Age range | # of new cases of severe obesity/# girls at risk | Incidence ratea | Prevalence | ||
|---|---|---|---|---|---|---|
| Among all girls in the sample (n = 2226) | Among girls with severe obesity in wave 3 (n = 185) | |||||
| # with severe obesity/# with BMI data | # with severe obesity in wave 3/# with current severe obesity | # with severe obesity in current wave/# with current BMI data | ||||
| %, (95% CI) | % (95% CI) | % (95% CI) | % (95% CI) | |||
| 3 | 7–10 | b | b | 185/2226 | 185/185 | 185/185 |
| 8.3% (7.2, 9.5) | 100.0% (N/A) | 100.0% (N/A) | ||||
| 4 | 8–11 | 39/1931 | 202 | 183/2101 | 144/183 | 144/170 |
| 2.0%, (1.5, 2.8) | 8.7% (7.6, 10.0) | 78.7% (72, 84) | 84.7% (78, 89) | |||
| 5 | 9–12 | 37/1814 | 204 | 183/2057 | 131/183 | 131/165 |
| 2.0% (1.5, 2.8) | 8.9% (7.7, 10.2) | 71.6% (65, 78) | 79.4% (72, 85) | |||
| 6 | 10–13 | 30/1774 | 169 | 194/2013 | 141/194 | 141/166 |
| 1.7% (1.2, 2.4) | 9.6% (8.4, 11.0) | 72.7% (66, 79) | 84.9% (79, 90) | |||
| 7 | 11–14 | 39/1732 | 225 | 205/1992 | 133/205 | 133/166 |
| 2.3% (1.6, 3.1) | 10.3% (9.0, 11.7) | 64.9% (58, 71) | 80.1% (73, 86) | |||
| 8 | 12–15 | 41/1699 | 241 | 209/1929 | 116/209 | 116/154 |
| 2.4% (1.8, 3.3) | 10.8% (9.5, 12.3) | 55.5% (49, 62) | 75.3% (68, 82) | |||
| 9 | 13–16 | 38/1625 | 234 | 211/1906 | 121/211 | 121/160 |
| 2.3% (1.7, 3.2) | 11.1% (9.7, 12.6) | 57.4% (51, 64) | 75.6% (68, 82) | |||
| 10 | 14–17 | 22/1570 | 140 | 191/1849 | 109/191 | 109/158 |
| 1.4% (0.92, 2.1) | 10.3% (9.0, 11.8) | 57.1% (50, 64) | 69.0% (61, 76) | |||
| 11 | 15–18 | 31/1507 | 206 | 190/1793 | 100/190 | 100/148 |
| 2.1% (1.4, 2.9) | 10.6% (9.3, 12.1) | 52.6% (45, 60) | 67.6% (60, 75) | |||
| 12 | 16–19 | 18/1398 | 129 | 170/1687 | 95/170 | 95/145 |
| 1.3% (0.81, 2.0) | 10.1% (8.7, 11.6) | 55.9% (48, 63) | 65.5% (57, 73) | |||
CI, confidence interval.
Per 10 000 person-years.
Wave 3 was the first year in which anthropometric data were collected so incidence data cannot be calculated.
In the subset of severely obese girls in wave 3 (age 7–10; n = 185), 65.5% to 84.9% of girls' measurements were consistent with severe obesity in each of the next 9 years. Wave 12 BMI data were available for 78% of this subset; of these 145 girls, only 5 (3.5%) had a healthy BMI; 12 (8.3%) were overweight; 33 (22.8%) had mild obesity (95–98th BMI percentile); and 95 (65.5%) were severely obese in wave 12.
Secular trends in BMI and severe obesity development
Among participants from the oldest and youngest birth cohorts, a quadratic regression examining how mean BMI changed with age showed a significant age by birth cohort interaction (p = 0.001), with girls born in the later year having slightly more rapid BMI growth (Fig. 1). Because a non-quadratic term was non-significant, we used a linear model for the secular trend evaluation in severe obesity prevalence. A significant interaction between age and birth cohort was found (p = 0.034), indicating that the later-born girls had higher age-specific growth in severe obesity prevalence. For most annual data points, no significant difference was found for BMI or severe obesity prevalence between the two birth cohorts (Figure 1, Figure 2).
Figure 1.
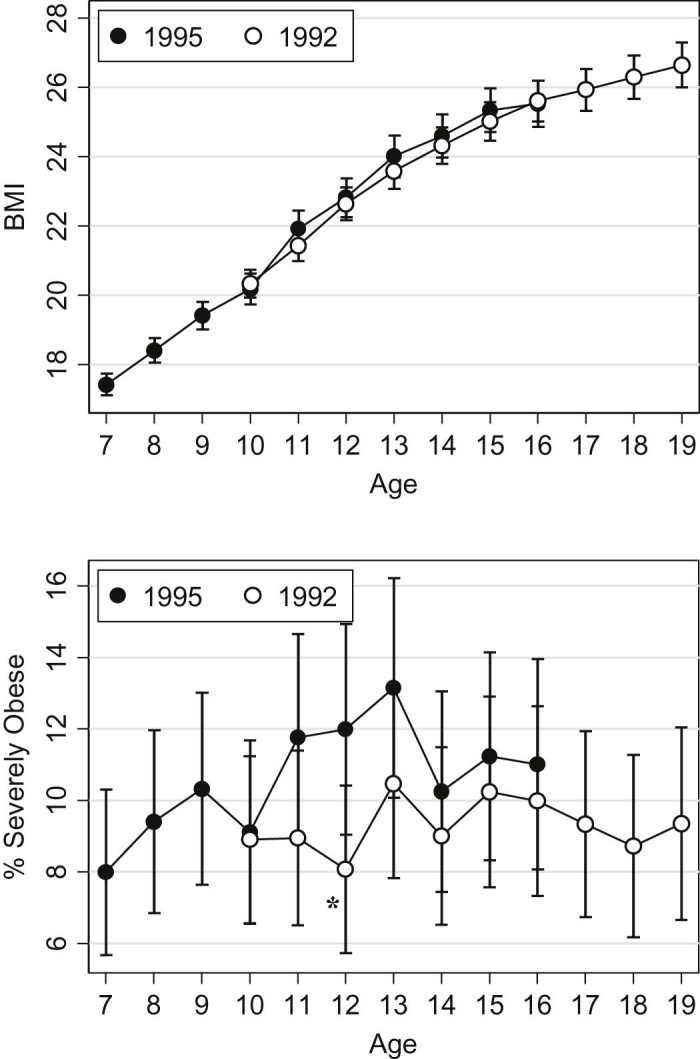
Mean BMI by age and year of birth (top panel) and prevalence of severe obesity for the oldest and youngest birth cohorts (bottom panel). Significant differences between birth cohorts at a given age are indicated with an asterisk (*).
Figure 2.
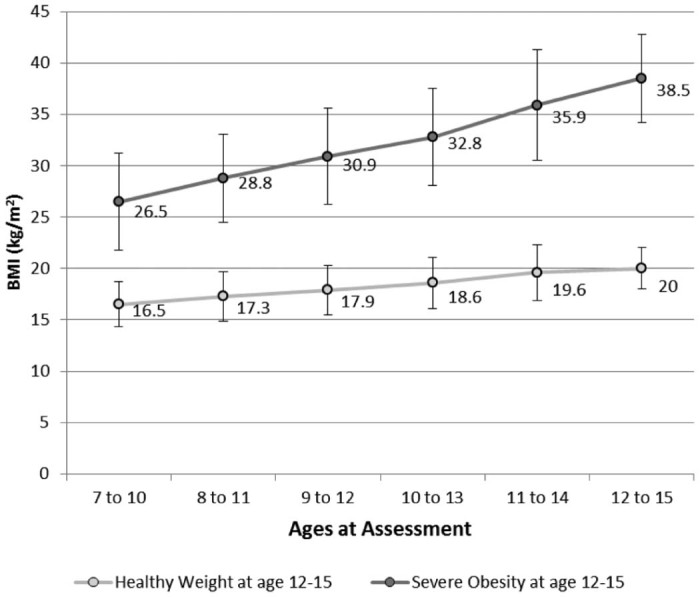
Measured mean BMI across assessment waves among girls with severe obesity in wave 8 (n = 209) and girls with healthy BMI in wave 8 (n = 1076). Error bars denote standard deviation. At each age range, mean BMI was significantly higher (p < 0.001) among the girls with severe obesity at age 12–15 than among those girls with healthy weight at age 12–15.
BMI development among 12–15 year old girls who were severely obese and those with healthy BMI
The average BMI for girls in the wave 8 severe obesity group was 38.5 (SD 4.8) at age 12–15 while for girls in the healthy weight group it was 20.0 (p ≤ 0.001). The severe obesity group also had significantly higher BMI (p < 0.0.001) at each of the five prior annual assessments (Fig. 2). BMI in the two groups was already quite distinct by age 7–10, with an average of 16.5 kg/m2 (SD 2.2) among girls who would have a healthy BMI five years later and 26.5 kg/m2 (SD 4.5) among girls who would be severely obese five years later. The difference in average BMI between the two groups widened with each sample year, from 10.0 kg/m2 in wave 3 (baseline) to 18.5 kg/m2 in wave 8.
The two subsets of girls (severely obese versus healthy BMI) selected based on BMI at wave 8 (age 12–15) did not differ in age, family poverty, or caregiver education at baseline (wave 3; Table 1). However, the racial composition of the two groups differed, with the wave-8 healthy BMI group being 48.8% African American, while the severely obese group was 70.3% African American (p < 0.001). Single-parent households were more common in the severely obese group (51.7% versus 39.9%; p = 0.002). The two groups also differed in wave 3 weight category, with healthy BMI being the predominant wave 3 weight status (86.3%) among girls with a healthy BMI in wave 8, and obesity being the most common wave 3 weight status (82.8%) among girls who were severely obese in wave 8 (p < 0.001).
When we examined the wave 8 demographic features for the two sub-groups (i.e., girls who were severely obese and those with healthy BMI at wave 8), findings were similar to the wave 3 data for most demographic features. However, while family poverty was similar in the two weight groups at age 7–10 (35.4% vs. 29.8%; Table 1), it was significantly more prevalent in the severe obesity group than the healthy weight group at age 12–15 (48.3% vs. 34.5%; p < 0.001). Using logistic regression, we found that the main effects of race and family poverty on weight status were qualified by a significant race by family poverty interaction (p < 0.001). That is, the odds that African American girls were in the severely obese group were 4.4 (CI: 2.89, 6.85) times those of white girls among the participants who did not receive public assistance (p < 0.001) but only 0.82 (CI: 0.46, 1.47; p = 0.507) times as high among those receiving public assistance.
The LGCM for the healthy weight group fit the data well [χ2 (5, n = 1060) = 44.88, p < 0.001; CFI=0.99; TLI=0.97; RMSEA=0.08]. It indicated a mean wave 3 BMI in the healthy range for 9-year old girls (mi=15.74) with an average annual BMI increase of 0.83 kg/m2 (linear ms=0.83, z = 11.82, p < 0.001) and a slight leveling off in growth over time. These findings correspond to a 3.32 kg/m2 average increase in BMI from waves 3 to 7. For a girl with height at the national median value for ages 9 (133.1 cm) and 13 years (157.3 cm) [20], the measured wave 3 BMI of the healthy-weight subgroup and the modeled growth rate would result in weight gain from 29.2 kg to 49.4 kg [21]. These values are similar to the median national female values (29.1 kg and 46.0 kg, respectively) [21].
In the severe obesity group, the LGCM for BMI also fit the data well [χ2 (7, n = 169) = 21.48, p = < 0.01; CFI=0.97; TLI=0.96; RMSEA=0.08]. The model's mean intercept indicates that, on average, girls were obese with a BMI of 24.47 kg/m2 at wave 3 (mi=24.47, z = 63.01, p < 0.001) and the mean linear slope indicates an increase in BMI from wave 3 to wave 7 of, on average, 2.12 kg/m2 per year (ms=2.12, z = 23.82, p < 0.001). A quadratic trend in slope was not significant. The modeled growth rate corresponds to an 8.50 kg/m2 increase from wave 3 to wave 7; 2.6 times the rate of BMI growth seen for the girls in the healthy BMI group. For a girl with median national height at ages 9 (133.1 cm) and 13 years (157.3 cm) [20], the measured wave 3 BMI and modeled growth rate correspond with a weight change from 47.83 kg to 87.79 kg (105.45 lb to 193.54 lb) over 4 years [21].
Discussion
In this predominantly poor, urban female sample, 8.3% were severely obese at age 7–10 and 10.1% were severely obese in late adolescence (age 16–19), with late adolescent prevalence rates of 5.9% and 13.2% among white and African American girls, respectively. These prevalence rates are substantially higher than the 1% (95% CI 0.7–1.4%) reported for adolescents (mean age16.5 years) in 1996 in the US National Longitudinal Study of Adolescent Health (using the same severe obesity definition) [10]. The PGS age 12–15 and age 16–19 race-specific prevalence rates are similar to those found for girls aged 12–19 in the NHANES 1999–2006 sample, despite our use of a more conservative severe obesity definition (the NHANES analysis used BMI ≥120% of the 95th percentile-for-age or ≥35 kg/m2) [2]. Differences in the PGS findings from published nationally representative data are likely to reflect a secular change and the urban and generally under-privileged status of the PGS sample.
Early-onset severe obesity frequently persisted across participants' pre-teen years, with 65.5% of those girls who were severely obese at age 7–10 also classified as severely obese 9 years later. Nearly 12% of severely obese girls were not obese 9 years later; a better understanding of their experiences may help inform future interventions. However, severe obesity incidence was also considerable in this time frame with 1780 (95% CI: 1698–1865) new cases per 10 000 person years over 5 years of follow-up. Furthermore, when growth was compared between girls with severe obesity, versus healthy BMI, in early adolescence, those in the severely obese group already had substantially higher BMI by age 7–10 and showed extremely rapid BMI growth (approximately 2.6 fold the rate of girls in the healthy weight group) over the next five years. The consistency of our findings with weighted or un-weighted analyses suggests that they may generalize to the larger population of girls in Pittsburgh – and potentially others from similar urban settings.
These data are particularly concerning due to the negative health impacts of severe obesity in adolescence [1], [9] and adulthood [11], [12], [13]. The long-term effects of early onset of severe obesity are unknown, but since severe obesity tends to persist, onset in youth may substantially inflate lifetime health risks and costs. In particular, the likelihood of long-term disability among those with early-onset severe obesity is sobering. For example, among severely obese women aged 50–69, the percentage reporting fair or poor health (40.5%), any limitation in their activities of daily living (21.4%) or having health problems that limit their work (45.7%) is substantially higher than among all obese women (24.5%, 10.8% and 27.3% respectively) [22].
A recent publication noting that 4–6% of US youth are severely obese concludes that severe pediatric obesity demands attention and clinical management, citing its profound impact on affected individuals and the significant economic and health service burden it will pose to the health care system [14]. Our findings suggest that even higher levels of concern are warranted for urban girls, especially those who are African American, given their particularly high severe obesity prevalence. The PGS offers a rare opportunity to examine weight development in a population-based sample whose demographics (largely poor, urban, predominantly minority girls) put them among those with the highest risk for obesity-related illness. The long-term follow-up data spanning the time-period of the US obesity epidemic and extraordinarily high adherence rates in such a group (88–100% of our sample completed an interview in each year of these analyses) make the PGS data invaluable for understanding the natural history of severe obesity in this group and lend insight into how to best target those at highest health risks with intervention.
Historically, an inverse relationship has been noted between socioeconomic status and obesity [23], and the BMI gap between low and high-SES individuals in the US has been found to increase across young adulthood [24]. The interaction between race and family poverty that emerged during early adolescence in our sample is consistent with prior literature showing that although an inverse pattern between weight and socioeconomic status is typically found for non-black samples, few data support such a relationship in black samples [25], [26], [27]. Our study suggests that early adolescence is a time at which this racial difference in the patterns between socioeconomic status and severe obesity tends to emerge or become more acute. Further study – particularly qualitative work – is needed to fully understand how socioeconomic status influences weight development and to explain our observation of a racial difference in severe obesity prevalence that is most pronounced among the more affluent urban adolescent girls.
These analyses highlight the salience of research into the etiology and control of severe obesity. For example, obese individuals are typically leptin-resistant [28]; cross-sectional data in adults and children show positive relationships between adiposity and serum leptin [29], [30], and leptin (but not adiponectin) levels are higher in severely obese youth than those with mild/moderate obesity [5]. Furthermore, among children with high risk for adult obesity, higher levels of baseline leptin can predict increased BMI and increased total body fat mass [31], suggesting that severely obese youth may be at high risk for future weight gain. A better understanding of the genetics of severe obesity is also necessary. Although genetic predisposition contributes to severe obesity risk [32], [33], [34], most known genomic markers have small effects on body weight or on the risk of obesity (i.e., relative risks of 1.1–1.4), so are not useful in identifying individuals or families at higher risk for obesity for specific preventive or treatment intervention [35]. This may signal research opportunities as the clinical spectrum associated with one or more obesity genes may be broader than what is currently suspected, or one or more key causal genes may not yet be identified or recognized as contributing to severe obesity [36].
Limitations of this study include the fact that it reflects a single geographic region, and weight development may differ with regional cultural patterns of eating and physical activity. In addition, we are unable to conduct race-specific growth curve modeling due to sample size limitations. As with all longitudinal studies, some data are missing, but the retention rate in the PGS sample is remarkably high given the follow-up duration. While, at two ages, girls with missing (versus available) anthropometric data had slightly higher mean BMI, such a pattern was not consistent over the ages examined here. Furthermore, any tendency for heavier girls to have missing BMI data would bias the results in a conservative fashion, resulting in under-estimates of severe obesity prevalence since the mixed models we used are valid when missingness is at random. Research is needed to evaluate whether hormone-related factors such as sex hormone-binding globulin, childhood insulin and polycystic ovary syndrome influence youth-onset severe obesity; all have been linked with severe obesity in young adulthood [37]. One proposed revision to the definition of severe youth obesity uses a cut-point including both BMI ≥120% of the 95th percentile-for-age or an absolute BMI ≥ 35 kg/m2 (whichever is lower) [14]. Since the inclusion of BMI ≥35 into the definition lowers the threshold for severe obesity for girls aged approximately 16 or above [14], it would minimally impact most of our analyses (e.g., most rates and all modeling were limited to girls under the age of 16). Including BMI ≥35 in the definition of severe obesity, however, might reduce or eliminate the apparent decline in severe obesity prevalence that we saw in the secular trend analysis for girls over the age of 17.
Effective individual-based or public health approaches for childhood obesity are lacking [4], despite extensive efforts in the development and implementation of childhood and adolescent weight management programs over the past decade. Intervention effect sizes have typically been modest or even negligible [38], [39], and data specifically focusing on individuals with the most severe obesity are limited [40]. However, available data suggest that treatment is less effective in this group [14]. Bariatric surgery can lead to substantial weight loss for adolescents [41], but carries a low risk of serious harm, along with high costs in dollars and healthcare resources. As bariatric surgery was only recently approved for youth, its long-term risks are unknown [41] and weight regain is common in adult bariatric populations [42]. Relying on such an expensive and invasive approach for treating what is now a relatively common problem in youth seems an imprudent societal strategy. Innovative, cost-effective strategies for prevention and treatment for youth-onset obesity, particularly severe obesity, are sorely needed [4], [14].
Our findings indicate that severe obesity is now prevalent at a very young age among urban girls: approximately 10% of girls in this sample were severely obese by age 11–14, with prevalence remaining 10–11% over the next 5 years. Furthermore, severely obese girls age 12–15 had experienced extraordinarily rapid BMI gain over the prior five years, and later-born girls had higher age-specific growth in severe obesity prevalence compared with earlier-born girls in the sample. These findings are a troubling counter-balance to any recent reassurance offered by a leveling off of obesity prevalence in US youth [43]. They suggest that among youth with some of the highest lifetime weight-related health risk – urban, under-privileged girls – it is not enough to monitor obesity prevalence alone as an indicator of body weight and future weight-related morbidity. Severe obesity should also be addressed. Our data suggest that childhood and early adolescence represent an important developmental window in which to prevent or treat severe obesity, particularly in poor and minority female populations.
Funding
This work was supported by grants from the National Institutes of Health (MH 081071 and MH056630). The sponsor had no role in the study design, collection, analysis or interpretation of data, writing of the report, or decision to submit the manuscript for publication.
Author contributions
This manuscript has 7 authors, who have all played an active role in the development of the analysis. Drs. McTigue, Stepp and Moore planned the analyses; Dr. McTigue drafted the manuscript; and Dr. Stepp ran the latent growth curve models. Mr. Cohen ran the statistics for the prevalence and incidence data, under the supervision of Dr. Moore. Drs. Hipwell, Loeber and Stepp oversaw the collection of the survey data from the main Pittsburgh Girls' Study (PGS) while Dr. McTigue planned and managed anthropometric measurements in the PGS sample with guidance from Dr. Kuller. All co-authors contributed substantive edits to the manuscript during the writing and revision process. Everyone who contributed significantly to the work is listed as an author.
Conflict of interest
The authors have no potential conflicts of interest to declare. All authors have approved the final article.
Acknowledgment
The authors greatly appreciate the support of the PGS staff and study participants.
Footnotes
Supplementary data to this article can be found online at doi:10.1016/j.jcte.2015.04.001.
Appendix. Supplementary material
The following is the supplementary data to this article:
Tables S1–S3.
References
- 1.Skelton J.A., Cook S.R., Auinger P., Klein J.D., Barlow S.E. Prevalence and trends of severe obesity among US children and adolescents. Acad Pediatr. 2009;9(5):322–329. doi: 10.1016/j.acap.2009.04.005. [DOI] [PMC free article] [PubMed] [Google Scholar]
- 2.Claire Wang Y., Gortmaker S.L., Taveras E.M. Trends and racial/ethnic disparities in severe obesity among US children and adolescents, 1976–2006. Int J Pediatr Obes. 2011;6(1):12–20. doi: 10.3109/17477161003587774. [DOI] [PubMed] [Google Scholar]
- 3.Barlow S.E. Expert committee recommendations regarding the prevention, assessment, and treatment of child and adolescent overweight and obesity: summary report. Pediatrics. 2007;120(Suppl. 4):S164–92. doi: 10.1542/peds.2007-2329C. [DOI] [PubMed] [Google Scholar]
- 4.Dietz W.H. Implications of the energy gap for the prevention and treatment of childhood obesity. Am J Prev Med. 2012;42(5):560–561. doi: 10.1016/j.amepre.2012.02.001. [DOI] [PubMed] [Google Scholar]
- 5.Kelly A.S., Metzig A.M., Schwarzenberg S.J., Norris A.L., Fox C.K., Steinberger J. Hyperleptinemia and hypoadiponectinemia in extreme pediatric obesity. Metab Syndr Relat Disord. 2012;10(2):123–127. doi: 10.1089/met.2011.0086. [DOI] [PMC free article] [PubMed] [Google Scholar]
- 6.Koebnick C., Smith N., Black M.H., Porter A.H., Richie B.A., Hudson S. Pediatric obesity and gallstone disease. J Pediatr Gastroenterol Nutr. 2012;55(3):328–333. doi: 10.1097/MPG.0b013e31824d256f. [DOI] [PMC free article] [PubMed] [Google Scholar]
- 7.Selewski D.T., Collier D.N., MacHardy J., Gross H.E., Pickens E.M., Cooper A.W. Promising insights into the health related quality of life for children with severe obesity. Health Qual Life Outcomes. 2013;11:29. doi: 10.1186/1477-7525-11-29. [DOI] [PMC free article] [PubMed] [Google Scholar]
- 8.Flegal K.M., Wei R., Ogden C.L., Freedman D.S., Johnson C.L., Curtin L.R. Characterizing extreme values of body mass index-for-age by using the 2000 Centers for Disease Control and Prevention growth charts. Am J Clin Nutr. 2009;90(5):1314–1320. doi: 10.3945/ajcn.2009.28335. [DOI] [PubMed] [Google Scholar]
- 9.Freedman D.S., Mei Z., Srinivasan S.R., Berenson G.S., Dietz W.H. Cardiovascular risk factors and excess adiposity among overweight children and adolescents: the Bogalusa Heart Study. J Pediatr. 2007;150(1):12–17. doi: 10.1016/j.jpeds.2006.08.042. e2. [DOI] [PubMed] [Google Scholar]
- 10.The N.S., Suchindran C., North K.E., Popkin B.M., Gordon-Larsen P. Association of adolescent obesity with risk of severe obesity in adulthood. JAMA. 2010;304(18):2042–2047. doi: 10.1001/jama.2010.1635. [DOI] [PMC free article] [PubMed] [Google Scholar]
- 11.McTigue K., Larson J.C., Valoski A., Burke G., Kotchen J., Lewis C.E. Mortality and cardiac and vascular outcomes in extremely obese women. JAMA. 2006;296(1):79–86. doi: 10.1001/jama.296.1.79. [DOI] [PubMed] [Google Scholar]
- 12.Mokdad A.H., Ford E.S., Bowman B.A., Dietz W.H., Vinicor F., Bales V.S. Prevalence of obesity, diabetes, and obesity-related health risk factors, 2001. JAMA. 2003;289(1):76–79. doi: 10.1001/jama.289.1.76. [DOI] [PubMed] [Google Scholar]
- 13.Lynch C.P., McTigue K.M., Bost J.E., Tinker L.F., Vitolins M., Adams-Campbell L. Excess weight and physical health-related quality of life in postmenopausal women of diverse racial/ethnic backgrounds. J Womens Health (Larchmt) 2010;19(8):1449–1458. doi: 10.1089/jwh.2009.1652. [DOI] [PMC free article] [PubMed] [Google Scholar]
- 14.Kelly A.S., Barlow S.E., Rao G., Inge T.H., Hayman L.L., Steinberger J. Severe obesity in children and adolescents: identification, associated health risks, and treatment approaches: a scientific statement from the American Heart Association. Circulation. 2013;128(15):1689–1712. doi: 10.1161/CIR.0b013e3182a5cfb3. [DOI] [PubMed] [Google Scholar]
- 15.Keenan K., Hipwell A., Chung T., Stepp S., Stouthamer-Loeber M., Loeber R. The Pittsburgh Girls Study: overview and initial findings. J Clin Child Adolesc Psychol. 2010;39(4):506–521. doi: 10.1080/15374416.2010.486320. [DOI] [PMC free article] [PubMed] [Google Scholar]
- 16.Centers for Disease Control and Prevention About Child & Teen BMI. 2014. http://www.cdc.gov/healthyweight/assessing/bmi/childrens_bmi/about_childrens_bmi.html
- 17.Gulati A.K., Kaplan D.W., Daniels S.R. Clinical tracking of severely obese children: a new growth chart. Pediatrics. 2012;130(6):1136–1140. doi: 10.1542/peds.2012-0596. [DOI] [PMC free article] [PubMed] [Google Scholar]
- 18.Muthen L.K., Muthen R., editors. Mplus user's guide (version 5.2) Muthen & Muthen; Los Angeles, CA: 2008. [Google Scholar]
- 19.McDonald R.P., Ho M.H. Principles and practice in reporting structural equation analyses. Psychol Methods. 2002;7(1):64–82. doi: 10.1037/1082-989x.7.1.64. [DOI] [PubMed] [Google Scholar]
- 20.Centers for Disease Control and Prevention Growth charts: percentile data files with LMS values. 2011. http://www.cdc.gov/growthcharts/percentile_data_files.htm Stature-for-age charts, 2 to 20 years.
- 21.Centers for Disease Control and Prevention Growth charts: percentile data files with LMS values. 2011. http://www.cdc.gov/growthcharts/percentile_data_files.htm Weight-for-age charts, 2 to 20 years.
- 22.Sturm R., Ringel J.S., Andreyeva T. Increasing obesity rates and disability trends. Health Aff (Millwood) 2004;23(2):199–205. doi: 10.1377/hlthaff.23.2.199. [DOI] [PubMed] [Google Scholar]
- 23.Sobal J., Stunkard A.J. Socioeconomic status and obesity: a review of the literature. Psychol Bull. 1989;105(2):260–275. doi: 10.1037/0033-2909.105.2.260. [DOI] [PubMed] [Google Scholar]
- 24.Baum C.L., 2nd, Ruhm C.J. Age, socioeconomic status and obesity growth. J Health Econ. 2009;28(3):635–648. doi: 10.1016/j.jhealeco.2009.01.004. [DOI] [PubMed] [Google Scholar]
- 25.Ball K., Crawford D. Socioeconomic status and weight change in adults: a review. Soc Sci Med. 2005;60(9):1987–2010. doi: 10.1016/j.socscimed.2004.08.056. [DOI] [PubMed] [Google Scholar]
- 26.Chang V.W., Lauderdale D.S. Income disparities in body mass index and obesity in the United States, 1971–2002. Arch Intern Med. 2005;165(18):2122–2128. doi: 10.1001/archinte.165.18.2122. [DOI] [PubMed] [Google Scholar]
- 27.Cawley J., Danziger S. Morbid obesity and the transition from welfare to work. J Policy Anal Manage. 2005;24(4):727–743. doi: 10.1002/pam.20135. [DOI] [PubMed] [Google Scholar]
- 28.Park H.K., Ahima R.S. Physiology of leptin: energy homeostasis, neuroendocrine function and metabolism. Metabolism. 2015;64(1):24–34. doi: 10.1016/j.metabol.2014.08.004. [DOI] [PMC free article] [PubMed] [Google Scholar]
- 29.Considine R.V., Sinha M.K., Heiman M.L., Kriauciunas A., Stephens T.W., Nyce M.R. Serum immunoreactive-leptin concentrations in normal-weight and obese humans. N Engl J Med. 1996;334(5):292–295. doi: 10.1056/NEJM199602013340503. [DOI] [PubMed] [Google Scholar]
- 30.Garcia-Mayor R.V., Andrade M.A., Rios M., Lage M., Dieguez C., Casanueva F.F. Serum leptin levels in normal children: relationship to age, gender, body mass index, pituitary-gonadal hormones, and pubertal stage. J Clin Endocrinol Metab. 1997;82(9):2849–2855. doi: 10.1210/jcem.82.9.4235. [DOI] [PubMed] [Google Scholar]
- 31.Fleisch A.F., Agarwal N., Roberts M.D., Han J.C., Theim K.R., Vexler A. Influence of serum leptin on weight and body fat growth in children at high risk for adult obesity. J Clin Endocrinol Metab. 2007;92(3):948–954. doi: 10.1210/jc.2006-1390. [DOI] [PMC free article] [PubMed] [Google Scholar]
- 32.Barness L.A., Opitz J.M., Gilbert-Barness E. Obesity: genetic, molecular, and environmental aspects. Am J Med Genet A. 2007;143A(24):3016–3034. doi: 10.1002/ajmg.a.32035. [DOI] [PubMed] [Google Scholar]
- 33.Wheeler E., Huang N., Bochukova E.G., Keogh J.M., Lidsay S., Garg S., Henning E. Genome-wide SNP and CNV analysis identifies common and low-frequency variants associated with severe early-onset obesity. Nat Genet. 2013;45(5):513–517. doi: 10.1038/ng.2607. [DOI] [PMC free article] [PubMed] [Google Scholar]
- 34.Montague C.T., Farooqi I.S., Whitehead J.P., Soos M.A., Rau H., Wareham N.J. Congenital leptin deficiency is associated with severe early-onset obesity in humans. Nature. 1997;387(6636):903–908. doi: 10.1038/43185. [DOI] [PubMed] [Google Scholar]
- 35.Mackey R.H., McTigue K.M., Kuller L.H. The Obesity Epidemic and Women's Health. In: Goldman M.B., Triosi R., Rexrode K.M., editors. Women and health. Elsevier Inc; Amsterdam: 2013. pp. 855–871. [Google Scholar]
- 36.Phan-Hug F., Beckmann J.S., Jacquemont S. Genetic testing in patients with obesity. Best Pract Res Clin Endocrinol Metab. 2012;26(2):133–143. doi: 10.1016/j.beem.2011.11.010. [DOI] [PubMed] [Google Scholar]
- 37.Glueck C.J., Morrison J.A., Daniels S., Wang P., Stroop D. Sex hormone-binding globulin, oligomenorrhea, polycystic ovary syndrome, and childhood insulin at age 14 years predict metabolic syndrome and class III obesity at age 24 years. J Pediatr. 2011;159(2):308–313. doi: 10.1016/j.jpeds.2011.01.018. e2. [DOI] [PMC free article] [PubMed] [Google Scholar]
- 38.Reinehr T. Effectiveness of lifestyle intervention in overweight children. Proc Nutr Soc. 2011;70(4):494–505. doi: 10.1017/S0029665111000577. [DOI] [PubMed] [Google Scholar]
- 39.Whitlock E.P., O'Conner E.A., Williams S.B., Beil T.L., Lutz K.W. Effectiveness of weight management interventions in children: a targeted systematic review for the USPSTF. Pediatrics. 2010;125(2):e396–418. doi: 10.1542/peds.2009-1955. [DOI] [PubMed] [Google Scholar]
- 40.Lenders C.M., Gorman K., Lim-Miller A., Puklin S., Pratt J. Practical approaches to the treatment of severe pediatric obesity. Pediatr Clin North Am. 2011;58(6):1425–1438. doi: 10.1016/j.pcl.2011.09.013. x-xi. [DOI] [PubMed] [Google Scholar]
- 41.Pratt J.S., Lenders C.M., Dionne E.A., Hoppin A.G., Hsu G.L., Inge T.H. Best practice updates for pediatric/adolescent weight loss surgery. Obesity (Silver Spring) 2009;17(5):901–910. doi: 10.1038/oby.2008.577. [DOI] [PMC free article] [PubMed] [Google Scholar]
- 42.Christou N.V., Look D., Maclean L.D. Weight gain after short- and long-limb gastric bypass in patients followed for longer than 10 years. Ann Surg. 2006;244(5):734–740. doi: 10.1097/01.sla.0000217592.04061.d5. [DOI] [PMC free article] [PubMed] [Google Scholar]
- 43.Ogden C.L., Carroll M.D., Kit B.K., Flegal K.M. Prevalence of obesity and trends in body mass index among US children and adolescents, 1999–2010. JAMA. 2012;307(5):483–490. doi: 10.1001/jama.2012.40. [DOI] [PMC free article] [PubMed] [Google Scholar]
Associated Data
This section collects any data citations, data availability statements, or supplementary materials included in this article.
Supplementary Materials
Tables S1–S3.