

Abstract
Transcriptional regulation of gene expression is a key component of orchestrating proper immune cell development and function. One strategy for maintaining these transcriptional programs has been the evolution of transcription factor families with members possessing overlapping functions. Using the germ line deletion of Snai2 combined with the hematopoietic specific deletion of Snai3, we report that these factors function redundantly to preserve the development of B and T cells. Such animals display severe lymphopenia, alopecia and dermatitis as well as profound autoimmunity manifested by the production of high levels of autoantibodies as early as 3 weeks of age and die by 30 days after birth. Autoantibodies included both IgM and IgG isotypes and were reactive against cytoplasmic and membranous components. A regulatory T cell defect contributed to the autoimmune response in that adoptive transfer of wild type regulatory T cells alleviated symptoms of autoimmunity. Additionally, transplantation of Snai2/Snai3 double deficient bone marrow into Snai2 sufficient Rag2−/− recipients resulted in autoantibody generation. The results demonstrated that appropriate expression of Snai2 and Snai3 in cells of hematopoietic derivation plays an important role in development and maintenance of immune tolerance.
Keywords: Autoimmunity, Genetic deficiency, Snail transcription factors, Lymphocytes, Autoantibody
1. Introduction
Proper development and function of various cell lineages is a critical component in the viability of not only the whole organism, but also individual organ systems. These events are precisely controlled by the coordinated efforts of various gene expression networks. Throughout hematopoiesis, cell (or lineage) fate decisions are constantly being regulated by a multitude of transcriptional regulators. Some factors such as PU.1 may augment lineage bifurcation [1]. Alternatively, other factors may act to regulate the specialization of effector cells within a given lineage. For example, Foxp3 propagates a transcriptional program leading to the generation and function of regulatory T cells (TRegs), necessary for the prevention of lethal autoimmune disease [2,3]. In many instances, these decisions are absolutely required for the viability of the organism leading to the evolution of functional redundancy within various transcription factor families. One such example is the ability of GATA-1 and GATA-2 to functionally overlap within the earliest stages of primitive hematopoiesis [4]. These types of redundancies serve as a potential failsafe mechanism to protect against the loss of a cell type (or specific function) as a result of a germ line or somatic mutation.
The Snail family of transcriptional regulators has been conserved throughout metazoan evolution and consists of three members: Snai1, Snai2 and Snai3 [5–7]. The protein products of each member share two common features. Within the C-terminus are multiple C2H2 zinc finger DNA-binding domains (DBDs). While Snai2 and Snai3 possess five DBDs, Snai1 only has four of these domains [8]. Using these zinc fingers, Snail proteins recognize and bind to canonical E-box sequences (CANNTG) preferentially targeting GC-rich central di-nucleotides [9]. At the extreme N-terminus, each protein contains a SNAG (Snail/Gfi-1) domain used to recruit various chromatin modifiers such as HDACs and EZH2 [10–12]. Due to the similarity between all three Snail members, the potential to function in a redundant manner is highly likely [13]. Historically, the Snail family is most well known for roles in embryonic development [14] however, Snail proteins have also been shown to play a prominent role in hematopoiesis [15]. Due to embryonic lethality resulting from germline deletion of Snai1, the hematopoietic functions of this family member have not yet been defined [16,17]. The germline deletion of Snai2 (g2KO) is viable with piebaldism of variable penetrance [18]. Steady state hematopoiesis shows minimal perturbations with only a slight skewing of thymocyte population frequencies (i.e. decreased CD4 and CD8 double positive versus increased CD4 single positive cell ratios) [18]. Deletion of Snai3 in the germ line has no significant phenotype [19,20].
Given the relative lack of hematopoietic phenotypes at steady-state conditions in both single knockouts of Snai2 and Snai3, we recently generated and analyzed a Snai2/Snai3 germline double knockout (gDKO) animal [20]. These mice demonstrated multiple lymphopoietic defects with reduced bone marrow B cell frequencies and increased CD4 single positive thymocyte percentages. Of significance, these phenotypes were only evident in the gDKO revealing a previously unappreciated functional redundancy between Snai2 and Snai3. To better understand the hematopoietically intrinsic roles of these proteins in a stromal-independent manner, we generated and analyzed a Snai2/Snai3 conditional double knockout (cDKO) animal. Surprisingly the cDKO animals had more dramatic phenotypes that the gDKO animals including severe runting and mortality at about 30 days. Additionally, these cDKO animals demonstrated a florid autoimmunity after birth involving a wide array of tissues. The symptoms of autoimmunity were reversible upon the adoptive transfer of wild type (WT) TRegs. Finally, deletion of Snai2 and Snai3 in bone marrow-derived cells contributed to the autoimmune phenotype as transplantation of cDKO bone marrow into Snai2 sufficient Rag2−/− hosts resulted in the production of autoantibodies.
2. Methods and materials
2.1. Animal strains and care
Animals were housed in the Animal Resource Center (University of Utah Health Science Center, Salt Lake City, UT) according to the guidelines of the National Institute of Health for the care and use of laboratory animals. All animal protocols were reviewed and approved by the University of Utah Institutional Animal Use and Care Committee. For transcriptional profiling experiments, C57BL/6 mice were bred and maintained in house. Foxp3–GFP reporter mice were a kind gift from Dr. June Round. Vav-Cre (Stock #: 008610) and Rag2−/− (Stock #: 008449) mice were purchased from The Jackson Laboratory and bred in house. All iterations of Snai2 and Snai3 wildtype, single and double knockouts were derived from Snai2+/− Snai3Fl/Fl Vav-Cre+/− breeding pairs. Unless otherwise noted, all animals used approximated three to 4 weeks of age. Animal numbers used per experiment are noted in the figure legends. Paraffin sectioning and H&E staining was performed at the University of Utah Hospital, Pathology, following their standard protocol. Sections were cut to thickness of 5 microns.
2.2. DNA isolation and genomic DNA PCR
Approximately 5 mm portions of tail were boiled in 50 mM NaOH until fully dissolved. 1 M Tris was added to neutralize the NaOH. Following centrifugation to remove insoluble material, DNA was precipitated from supernatants following standard ethanol precipitation guidelines. In the case of purified cells, DNA was extracted using the Qiagen DNeasy Blood and Tissue Kit. Snai2, Snai3 and Vav-Cre genotyping was performed with Thermo Scientific Taq DNA Polymerase (Cat. #: FEREP0402) using 2 μL of DNA per reaction. Products were electrophoresed in 2% agarose gels. When quantification was necessary, PCR was performed via incorporation of [32P] deoxycytidine triphosphate. Products were electrophoresed in polyacrylamide sequencing gels. Products were visualized after exposure to X-ray film at −80 °C or PhosphorImager plates at room temperature. Cycling parameters are available upon request. Primer sequences are provided in Supplementary Table 1.
2.3. RNA isolation, cDNA synthesis and RT-PCR
Total RNA was isolated from cells using the Qiagen miRNeasy Mini Kit (Cat. #: 217004) according to the manufacturer’s instructions. Random hexamer primers (Invitrogen, Cat. #: 58875) were used in combination with SuperScript III Reverse Transcriptase (Invitrogen, Cat. #: 56575) to synthesize cDNA. Reactions were purified using the Thermo Scientific GeneJET Purification Kit (Cat. #: K0702). Quantitative RT-PCR was performed using Light Cycler (Roche Diagnostics) technology. All transcript values shown are relative to Actb expression within the same sample and are mean values ± standard error measurement (SEM). Cycling parameters are available upon request. Primer sequences are provided in Supplementary Table 1.
2.4. FACS analysis and sorting of hematopoietic cell populations
Upon dissection, the plunger of a 5 mL syringe was used to dissociate thymus and spleen tissues. Cells were strained through a 100 μM filter and collected in 10 mL of FACS buffer (1 × PBS + 0.1% BSA). Bone marrow was collected from both femurs and tibias. Removing the ends of each bone with a razor blade exposed bone cavities. Marrow was flushed from cavities using a 255/8G syringe and FACS buffer. Contents were collected in 5 mL of FACS buffer. After centrifugation, erythrocytes were lysed on ice for 10 min using ACK buffer. Following lysis, cells were respun, resuspended in FACS buffer and counted using a Hemoctyometer. Cells were stained on ice for 30 min using the appropriate antibody cocktail. Samples were washed with FACS buffer, centrifuged and resuspended in FACS buffer. To discriminate between live and dead cells, 4′,6-diamidino-2-phenylindole (DAPI) was added at a final concentration of 3 μM. For intracellular staining, cells were processed using the BioLegend Nuclear Factor Fixation and Permeabilization Buffer Set (Cat. #: 422601) following the manufacturer’s instructions. DAPI was not used for these samples. The antibodies utilized with their indicated dilutions are available in Supplementary Table 2. Population analysis was performed on the FACS Canto II (BD Biosciences) and results for a given cell type are graphically represented as mean values ± standard error measurement (SEM). Cell sorting of select populations was performed on the FacsAria Cell Sorter (BD Biosciences) at the University of Utah Flow Cytometry Core.
2.5. Thymocyte-based assay for autoantibody reactivity
Thymocytes were utilized as a substrate to proxy for systemic antibody-mediated autoreactivity. Organs were harvested from four-weeks-old C57BL/6 mice as described for FACS analysis and sorting of hematopoietic cell populations. Samples were split into two 15-mL conical tubes. One tube was resuspended in 5 mL of 4% PFA and fixed at room temperature for one hour. The other tube was resuspended in 5 mL of methanol (MeOH) at −20 °C for 1 h to fix and permeabilize cells. Following incubation, each tube was taken to 10 mL of volume with FACS buffer. Tubes were centrifuged at 1600 rpm (rpm) for 5 min at room temperature. Supernatants were aspirated and cells were washed once more with 10 mL of FACS buffer. The resultant cell pellets were resuspended in FACS buffer at a concentration of 107 cells per mL and stored at 4 °C until used.
Mouse blood was collected retro-orbitally in heparinized capillary tubes. Samples were centrifuged at ≥ 13,000 rpm for 5 min at 4 °C. Plasma was transferred to 1.5-mL tubes at stored at −80 °C until further use. For each assay, plasma was pre-diluted 1:50 in FACS buffer. Plasma from H2-O−/− deficient animals served as a positive control. 10 μL of diluted plasma was mixed with 106 previously fixed thymocytes yielding a final sample dilution of 1:500 and incubated at room temperature for 30 min in 96-well plates. Wells were washed with 100 μL of FACS buffer and centrifuged at 2000 rpm for 5 min at 10 °C. A second wash was performed with 200 μL of FACS buffer. Samples were then resuspended in 100 μL of diluted fluorophore-conjugated secondary antibody and incubated for 30 min at room temperature. Wells were washed as above and samples were resuspended in 300 μL of FACS buffer/1% PFA for analysis on a FACS Canto II. “Intact” cells were gated on and the geometric mean fluorescence intensity (gMFI) was measured for each sample. Graphical representation of the data depicts the Autoreactivity Index (AI) for each sample (calculated as such: AI = sample gMFI/mean WT gMFI). The mean for a given genotype is represented by the middle horizontal bar while the standard error measurement (SEM) is indicated by the upper and lower horizontal bars. Animals were considered autoantibody positive with an AI ≥ 2. The antibodies utilized with their indicated dilutions are available in Supplementary Table 2.
2.6. Immunofluorescence of mouse 3T3 fibroblasts
Mouse 3T3 fibroblasts were seeded at a density of 103 cells per well in 96-well plates and cultured in DMEM/10% FCS/1 × Pen-Strep. The next day, media was removed and cells were fixed with 4% PFA for 20 min at room temperature. Cells were washed with 200 μL of 1 × PBS and subsequently permeabilized with 1 × PBS/αCD16 + 32/0.5% BSA/0.25% Triton X-100 for 30 min at room temperature then washed 2 times with 1 × PBS. Plasma samples were diluted 1:500 in 1 × PBS/αCD16 + 32/0.5% BSA and directly applied to cells for 30 min at room temperature. Plasma from H2-O−/− deficient animals served as a positive control. Cells were washed 2 times with 1 × PBS and then incubated with fluorophore-conjugated antibody diluted in 1 × PBS/0.5% BSA for 30 min at room temperature. Following incubation, cells were washed as above and stained with 1 × PBS/DAPI (3 μM) to demarcate nuclei. Cells were washed once more with 1 × PBS then visualized and recorded with a camera-mounted Olympus BX 51 microscope. The antibodies utilized with their indicated dilutions are available in Supplementary Table 2.
2.7. Thymocyte-based plasma western blot
Thymocytes from four-weeks-old C57BL/6 mice were harvested as described in FACS analysis and sorting of hematopoietic cell populations. After cell counting, cells were washed twice with 1 × PBS to remove any residual BSA from FACS buffer. Pellets were resuspended in RIPA (25 mM Tris ph 7.5, 50 mM NaCl, 1 mM EDTA, 0.1% SDS, 1% DOC, 1% NP-40) at a concentration of 106 cells per 10 μL. Protease inhibitors (Roche, Cat. #: 04 693 132 001) were included to prevent degradation of samples. Cells suspensions were incubated on ice for 20–30 min and insoluble material was pelleted via a 15 min, ≥ 13,000 rpm centrifugation at 4 °C. Supernatants were collected as whole cell lysates and stored at −80 °C until further use. The protein equivalent of 107 total thymocytes was electrophoresed in 1.5 mm, 2D-well, NuPage 4–12% Bis-Tris gels (Invitrogen, Cat. #: NP0337BOX) using 1 × MOPS SDS–PAGE running buffer (Invitrogen, Cat. #: NP0001). Following separation, protein was transferred to PVDF membranes. Membranes were stained with 0.1% Ponceau S/1% glacial acetic acid to verify equivalent protein distribution across the entirety of the membrane. Blots were washed at 5-min intervals, 4 times with 1 × TBS/0.2% Tween-20 at room temperature. Following complete removal of Ponceau staining, membranes were blocked for one hour at room temperature with 1 × TBS/0.2% Tween-20/5% BSA. Membranes were then positioned in the Mini-Protean II Multi Screen chamber from Bio-Rad (Cat. #: 170-4017). This allowed for the simultaneous screening of multiple plasma samples on the same lysate without introducing gel-to-gel variation. Plasma sample from C57BL/6 and Snai2/Snai3 cDKO mice were diluted 1:500 in 1 × TBS/0.2% Tween-20/5% BSA and applied to each chamber of the slot blot device. Plasma from H2-O−/− deficient animals served as a positive control. Following room temperature incubation for 2 h, blots were washed at 5-min intervals, 5 times with 1 × TBS/0.2% Tween-20 at room temperature. Membranes were incubated with the appropriate secondary antibody diluted in 1 × TBS/0.2% Tween-20/5% BSA for two hours at room temperature (see Supplementary Table 2 for antibody details). Membranes were washed as above and further rinsed 1 time with 1 × TBS for 5 min at room temperature. Blots were incubated with an appropriate amount of chemi-illuminescence reagent (Thermo Scientific, Cat. #: 34080) to ensure full coverage. After 5 min at room temperature, membranes were blotted on a paper towel to remove excess reagent, wrapped in plastic wrap and exposed to film to detect reactive self-antigens.
2.8. Enzyme-linked immunosorbent assay (ELISA)
Immulon 4HBX microtiter plates (Thermo Scientific, Cat. #: 3855) were incubated with αIgG + IgM + IgA capture antibody diluted to 5 μg/mL in 100 mM Carbonate buffer overnight at 4 °C. The next day, plates were washed 3 times with 1 × PBS/0.1% Tween-20 and then blocked for 1.5 h at room temperature with 1 × PBS/0.1% Tween-20/1% BSA. Plates were washed again and 100 μL of plasma sample or immunoglobulin-specific standard were added to each well (diluted in 1 × PBS/0.1% Tween-20/1% BSA). Following a 1.5-h incubation, plates were washed as above. Immunoglobulin-specific secondary antibodies (diluted in 1 × PBS/1% BSA) were added to each well and plates were incubated for an additional 1.5 h. Following six consecutive washes with 1 × PBS/0.1% Tween-20, wells were incubated as needed with 100 μL Developing Solution (0.33 μL of 30% hydrogen peroxide (H2O2) and 8.8 μg of o-Phenylenediamine dihydrochloride (OPD) per 20 mL of Citrate buffer). Developing reactions were stopped with the addition of 100 μL of 1 N HCl. Absorbance for each well was recorded at 490 nm by a Synergy H1 microplate reader (Bio Tek). Standard curves were generated in Microsoft Office Excel and fitted with a logarithmic trend line. Plasma sample dilutions that fell within standard curves were used to calculate antibody titers for each isotype assayed. Isotype standards included mouse IgM (eBioscience, Clone 11E10), IgG1 (Invitrogen, Cat. #: 026100), IgG2b (eBioscience, Clone eBMG2b), IgG2c (Southern Biotech, Cat. #: 0122-01) and IgG3 (eBioscience, Cat. #: 14-4742-85). Details about antibody usage are available in Supplementary Table 2.
2.9. Immunofluorescence of frozen skin and thymus sections
Dorsal (back) skin and thymus were harvested and washed briefly in 1 × PBS. Tissue was immersed in 4% PFA at 4 °C for a minimum of 72 h. Following fixation, tissue was washed at 5- min intervals for 5 times with 1 × PBS at room temperature. Samples were embedded in OCT compound (Tissue-Tek) on dry ice and then sectioned to an approximate thickness of 10 μM using a Microm HM 505N cryostat (Mikron Instruments). To evaluate morphology, sections were stained with hematoxylin and eosin using standard methodology. For immunofluorescence, sections were post-fixed to slides with 4% PFA at room temperature for 10 min. Slides were washed at 5-min intervals for 3 times with 1 × PBS at room temperature. Endogenous tissue autofluorescence was quenched via 0.1% Sudan Black B/70% EtOH staining for 20 min at room temperature. If necessary, sections were permeabilized with a 10-min incubation in 1 × PBS/0.5% BSA/0.25% Triton X-100. Slides were washed at 5-min intervals for 3 times with 1 × PBS/0.2% Tween-20 at room temperature. Sections were blocked for 1 h at room temperature with 1 × PBS/0.2% Tween-20/αCD16 + 32/1% BSA (Blocking Buffer). Tissue sections were stained with the appropriate fluorophore-conjugated antibody (diluted in Blocking Buffer) at room temperature for 1 h in an enclosed humidity chamber. Slides were washed at 5-min intervals for 3 times with 1 × PBS/0.2% Tween-20 at room temperature. To visualize nuclei, tissue sections were incubated for 5 min at room temperature with 1 × PBS/DAPI (3 μM). Excess DAPI solution was removed by a one-time wash with 1 × PBS/0.2% Tween-20. Stained sections were mounted with Image-iT FX signal enhancer (Invitrogen, Cat. #: I36933). Images were visualized and recorded with a camera-mounted Olympus BX 51 microscope. The antibodies utilized with their indicated dilutions are available in Supplementary Table 2.
2.10. Regulatory T cell (TReg) adoptive transfer
Spleens were excised from Foxp3–GFP reporter mice approximating two months of age. Following erythrocyte lysis, B cells were depleted using CD45R (B220) Microbeads (Miltenyi Biotec, Cat. #: 130-049-501). TRegs were FACS-sorted based on forward scatter (FSC), side scatter (SSC) and GFP positivity. Cells were washed with 1 × PBS and resuspended at a final concentration of 7.5 × 10⁴ cells per 100 μL. 7.5 × 10⁴ cells were delivered retro-orbitally (r.o.) to 21-day-old C57BL/6 and Snai2/Snai3 cDKO recipients. As a negative control, a group of cDKO animals were left untransferred. Animals were monitored out to 60 days of total lifespan. Bodyweight was measured over the first 4 weeks post-transfer and plasma samples were collected at four weeks post-transfer. At the completion of the each experiment, WT and cDKO animals were euthanized and analyzed via FACS.
2.11. Bone marrow transplantation
One day prior to transplantation, 8–12 weeks old Rag2−/− or WT recipient mice were lethally irradiated with two doses of 500 cGy split 6 h apart. WT and cDKO bone marrow was isolated from pooled tibias and femurs. Samples were lineage depleted using the mouse-specific Lineage Depletion Kit from Miltenyi (Cat. #: 130-090-858). Isolated progenitors were washed and resuspended in 1 × PBS at a concentration of 1 × 10⁶ cells/mL. A total of 1 × 10⁵ cells (100 μL) were delivered r.o. to each recipient animal. Three WT and three cDKO donors were used to transplant five and seven Rag2−/− mice, respectively. Two WT and two cDKO donors were used to transplant two WT mice apiece. Animals were maintained on Sulfamethoxazole and Trimethoprim antibiotic-treated water for the duration of all experiments. Post-transplant, animals were periodically analyzed for systemic autoantibodies as described in Section 2.5. Animals with multiple autoantibody subtypes or persistent autoantibodies (2 consecutive positive tests for a particular autoantibody subtype) were euthanized and analyzed at time of presentation. Otherwise, all animals were analyzed nine (Rag2−/−) or twelve (WT) weeks post-transplant.
2.12. Statistical analysis
Using Prism GraphPad software, two-tailed unpaired Student’s t-tests were applied for all RT-PCR, body/organ mass measurements, FACS-based cell population analysis and ELISA experiments. Thymocyte autoantibody experiments were analyzed using the Mann–Whitney test. Kaplan–Meier survival analysis using the Mantel-Cox log-rank test was applied to the TReg adoptive transfer experiments. Fisher’s exact test was used to compare autoantibody occurrence rates. Statistical cutoffs are described in the figure legends.
3. Results
3.1. Generation of the Snai2−/− Snai3Fl/Fl Vav-Cre conditional double knockout (cDKO)
Our previous study identified a functional redundancy for Snai2 and Snai3 in lymphocyte development [20]. That analysis used a germline deletion of both gene products such that loss of both Snail gene products in the stromal cells could potentially influence T and B cell development. Currently, there only exists a germline deletion allele of Snai2 (g2KO). Therefore, we bred Snai2−/− animals to mice possessing a LoxP-targeted allele of Snai3 (Snai3Fl/Fl) [20]. The progeny of this cross were further bred to animals expressing the Vav-Cre transgene allowing for the conditional deletion of Snai3 within the hematopoietic lineages. This animal will be referred to as the Snai2/Snai3 conditional DKO (cDKO) throughout the text. Analysis of genomic DNA isolated from the tail, bone marrow and thymus of the cDKO demonstrated appropriate deletion of the Snai3Fl/Fl allele in the cells of the bone marrow and thymus (Supplementary Fig. 1). Unexpectedly, the Snai2/Snai3 cDKO animals demonstrated a severe runting compared to WT littermates (Fig. 1A) that was evident post natal. Overall, the cDKO animals were approximately half the body mass of WT littermates (Fig. 1B). Additionally within the pre-weaning period (<21 days of age), cDKO animals consistently developed severe alopecia and dermatitis. This “pathology” was not apparent in the previously studied gDKO model [20]. Macroscopic analysis of hematopoietic tissues such as the bone marrow, spleen and thymus showed no gross abnormalities aside from an overall reduction in mass (DNS). Histological cross sections of thymus samples taken from the cDKO animals (3 weeks of age) displayed a lack of normal cortex to medulla organization when examined by hematoxylin and eosin (H&E) staining (Fig. 1C). However, immunofluorescence staining for MHC II (cortical and medullary epithelium) and AIRE (medullary epithelium) was normal in the cDKO thymus (Supplementary Fig. 2) [21]. This suggested that the abnormal H&E staining pattern in the cDKO thymus was not due to an inability of mature thymic epithelium to develop. Additionally, H&E staining of the spleen revealed severely disorganized lymphoid follicles in cDKO samples (Fig. 1D). Analysis of bone marrow cellularity demonstrated that the cDKO had an approximately 50% reduction in total cells (Supplementary Fig. 3A). Analysis of the thymus showed a reduction in cDKO thymic mass relative to overall body mass (Supplementary Fig. 3B). Furthermore, the cDKO thymus had less cell density compared to all other genotypes. Relative splenic mass was normal in the cDKO animals however the cDKO spleen demonstrated a reduced cell density (Supplementary Fig. 3C).
Fig. 1.

Germline deletion of Snai2 in conjunction with the hematopoietic specific deletion of Snai3 results in a failure to thrive combined with reduced hematopoietic output. (A) Representative image depicting three-week-old sex-matched wildtype (WT) and Snai2/Snai3 conditional double knockout (cDKO) littermates. The cDKO animals are consistently runted and present with alopecia and dermatitis. (B) Body mass comparisons of wildtype WT, Snai2 germline knockout (g2KO), Snai3 conditional knockout (c3KO) and cDKO mice. Number of animals per group: WT = 13, g2KO = 4, c3KO = 6, cDKO = 10. Histological H&E staining of paraffin embedded cross sections of thymus (C) and spleen (D) from WT and two different cDKO animals. Images were captured at 10× magnification and scale bars represent 200 microns.
3.2. Snai1,2,3 gene expression in developing lymphocytes
Previously we transcriptionally profiled the expression patterns of Snai1, Snai2 and Snai3 in hematopoietic cells delineated by fluorescence-activated cell sorting (FACS) with the CD4, CD8, B220 and CD11b surface markers [20]. This analysis demonstrated that multiple Snail genes were expressed within a given cell type. To further clarify Snail gene expression profiles in lymphocyte precursors, we FACS sorted pre-Pro B cell progenitors (CD11b− CD19− B220+) and B cell subsets at various stages of maturation from the bone marrow and spleen [22]. Transcriptional analysis of isolated RNA demonstrated that Snai1 was expressed by all marrow and splenic B cell subsets with specific points of enrichment at the pre-Pro, newly formed (NF), marginal zone (MZ) and follicular (FO) B cell stages (Supplementary Fig. 4A). In contrast, Snai2 was restricted in expression pattern being detectable only in pre-Pro, Pre and NF B cells (Supplementary Fig. 4B). Snai3 demonstrated a highly overlapping pattern of expression as compared to Snai1 (Supplementary Fig. 4A versus 4C).
All three Snail members have been shown to be expressed during various stages of T cell development [20]. The thymic double negative (DN) population contains a heterogeneous collection of cells: T cell progenitors (early thymic progenitors, ETP), uncommitted (DN1-2) and committed (DN3-4) maturing T cells. We FACS sorted the DN compartment into stages one through four and transcriptionally profiled each population for Snail gene expression. Snai1 was expressed at low levels at the stages proceeding T cell commitment (DN1-2) with significantly increased expression at the DN3-4 stages marking T cell commitment (Supplementary Fig. 4D). Snai2 was expressed in all double negative stages at relatively equivalent levels (Supplementary Fig. 4E). The Snai3 expression pattern of double negative thymocytes highly overlapped with Snai1 (Supplementary Fig. 4D versus 4F).
3.3. Impaired generation of B and T lymphocytes in the Snai2/Snai3 cDKO
Given the reduced cellular output from primary lymphoid organs, we examined at what stage(s) of hematopoietic development these deficiencies were occurring. To do this, we initially evaluated lineage negative (Lin−) hematopoietic progenitors in the marrow that were further subdivided into Sca-1+/− populations and further analyzed using c-Kit and L-selectin (CD62L) (Supplementary Fig. 5A) [23,24]. All genotypes demonstrated equivalent numbers of Lin− cells (Supplementary Fig. 5B, left). Subdivision of Sca-1+ cells into the most primitive progenitor (c-Kit+ CD62L−) and lymphoid-primed multipotent progenitor (LMPP) (c-Kit+ CD62L+) containing fractions also displayed no apparent differences (Supplementary Fig. 5B, middle). Cell numbers of the less well-defined Sca-1− c-Kit+ CD62L+/− populations were equivalent between all four genotypes as well (Supplementary Fig. 5B, right). This data suggested that reduced hematopoietic output of cDKO mice was not due to a hematopoietic progenitor defect.
Next we examined the bone marrow for generation of myeloid and B cell lineages (Supplementary Fig. 5C). The number of myeloid-derived cells such as monocytes (CD11b+ Gr-1INT/−) and neutrophils (PMN, CD11b+ Cr-1HI) were reduced 30% in the cDKO animals compared to WT and single knockouts (Supplementary Fig. 5D). However, the B cell lineage showed a greater degree of impairment with pre-Pro B (B220+ CD19−) and committed B cells (B220+ CD19+) reduced by 43% and 67%, respectively (Supplementary Fig. 5D). Although, pre-Pro B cells were reduced, the greatest loss of B cells came within the committed B cell lineage (CD19+).
The loss in B cells was further quantified by an assessment of the various stages of bone marrow B cell development in the cDKO mouse. Marrow B cells were divided into immature (CD19+ AA4.1+) and mature recirculating (CD19+ AA4.1−) subpopulations (Supplementary Fig. 6A). As shown in Supplementary Fig. 6B, AA4.1 and CD22 demarcated separate populations of B cells in both WT and cDKO animals. CD19+ AA4.1+ immature B cells were further subdivided into Pro (CD43+ surface IgM−), Pre (CD43− surface IgM−) and NF (CD43− surface IgM+) stages of maturation (Supplementary Fig. 6A). Quantification of these subsets demonstrated equivalent production between WT, g2KO and c3KO genotypes, which was in stark contrast to the cDKO (Fig. 2A). Similar to the pre-Pro stage, cDKO Pro B cell numbers were reduced by 40% compared to WT while the production of Pre B cells was impaired by 76% in the cDKO. This decrease was similar in magnitude at the NF stage of B cell development (81% reduction). These data identified the Pre B cell stage as the major point of constriction within the B cell lineage.
Fig. 2.
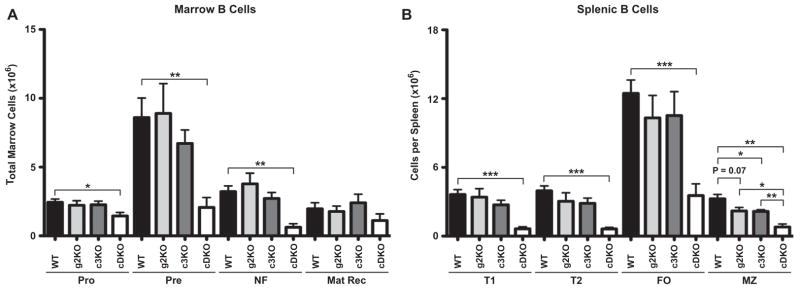
Deletion of Snai2 and Snai3 significantly impairs B cell generation. (A) Quantification of marrow B cell subsets as described in Supplemental Fig. 4. (B) Quantification of splenic B cell subsets as described in Supplemental Fig. 4. Total cell numbers of a given population are displayed for all four genotypes. Bars represent mean ± SEM. Number of animals per group: WT = 5, g2KO = 4, c3KO = 4, cDKO = 4; Statistical comparisons: *P ≤ 0.05, **P ≤ 0.01, ***P ≤ 0.001.
We then determined if the loss of Snai2 and Snai3 could alter the production of mature splenic B cell populations with mature follicular and marginal zone phenotypes (Fig. 2B). B cells were gated for CD19 expression and further subdivided into immature (AA4.1+) and mature (AA4.1−) subsets. Immature B cells were divided into Transitional 1 (T1, CD23− IgM+) and Transitional 2 (T2, CD23+ IgM+) subsets. Mature B cells were subdivided into follicular (FO, IgDHI IgMINT) and marginal zone (MZ, IgDINT IgMHI) subsets (Supplementary Fig. 6C). Comparison of the various genotypes demonstrated a continued B cell pipeline defect in the cDKO as all subsets analyzed were significantly reduced. Of note, g2KO and c3KO single knockout animals both demonstrated similar reductions within the marginal zone compartment (33% decrease).
As shown in Supplementary Fig. 3B, the cDKO animals demonstrated impaired generation of the T cell lineage. Examination of early thymic progenitors (CD44+ CD25− c-KitHI) demonstrated a 95% reduction of these cells in the cDKO thymus (Fig. 3A–C) as compared to WT animals. The cDKO animals also demonstrated severe reductions in all of the thymic DN1-4 compartments (Fig. 3D). The greatest deficiencies were seen earliest in T lineage maturation with DN1 reduced by 88%, DN2 by 78%, DN3 by 66% and DN4 by 56%. CD4 and CD8 surface markers were used to differentiate between CD4 and CD8 double positive (DP), CD4 single positive (CD4SP) and CD8 single positive (CD8SP) thymocytes (Fig. 3E). The cDKO had significant reductions in DP (86%), CD4SP (91%) and CD8SP (86%) populations as compared to WT (Fig. 3F). Similar to B cells, we examined peripheral T cells in the spleen to determine any obvious differences in the persistence of CD4SP and CD8SP T cells upon emigration from the thymus (Fig. 3G). Both CD4SP and CD8SP splenic populations were significantly reduced in the cDKO (Fig. 3H, 72% and 58%).
Fig. 3.

Deletion of both Snai2 and Snai3 severely reduces early thymic progenitors (ETP) and subsequent generation of T cells. (A) Representative WT and cDKO FACS gating for the analysis of double negative thymocytes. Double Negative 1 (DN1): CD44+ CD25−; Double Negative 2 (DN2): CD44+ CD25+; Double Negative 3 (DN3): CD44− CD25+; Double Negative 4 (DN4): CD44− CD25−. (B) Representative histograms for all four genotypes demonstrating c-Kit fluorescence intensity within DN1-4 compartments. ETP can be identified within the DN1 compartment as the c-KitHI peak (see arrow). Quantification of ETP (C) and DN1-4 (D) compartments within the thymus of three-week-old animals as outlined in A, B. Results are represented as total cells per thymus. (E) Representative WT and cDKO thymic analysis using CD4 and CD8 surface markers. (F) Quantification of the number CD4 and CD8 double negative (DN), CD4 and CD8 double positive (DP), CD4 single positive (CD4SP) and CD8 single positive (CD8SP) cells per thymus. (G) Representative gating of WT and cDKO animals depicted the analysis of CD4 and CD8 T cells. (H) Quantification of splenic CD4 and CD8 T cell numbers using the strategy depicted in G. (C, D, F and H) Bars represent mean ± SEM. Number of animals per group: WT = 5, g2KO = 4, c3KO = 4, cDKO = 4; Statistical comparisons: *P ≤ 0.05, **P ≤ 0.01, ***P ≤ 0.001.
3.4. Snai2 and Snai3 cDKO animals generate systemic autoimmunity
The above data demonstrated obvious lymphopoietic defects in the Snai2/Snai3 cDKO that were evident in the first days of life. The lack of lymphocytes alone, however, would not account for the evident “failure to thrive” phenotype of the cDKO. Instead the cDKO animals closely paralleled the phenotype of acute autoimmunity similar to that seen for the Scurfy mice, which are deficient for TReg generation [25].
To test determine if the cDKO animals had evidence of autoimmunity, we utilized a FACS-based assay using WT thymocytes as the source of self-antigen. Thymocytes were incubated with plasma from various animals and bound autoreactive antibodies are detected with fluorophore-conjugated anti-IgM and anti-IgG. Representative histograms demonstrating positive results for cDKO autoreactivity to permeabilized thymocyte antigens are shown for IgM (Fig. 4A, left) and IgG (Fig. 4B, left). In both instances, clear increases in fluorescence intensity (autoantibody binding) are observable in the cDKO samples as compared to all other genotypes. To quantify these results, the geometric mean fluorescence intensity (gMFI) for each individual sample was normalized to the mean WT gMFI to derive the Autoreactivity Index (AI) per each sample. An AI ≥ 2 was required for an animal to be considered as having a particular subtype of autoantibody (AA). Quantification of IgM reactivity to total cellular antigens (permeabilized cells) is presented in the middle panel of Fig. 4A. Six of eleven cDKO animals possessed IgM autoantibodies (AA) by three weeks of age. When we skewed the analysis to examine IgM autoantibodies to surface antigens, eight of eleven cDKOs tested positive (Fig. 4A, right). Importantly, both single knockouts were normal. IgM AA are indicative of a loss of B cell tolerance as previously shown in various autoimmune models [25,26].
Fig. 4.

cDKO animals have increased circulating immunoglobulins due to the presence of IgM and IgG autoantibodies. (A) Analysis of IgM autoantibodies generated by the cDKO. Representative histograms of IgM autoreactivity to permeabilized cell antigens (left). Quantified IgM reactivity towards permeabilized cell (middle) and surface antigens (right). (B) Analysis of IgG autoantibodies generated by the cDKO. Representative histograms of IgG autoreactivity to permeabilized cell antigens (left). Quantified IgG reactivity towards permeabilized cell (middle) and surface antigens, right. (A and B) Autoreactivity Index (AI) = gMFI per sample/mean WT gMFI, AI ≥ 2 (indicated by dotted line) is considered autoreactive; (C) Plasma titers of thymus independent isotypes. Total IgM (left) and total IgG3 (right) are depicted for WT, g2KO, c3KO and cDKO animals. (D) Plasma titers of thymus dependent isotypes. Data from all four genotypes is shown for IgG1 (left), IgG2b (middle) and IgG2c (right). (C and D) Number of animals per group: WT = 9–10, g2KO = 6, c3KO = 6, cDKO = 10. Number of animals per group: WT = 11–12, g2KO = 6, c3KO = 6, cDKO = 11 (A–D). The mean value per genotype is represented by the middle horizontal bar with SEM measured by upper and lower horizontal bars. Statistical comparisons: *P ≤ 0.05, **P ≤ 0.01, ***P ≤ 0.001.
Next, we analyzed the generation of IgG AA, an indicator of a break in T cell tolerance [27]. Our initial analysis of permeabilized cell reactivity showed that seven of eleven cDKO mice had circulating IgG AA (Fig. 4B, middle). Similar to IgM, the majority (seven of eleven) cDKO animals also had IgG AA reactive to surface antigens (Fig. 4B, right). Again, these results were specific to the deletion of both Snai2 and Snai3. Overall, >80% of cDKO animals (nine of eleven) possessed detectable levels of circulating autoantibodies.
To evaluate B cell activity in the cDKO, we quantified Ig from the plasma of approximately three-week-old animals via enzyme-linked immunosorbent assay (ELISA). Analysis of thymus independent (TI) isotypes demonstrated increased production of both IgM and IgG3 by the cDKO (Fig. 4C, IgM mean titer: WT = 9.7 μg/mL, cDKO = 52.3 μg/mL; IgG3 mean titer: WT = 10.5 μg/mL, cDKO = 22.9 μg/mL). The c3KO also demonstrated a significant increase in IgM titers albeit not to the degree of the cDKO (IgM mean titer: c3KO = 26.6 μg/mL). Next we examined titers of thymus dependent (TD) Ig such as IgG1, IgG2b and IgG2c. For both IgG1 and IgG2c (Fig. 4D, left and right), the cDKO had equivalent titers to WT animals. However, IgG2b was significantly increased in the cDKO (Fig. 4D, middle, IgG2b mean titer: WT = 76.1 μg/mL, cDKO = 175.0 μg/mL). Interestingly, the c3KO showed a clear impairment in the generation of class-switched TD antibodies.
We then sought to characterize the autoantibodies generated by the cDKO to determine if they displayed nuclear and/or cytoplasmic reactivity. Fixed and permeabilized 3T3 fibroblasts were treated with cDKO and control plasma samples and analyzed by immunofluorescence microscopy (Fig. 5A). WT plasma served as a negative control. Plasma from H2-O−/− deficient animals served as a positive control: these animals have been shown to develop IgG2a autoantibodies specific for nuclear antigens due to defects in MHC II presentation [27]. cDKO plasma samples demonstrated a diffuse pattern of IgM reactivity present in the cytoplasm with an apparent absence of nuclear staining (Fig. 5A). As expected, WT samples were devoid of reactivity. H2-O−/− animals displayed a similar pattern of IgM staining as the cDKO. Similar to IgM, cDKO IgG reactivity was clearly dominated by a commonly shared diffuse cytoplasmic staining (Fig. 5A). Again, WT samples displayed an absence of staining. In contrast, plasma from H2-O−/− animals demonstrated a high level of IgG nuclear reactivity (Fig. 5A).
Fig. 5.

cDKO autoantibodies are dominated by reactivity to cytoplasmic antigens. (A) Immunofluorescence microscopy demonstrating the subcellular localization of reactive autoantibodies in cDKO plasma. Columns 1 and 3 demarcate nuclei with 4′,6-diamidino-2-phenylindole (DAPI). Columns 2 and 4 show the detection of autoreactive IgM and IgG, respectively. Row 1 corresponds to a representative WT sample. Rows 2–4 present 3 individual cDKO replicates (cDKO 1–3). Row 5 shows staining with H2-O−/− plasma, a positive control for anti-nuclear IgG. (B) Western immunoblot analysis of thymocyte extracts examining IgM (left) and IgG (right) autoantibodies from six cDKO mice (cDKO 1–6). Molecular weights are indicated on the left side of each blot. W= WT; H = H2-O−/−.
Western blot analysis was used to simultaneously analyze the immunoreactive patterns of multiple cDKO samples against thymocyte whole cell extracts (Fig. 5B). The left panel of Fig. 5B displays results for IgM autoreactivity comparing six cDKO samples versus WT and H2-O−/− samples. As expected, the WT sample had very minor levels of reactivity while the H2-O−/− sample served as a definitive positive control (Fig. 5B, left, lanes W and H). All six cDKO samples displayed a varying degree of IgM autoreactivity representative of an oligoclonal response. Some cDKO samples displayed reactive bands unique to a particular sample; however, the majority of samples displayed an amount of shared antigenic reactivity based on molecular weight.
Next we analyzed IgG reactivity among the six cDKO samples. The WT plasma displayed very little IgG autoreactivity with the H2-O−/− sample, again, validating the assay (Fig. 5B, right, lanes Wand H). Interestingly, cDKO samples displayed a much more limited repertoire of IgG reactive antigens as compared to IgM (Fig. 5B, left versus right, cDKO 1–6). The cDKO samples demonstrated some acquisition of IgG reactive antigens not present in the IgM analysis (Fig. 5B, left versus right, cDKO 3, ~68 kD). Additionally, there was the apparent expansion of dominant IgG secreting B cell clones in some animals (Fig. 5B, left versus right, cDKO 4, 38–40 kD). However, these types of events would not completely account for the dramatic reduction of diverse IgG autoreactivity when compared to IgM. The most likely factor contributing to the relative loss of diversified IgG reactivity would be a deficiency in T cell help.
The above in vitro-based assays clearly demonstrated that Snai2/Snai3 cDKO mice generate autoantibodies. However, we were curious as to whether the generation of these autoantibodies could be correlated with any in vivo consequences. Presented in Fig. 1 was a representative three-week-old cDKO animal with severe alopecia and dermatitis. Histological examination of dorsal (back) skin from multiple cDKO mice demonstrated a varying range of abnormalities compared to WT animals (Fig. 6A). cDKOs 1 and 2 displayed an enhanced cellularity in the dermis. In conjunction with this, cDKO 1 also demonstrated an obvious thickening of the dermis, a phenomenon common to skin disorders such as dermatitis [28]. Overall, the dermal layer of cDKO 3 was normal. Examination of the epidermal layer of all three cDKOs showed what appeared to be a rough and ruffled outermost layer of skin with obvious thickening of the layer. In contrast, the skin of WT animals possessed a smooth appearance along the epidermal layer. As with the histological examination, deposition of IgM in the skin of cDKO animals demonstrated a graded level of staining (Fig. 6B). cDKO 1 displayed the highest level of bound IgM with a non-discriminating pattern of staining in both epidermal and dermal layers which may be due to reactivity to highly prevalent self-antigens similar to what has been observed in Scurfy mice[29,30]. cDKO 2 had moderate amounts of IgM reactivity in the dermis. The pattern of IgM reactivity for cDKO 2 was more focused with the most intense staining surrounding the sebaceous glands. Unlike both cDKO 1 and 2, cDKO 3 tested negative for IgM deposition.
Fig. 6.

Immune reactivity and pathology in the skin of the cDKO animals. (A) Hematoxylin and eosin (H&E) staining of frozen dorsal skin sections from one representative WT and three cDKO mice. (B–D) Immunofluorescence images demonstrating endogenous IgM (B), IgG (C) and complement C3 (D) deposition in skin samples from (A). Images were taken with a 10× objective and scale bars represent 50 μM.
Next we evaluated skin tissue for the deposition of IgG (Fig. 6C). Again, cDKO 1 demonstrated widespread staining of endogenous IgG to both epidermal and dermal layers. IgG staining for cDKO 2 was minimal and relatively similar to background levels seen with the WT sample. Interestingly, cDKO 3 skin samples had a high level of IgG deposition in both epidermal and dermal regions of the tissue, which was in direct contrast to the IgM staining. Finally, we analyzed the deposition of complement C3 that can be locally recruited through both IgM and IgG. As shown in Fig. 6D, C3 was most heavily deposited in cDKO 1. cDKO 2 showed a marginal amount of C3 and cDKO 3 was completely negative for complement activation when compared to WT. Overall, the level of C3 deposition correlated with the level of IgM deposition (cDKO 1 > cDKO 2 > cDKO3). The data clearly demonstrated that autoantibodies are functionally present in cDKO animals.
3.5. Snai2/Snai3 cDKO mice have reduced TReg generation and function
The sum of the phenotypes of the cDKO animals suggests they possess an autoimmune disease similar to that of immunodysregulation polyendocrinopathy enteropathy X-linked syndrome (IPEX) [31] which is caused by Foxp3 mutations that impair the generation and/or function of TRegs [32]. Considering this, we analyzed WT, g2KO, c3KO and cDKO mice for the generation of natural, thymic derived (nTReg, Foxp3+ Helios+) and peripherally induced (iTReg, Foxp3+ Helios−) TRegs. Representative WT and cDKO FACS plots from analysis of both thymus and spleen are shown in Fig. 7A. Percentage of TRegs within the CD4+ compartment of the thymus and spleen is shown in top panel of Fig. 7B and the quantification of absolute cell numbers is shown in the middle panel of Fig. 7B, and demonstrated a 94% reduction of thymic TRegs compared to WT animals. Importantly, this numerical loss of TRegs was not due solely to the global reduction in thymocyte generation as the percentage of cDKO TRegs within the CD4+ compartment was reduced by 35% when compared to WT. This result is suggestive of impaired differentiation into the cDKO TReg lineage or alternatively, impaired survival of those cells. In contrast, the g2KO had a non-significant trend towards reduced output while the c3KO completely phenocopied WT. The cDKO showed depressed numbers of peripheral TRegs with nTRegs reduced 63% and iTRegs reduced 61% compared to WT.
Fig. 7.

TRegs express Snail family members and are severely decreased in cDKO animals. (A) Representative WT and cDKO FACS gating of thymic (left) and splenic (right) TRegs. CD4+ T cells were gated as Foxp3+ TRegs in the thymus. In the spleen, CD4+ T cells were divided into Foxp3+ Helios+ natural TRegs (nTReg) and Foxp3+ Helios− induced TRegs (iTReg). (B) Quantification of TRegs per category analyzed for all genotypes (top two panels). FACS-based quantification of Foxp3 gMFI for each TReg subset (bottom panel). Bars represent mean ± SEM. Number of animals per group: WT = 5, g2KO = 4, c3KO = 4, cDKO = 4; Statistical comparisons: *P ≤ 0.05, **P ≤ 0.01, ***P ≤ 0.001 (C) Transcriptional analysis of Snail gene expression in thymic and splenic TRegs isolated from Foxp3-GFP reporter mice. Snai1, Snai2 and Snai3 expression levels are depicted as transcripts per 1000 Actb. ND = not detected; Bars represent mean ± SEM. Three animals were analyzed per group.
It has previously been reported that reductions in Foxp3 protein levels can impair proper TReg function [33,34]. Analysis of the gMFI from FACS data verified that Foxp3 protein was expressed at equivalent levels between all four genotypes (Fig. 7B, bottom panel). While the data do not answer the question of whether Foxp3 is properly regulating its gene targets, it does suggest that any TReg functional defect is independent of a dysregulated Foxp3 gene locus. To further support a role for Snail family members as regulators of TReg function, we transcriptionally profiled TRegs FACS-sorted from the thymus and spleen of Foxp3–GFP reporter mice (Fig. 7C). While Snai3 was the only member expressed in thymic TRegs, all three family members were present in splenic TRegs.
To determine if the autoimmunity seen in the cDKO animals was due to defective TRegs, we adoptively transferred 7.5 × 10⁴ GFP+ TRegs isolated from the spleens of Foxp3–GFP reporter mice into 21 days old cDKO mice and monitored the recipients. For these experiments, a cohort of WT mice also received GFP+ TRegs to control for any procedural effects and a cohort of cDKO mice did not receive TRegs to assess the lifespan of unmanipulated animals. Fig. 8A shows the outward appearance of a representative cDKO on the day of TReg transfer and the same animal 28 days after receiving WT TRegs. It was clear that after receiving WT TRegs, cDKO animals had reduced dermatitis and were able to regrow their hair. All unmanipulated cDKO animals succumbed to disease and died before reaching 30 days of age (Fig. 8B, red line). However, if given WT TRegs at 21 days of age (Fig. 8B, downward arrow), cDKO animals achieved a significant extension of lifespan equivalent to that of WT animals (Fig. 8B, blue and black lines). During these experiments, two cDKOs that received WT TRegs died at days twenty-three and twenty-four of age. Analysis of growth rates over a 4-week period following WT TReg transfer demonstrated that cDKOs receiving WT TRegs were able to gain weight at kinetics equivalent to WT animals (Fig. 8C). Importantly, analysis of IgM and IgG autoantibodies (Fig. 8D and E) revealed that within 4 weeks of receiving WT TRegs, cDKO animals were essentially devoid of detectable circulating autoantibodies and possessed normal levels of total serum immunoglobulin. To support that these phenotypic reversals were due to transferred GFP+ WT TRegs, we analyzed the CD4+ populations of various organs by FACS (Fig. 8F and G). In the bone marrow, the vast majority of CD4+ Foxp3+ cells were also GFP+ (Fig. 8F, left). This was specific to the TReg compartment as CD4+ Foxp3− cells were GFP- by comparison (Fig. 8F, right). In the thymus, both WT and cDKO animals had detectable CD4+ Foxp3+ GFP+ cells indicating that mature TRegs are capable of recirculating to the thymus (Fig. 8G). Quantification showed that donor GFP+ WT TRegs contributed to the total TReg pool of various WT and cDKO organs in an equivalent fashion (Fig. 8H). Unlike in the bone marrow and spleen, WT recipients had a significantly greater number of donor GFP+ WT TRegs than the cDKO (Fig. 8I). This may reflect limitations of the cDKO thymus to support high levels of TReg residence perhaps due to prior autoimmune damage or the lack of Snai2 in the stromal environment. In total, these data suggest that GFP+ WT TRegs were able to suppress autoimmunity in cDKO mice. Additionally, this may be illustrative of a functional gap between WT and cDKO TRegs as donor WT TRegs were still the minority population in the cDKO thymus and spleen.
Fig. 8.

Adoptive transfer of WT TRegs rescues fatal autoimmune disease of cDKO animals. (A) Representative image of the same cDKO animal before (top) and 4 weeks after receiving WT TRegs (bottom). (B) Kaplan–Meier survival plot illustrating the extension of lifespan afforded cDKO animals upon transfer of WT TRegs. The black arrow marks the animal age when TRegs were transferred. Black line: WT animals +WT TRegs (N = 4); Blue line: cDKO animals +WT TRegs (N = 6); Red line: cDKO animals, no transfer (N = 6); Statistical comparisons: *P ≤ 0.05, **P ≤ 0.01. (C) Four week analysis of body mass increase following the transfer of WT TRegs. (D and E) Quantification of IgM (D) and IgG (E) autoreactivity to permeabilized cell (left) and surface antigens (right). Autoreactivity Index (AI) = gMFI per sample/mean WT gMFI, AI ≥ 2 (indicated by dotted line) is considered autoreactive; Number of animals per group: WT = 4, cDKO = 4. (F and G) Representative FACS histograms demonstrating the prevalence of GFP+ cells in the bone marrow (F) and thymus (G) of WT and cDKO recipients following WT TReg transfer. Representative histograms depicting analysis of CD4+ Foxp3+ (left) and CD4+ Foxp3− (right) cells are shown. (H and I) Quantification of GFP+ donor TRegs from multiple organs. Shown are percentages (H) and absolute numbers (I) of GFP+ donor TRegs in bone marrow, thymus and spleen. Bars represent mean ± SEM. Numbers of animals per group: 2–3 for marrow, 3–4 for thymus and spleen; Statistical comparisons: **P ≤ 0.01.
3.6. Deletion of Snai2 and Snai3 in bone marrow-derived cells is sufficient to induce autoantibody generation
The above data has demonstrated that autoimmunity resulted from the combined deletion of both Snai2 and Snai3. However, the question remained as to whether autoimmunity was due to a cell intrinsic defect or also required the stromal (i.e. non-hematopoietic) deletion of Snai2. To address this, we transplanted WT or cDKO lineage-depleted bone marrow into Rag2−/− recipients. We chose this experimental system for two reasons: (1) the use of lineage-depleted marrow would evaluate de novo generation of autoimmunity rather than the carryover of autoreactive donor B and/or T cells and (2) Rag2−/− mice never develop TRegs which have been previously shown to be radio-resistant in bone marrow transplant models and thus would suppress the development of autoimmunity in recipients of cDKO bone marrow [35]. Starting at three weeks post-transplant, we bled mice retro-orbitally once every two weeks and analyzed plasma for IgM and IgG autoantibodies. Animals were euthanized upon presentation of persistent autoantibodies (i.e. consecutive positive tests for the same autoantibody subtype) or positivity for multiple autoantibody subtypes at a given time point. Otherwise, all animals were euthanized at a pre-determined nine weeks post-transplant endpoint. As shown in Table 1, five out of seven recipients of cDKO bone marrow developed at least one subtype of autoantibody with the earliest detected onset being at 5 weeks post-transplant. Overall, transplantation of cDKO bone marrow into Rag2−/− mice resulted in an approximately 71% occurrence of autoantibody generation, similar albeit slightly reduced when compared to “whole” cDKO mice (see above). As such, the deletion of Snai2 in the stromal compartment is not required for the loss of tolerance and subsequent generation of autoantibodies.
Table 1.
Summary of autoimmune occurrence in Rag2−/− mice transplanted with Snai2/Snai3 cDKO lineage-depleted bone marrow. Three individual cDKO mice were used as donors for a total of seven Rag2−/− recipients. Time of termination, reason for termination and autoreactive indices (AI) are shown for each individual recipient. All cDKO AI are relative to the WT values for a given time point. AI indices greater than 2.0 are in bold to signify autoantibody generation.
| Recipient # | cDKO donor # | Week of termination | Reason | Surface IgM AI | Total IgM AI | Surface IgG AI | Total IgG AI |
|---|---|---|---|---|---|---|---|
| 1 | 1 | 9 | Predetermined endpoint | 0.68 | 0.44 | 0.42 | 0.09 |
| 2 | 1 | 9 | Persistent autoantibodies, Multiple autoantibody subtypes | 1.78 | 2.10 | 1.39 | 2.10 |
| 3 | 1 | 9 | Predetermined endpoint | 1.88 | 8.74 | 1.00 | 0.49 |
| 4 | 2 | 7 | Persistent autoantibodies | 1.78 | 2.37 | 0.90 | 0.71 |
| 5 | 2 | 9 | Predetermined endpoint | 0.83 | 1.20 | 0.79 | 0.24 |
| 6 | 3 | 7 | Multiple autoantibody subtypes | 2.20 | 4.52 | 1.13 | 1.55 |
| 7 | 3 | 5 | Multiple autoantibody subtypes | 1.60 | 2.40 | 1.23 | 2.17 |
Of note, there was a reduction in autoantibody subtypes concomitantly generated by autoreactive cDKO bone marrow transplants when compared to autoreactive “whole” cDKOs (Fig. 9A). While five of nine “whole” cDKOs possessed all four subtypes of autoantibodies, none of the cDKO bone marrow recipients had more than two subtypes. Previous analysis of “whole” cDKOs showed a propensity to generate IgM and IgG autoantibodies reactive to surface antigens (see Fig. 4). Re-evaluation of “whole” cDKO animals positive for autoantibodies revealed that 89% (eight of nine) and 78% (seven of nine) possessed surface reactive IgM and IgG, respectively (Fig. 9B). This was in contrast to Rag2−/− animals receiving cDKO bone marrow, which developed very limited surface reactivity with a 20% (one of five) incidence rate of surface reactive IgM and no instances of surface reactive IgG (zero of five). In contrast, all five recipients of cDKO bone marrow generated IgM cross-reactive to total cellular antigens (permeabilized cells) and two of these animals progressed to the generation of IgG cross-reactive to total cellular antigens.
Fig. 9.
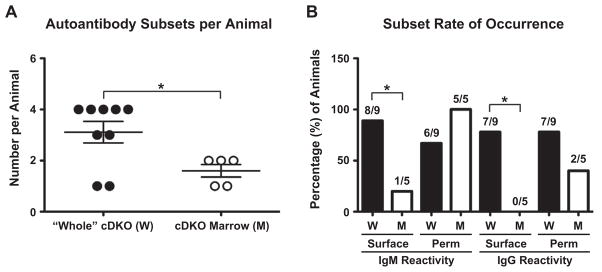
Rag2−/− recipients of cDKO bone marrow predominantly generate autoantibodies to total cellular antigens. (A) The number of autoantibody subtypes per autoimmune “whole” cDKO (W) and Rag2−/− recipient of cDKO bone marrow (M). Number of animals per group: W= 9, M = 5. The mean value per genotype is represented by the middle horizontal bar with SEM measured by upper and lower horizontal bars. (B) Analysis of surface versus total cellular (permeabilized cells, Perm) antigen reactivity in “whole” cDKOs (W) and Rag2−/− animals receiving cDKO bone marrow (M). Bars represent percentage of animals positive for a subtype within the total population. Actual numbers of animals are shown above each bar. Statistical comparisons: *P ≤ 0.05.
Gross physical examination of cDKO bone marrow recipients showed no signs of alopecia or skin inflammation (Fig. 10A). Nor did these animals display any indicators of illness such as weight loss when compared to WT bone marrow recipients (Fig. 10B). This suggested that the autoimmune disease of these animals was either limited in scope (i.e. limited target tissues) or in its relative infancy. Next we characterized cDKO bone marrow recipient hematopoiesis in a manner similar to that used for the “whole” cDKOs (see above). Recipients of WT and cDKO bone marrow showed no disparities in lymphoid organ mass (Fig. 10C) and the thymus and spleen had equivalent cellularity (Fig. 10D). Interestingly, the bone marrow had a non-significant (p = 0.11) trend that represented a 25% reduction in total cell numbers (Fig. 10D). Analysis of bone marrow constituents demonstrated that while B cell development was unperturbed in the cDKO recipients, both monocytes (P = 0.06) and neutrophils (PMN) (P = 0.10) were reduced by 27% and 29%, respectively (Fig. 11A). Similar to B cell development in the bone marrow, thymic T cell development in cDKO recipients displayed no abnormalities (Fig. 11B). The lack of lymphocyte defects was not an artifact of potentially examining animals at a point of homeostasis. Analysis of lineages in the blood starting at three weeks post-transplant further demonstrated equivalent generation of B and T lymphocytes between the two genotypes (Supplementary Fig. 7). Finally, we examined the TReg compartment; which was previously shown to be developmentally deficient in the “whole” cDKO (see Fig. 7). As a percentage of CD4+ T cells and as total cell numbers, cDKO bone marrow was equivalent to WT in the ability to generate TRegs when transplanted into the Rag2−/− background (Fig. 12). This meant that even in a scenario where normal numbers of cDKO TRegs were present, self-tolerance still was not maintained. Overall, these results support the conclusion that the loss of immune tolerance is, at the very least, partially attributable to the combined deletion of Snai2 and Snai3 in hematopoietic lineages. However, the deletion of Snai2 in the stroma appears to significantly contribute to disease progression and severity. Further bone marrow transplantation experiments comparing disease parameters using Rag2−/− and Snai2−/− Rag2−/− double knockout recipients will be essential in determining the role of Snai2 expressing stromal compartments in immune tolerance.
Fig. 10.

Rag2−/− recipients of cDKO bone marrow are physically indistinguishable from animals receiving WT bone marrow. (A) Representative images of Rag2−/− receiving WT (left) and cDKO (right) bone marrow. (B) Longitudinal analysis of body mass change over the course of nine weeks post-transplant. Thymus and spleen relative masses (C) and bone marrow, thymus and spleen total cell counts (D) from Rag2−/− recipients of WT and cDKO bone marrow. Five Rag2−/− mice received WT bone marrow from three individual donors. Seven Rag2−/− mice received cDKO bone marrow from three individual donors.
Fig. 11.

Rag2−/− recipients of cDKO bone marrow develop normal numbers of B and T cells but still retain a deficiency in myeloid lineage development. (A) Quantification of total cell numbers of pre-Pro B cells, committed B cells, monocytes and neutrophils. pre-Pro B cells: B220+ CD19−; committed B cells: B220+ CD19+; Monocytes: CD11b+ Gr-1LO/INT; Neutrophils (PMN): CD11b+ Gr-1HI (B) Quantification of the number CD4 and CD8 double negative (DN), CD4 and CD8 double positive (DP), CD4 single positive (CD4SP) and CD8 single positive (CD8SP) cells per thymus. (A and B) Bars represent mean ± SEM. Number of animals per group: WT = 5, cDKO = 6–7.
Fig. 12.

Rag2−/− recipients of cDKO bone marrow develop normal numbers of TRegs. (A) Quantification of TRegs as a percentage of CD4 single positive T cells in both the thymus and spleen. (B) Quantification of total numbers of TRegs in both the thymus and spleen. (A and B) CD4+ T cells were gated as Foxp3+ TRegs in the thymus. In the spleen, CD4+ T cells were divided into Foxp3+ Helios+ natural TRegs (nTReg) and Foxp3+ Helios− induced TRegs (iTReg). Bars represent mean ± SEM. Number of animals per group: WT = 5, cDKO = 6–7.
3.7. Wildtype TRegs block autoantibody generation in recipients of cDKO bone marrow
Data from Fig. 8 clearly demonstrated that the adoptive transfer of WT TRegs was capable of suppressing autoimmune disease in the “whole” cDKO. However, Rag2−/− recipients that received cDKO bone marrow generated IgM and IgG autoantibodies even with normal numbers of TRegs present (Table 1 and Fig. 12). In an effort to further support the hypothesis of dysfunctional cDKO TRegs, we repeated the bone marrow transplantation using WT recipients. As stated above, these animals would possess a pool of radioresistant WT TRegs native to the recipient animals and thus should not develop autoimmunity. Indeed, that was the case. By twelve weeks post-transplant, none of the cDKO recipients developed autoantibodies (Table 2).
Table 2.
Summary of autoimmune occurrence in WT mice transplanted with Snai2/Snai3 cDKO lineage-depleted bone marrow. Two individual cDKO mice were used as donors for a total of four WT recipients. Time of termination, reason for termination and autoreactive indices (AI) are shown for each individual recipient. All cDKO AI are relative to the WT values for a given time point.
| Recipient # | cDKO donor # | Week of termination | Reason | Surface IgM AI | Total IgM AI | Surface IgG AI | Total IgG AI |
|---|---|---|---|---|---|---|---|
| 1 | 1 | 12 | Predetermined endpoint | 0.65 | 0.19 | 0.40 | 0.17 |
| 2 | 1 | 12 | Predetermined endpoint | 0.95 | 0.41 | 0.53 | 0.25 |
| 3 | 2 | 12 | Predetermined endpoint | 1.43 | 0.99 | 0.76 | 0.52 |
| 4 | 2 | 12 | Predetermined endpoint | 1.03 | 0.68 | 0.74 | 1.33 |
As with Rag2−/− recipients, WT recipients of cDKO bone marrow demonstrated normal B and T cell development (Fig. 13 and DNS). However, WT recipients also demonstrated normal myeloid development (Fig. 13). This suggested that the loss of myeloid cells in Rag2−/− recipients was due to the autoimmune environment rather than a cell intrinsic defect of Snai2/3 cDKO bone marrow.
Fig. 13.
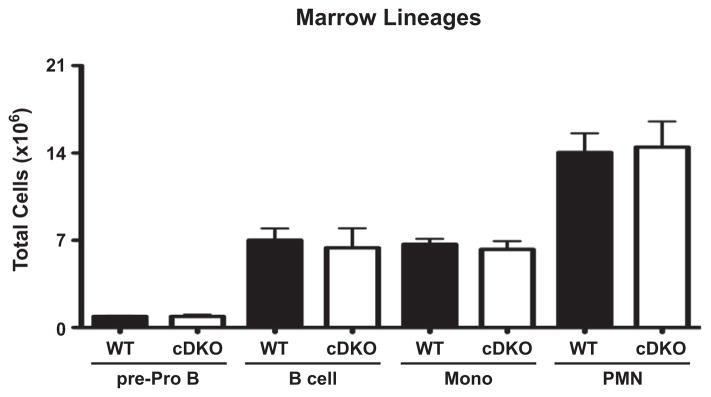
WT recipients of cDKO bone marrow develop normal levels of bone marrow lineages. Quantification of total cell numbers of pre-Pro B cells, committed B cells, monocytes and neutrophils. pre-Pro B cells: B220+ CD19−; committed B cells: B220+ CD19+; Monocytes: CD11b+ Gr-1LO/INT; Neutrophils (PMN): CD11b+ Gr-1HI; Bars represent mean ± SEM. Number of animals per group: WT = 4, cDKO = 4.
To validate that the observed differences were due to the persistence of radioresistant WT TRegs, we FACS-sorted various splenic cell populations and quantified the presence of Snai2 WT and KO alleles via PCR of genomic DNA (gDNA). Fig. 14A shows representative genotyping of TConv (C, CD4+ CD25−), TReg (R, CD4+ CD25+) and B (CD19+) cells sorted from one WT and two cDKO reconstituted animals. In total, four animals from each “genotype” were analyzed. Tail gDNA from Snai2+/− animals was used to normalize amplicon signal intensity relative to genetic contribution. PhosphorImager-based quantification of 32P radioactivity demonstrated that approximately 59% of TConv were derived from cDKO donor marrow at twelve weeks post-transplant (Fig. 14B). In contrast, only approximately 39% of TRegs were generated from cDKO marrow. Not surprisingly, almost all B cells were derived from cDKO donor marrow. In summary, we used two bone marrow transplantation systems where essentially the only variable was the presence or absence of a radioresistant TReg pool. Only animals lacking a WT TReg pool demonstrated the capacity to develop autoimmunity (i.e. autoantibodies) further suggesting a functional gap between WT and cDKO TRegs. However, further studies will be needed to formally address this issue.
Fig. 14.

Autoimmune-resistant WT recipients of cDKO bone marrow possess a persistent pool of WT TRegs. (A) Representative genotyping PCR performed via incorporation of [32P] deoxycytidine triphosphate. Samples from one WT and two cDKO animals are shown. Het Ctrl = Snai2+/− tail gDNA, C = TConv, R = TReg. (B) Quantification of Snai2 WT and KO genetic contribution per cell population analyzed. Bars represent mean ± SEM. Number of animals per group: WT = 4, cDKO = 4; Statistical comparisons: *P ≤ 0.05, ***P ≤ 0.001.
4. Discussion
In this report, we describe the generation and characterization of the Snai2/Snai3 conditional double knockout. These animals developed a florid autoimmunity in conjunction with severe impairment in both B and T cell generation. The cDKO animals demonstrated an autoimmune phenotype inclusive of alopecia and the generation of both IgM and IgG autoantibodies, which culminated in the demise of mice by 30 days post birth. Adoptive transfer of WT TRegs into cDKO animals alleviated autoimmune symptoms and significantly extended the lifespan of cDKO animals. This suggested that cDKO B and T cells were ultimately responsive to peripheral regulatory mechanisms and that a cDKO TReg defect may contribute to autoimmune disease.
Since cDKO mice possessed a germline deletion of Snai2, it was important to determine whether or not the stromal loss of Snai2 contributed to the phenotypes observed in the “whole” cDKO. To test this, we transplanted cDKO marrow into Rag2−/− recipients and analyzed these animals for hematopoietic defects and various autoimmune symptoms. Rather interestingly, the reconstitution of Snai2 into the stromal environment blunted many of the phenotypes observed in the “whole” cDKO. Unlike “whole” cDKO animals, Rag2−/− recipients of cDKO marrow displayed unperturbed B and T cell development. However, myeloid development was still impaired in these animals. The simplest interpretation is that gene products regulated by Snai2 in the stroma may interact with gene products regulated by Snai3 (and possibly also Snai2). This would likely involve receptor-ligand pairs important for lymphocyte development such as IL-7/IL-7Rα, CXCL12/CXCR4 and others [36,37]. Previous analysis of protein expression demonstrated detectable Snai2 in bone marrow whole cell lysates. In contrast, Snai2 protein was only faintly detectable in the thymus suggesting that the ETP defect originated in the bone marrow [20,37]. This was not directly assayed here. An alternative hypothesis is that the observed B and T cell defects were directly affected by autoimmunity in the “whole” cDKO. In regards to B cells, this has been previously observed in Scurfy mice in which pro-inflammatory cytokines were presumed to be the driving force [25,38].
In total, five of the seven Rag2−/− recipients of cDKO bone marrow developed autoantibodies by nine weeks post-transplant demonstrating a hematopoietic cell intrinsic redundancy for Snai2/Snai3 in regulating some level of immune tolerance. Curiously, unlike the “whole” cDKOs, there was very little reactivity to surface antigens. Since we used WT thymocytes to detect autoreactivity, it is possible that the lack of surface reactivity may explain the non-existent T cell developmental defects in Rag2−/− recipients. Along these lines, surface reactive autoantibodies would contribute to direct killing of T cells through antibody-dependent cell-mediated cytotoxicity (ADCC) and complement activation. The resultant inflammation may further poison the thymic microenvironment. This might also account for the impaired B cell pipeline in the “whole” cDKO [38].
Surface autoreactivity would be expected to drive autoimmunity more potently than reactivity to intracellular components. The reasoning behind this is that surface antigens are continuously exposed to the extracellular environment and thus, potential autoantibodies. In contrast, intracellular antigens are “hidden” the majority of the time. An obvious question then becomes, how does stromal expression of Snai2 regulate autoantibody repertoire? A potential explanation for this is that Snai2 may augment the expression of a particular set of surface proteins in a tissue specific manner. In this model, Snai2 would repress the expression of certain “autoreactive” surface proteins so that low-to-moderate affinity autoreactive B cells would not encounter these proteins at levels required for activation. However, if Snai2 is deleted, then these “autoreactive” proteins would be overexpressed leading to a more robust activation of autoreactive B cells. It is also possible that germline deletion of Snai2 contributes to disease though the sensitization of animals to apoptosis. Multiple systems have shown that Snai2 repression of Puma is crucial in preserving cell survival when challenged with various “stressors” [39–41]. These non-mutually exclusive models would position the stromal deletion of Snai2 as a disease accelerator rather than a gatekeeper. This hypothesis would be in line with our data showing that although cDKO bone marrow in itself leads to a loss of tolerance, the overall severity of disease (i.e. alopecia, lethality), but not occurrence (i.e. autoantibody generation), were seemingly diminished in a Snai2 sufficient background. To fully evaluate these possibilities, we will need to compare the transplantation of cDKO bone marrow into Snai2−/−, Rag2−/− and Rag2−/− Snai2−/− double knockout recipients not only examining hematopoiesis but also autoimmune disease parameters.
Adoptive transfer of WT TRegs was able to dampen autoimmunity in cDKO mice. This meant that cDKO B and TConv cells still retained sensitivity to peripheral regulatory mechanisms. WT TReg expansion was evident in cDKO recipients as the combined output from the thymus and spleen was more than that initially transferred (8.6 × 10⁴ versus 7.5 × 10⁵ GFP+ TRegs). However, at least in the thymus and spleen, donor TRegs were still a minority contributor to the total TReg pool. Interestingly, both WT and cDKO recipients demonstrated an equivalent accumulation of GFP+ TRegs in the bone marrow. The significance of this is not currently understood. However, the data in total suggested that perhaps enhanced function of WT TRegs rather than inflated cellular number may have been the main contributor to disease alleviation. In support of this, Rag2−/− recipients of cDKO bone marrow developed autoantibodies in spite of normal numbers of cDKO TRegs. In contrast, WT recipients of cDKO bone marrow maintained a pool of radioresistant WT TRegs (approximately 61% of total TRegs) and did not generate autoantibodies. Essentially, the only difference between these two bone marrow transplantation studies was the presence of radioresistant WT TRegs further supporting that a cDKO regulatory T cell defect contributes to cDKO autoimmune disease. However, future experiments will be needed to define the potential defect(s) of cDKO TRegs.
The final question to address is why the phenotype of the cDKO animal is so much more profound than that found in the genomic Snai2/Snai3 deletion model. While both models demonstrated an approximately 50% reduction in animal masses, only the cDKO presented with alopecia, dermatitis and the generation of autoantibodies. Within the first days of life, cDKO animals developed autoimmune disease while we were able to age gDKO animals to six months of age with no indication of autoimmunity [20]. To the extent of our knowledge, the conditional deletion of a gene(s) has always resulted in phenotypes less severe than a whole-organism germline deletion. That is not the case in this instance. One possible explanation may be the global epigenetic upregulation of Snai1 in the gDKO to compensate for the whole-organism loss of the Snai2 and Snai3 genes. It has been previously shown that Snai1 and Snai2 can reciprocally antagonize the gene expression of the other family member [42]. Indeed, germline deletion of Snai2 has led to the upregulation of Snai1 in tissues previously devoid of Snai1 gene expression [13]. Introduction of a conditional Snai1 allele into the gDKO background (along with Vav-Cre) would provide a model to test this hypothesis.
In summary, we have identified the Snail family as novel transcriptional regulators necessary for the maintenance of immune tolerance. The autoimmunity generated in the cDKO mice is identifiable proximal to birth and quickly leads to the death of the animal unless they are rescued by the introduction of exogenous WT TRegs. Importantly, hematopoietically intrinsic defects contribute to cDKO autoimmunity as Rag2−/− recipients of cDKO bone marrow generated autoantibodies.
Supplementary Material
Acknowledgments
The authors would like to thank the University of Utah Flow Cytometry Core Facility. We would like to thank the Weis labs for their critique of this work and many intellectual contributions. Thank you to Hannah Pioli and KimAnh Pioli for assistance with genotyping.
The Department of Pathology and the Weber Presidential Endowed Chair in Immunology provided research funding. Usage of the FacsAria flow cytometer was supported by NIH #1S10RR026802-01. J.J.W. was supported by NIH AR43521 and AI32223. P.D.P. was supported as a pre-doctoral trainee on the NIH Hematology T32 training Grant, #T-32DK007115-38.
Appendix A. Supplementary data
Supplementary data associated with this article can be found, in the online version, at http://dx.doi.org/10.1016/j.cellimm.2015.02.009.
Footnotes
The authors have no competing financial interests.
References
- 1.Scott EW, Fisher RC, Olson MC, Kehrli EW, Simon MC, Singh H. PU.1 functions in a cell-autonomous manner to control the differentiation of multipotential lymphoid-myeloid progenitors. Immunity. 1997;6:437–447. doi: 10.1016/s1074-7613(00)80287-3. [DOI] [PubMed] [Google Scholar]
- 2.Fontenot JD, Rasmussen JP, Williams LM, Dooley JL, Farr AG, Rudensky AY. Regulatory T cell lineage specification by the forkhead transcription factor foxp3. Immunity. 2005;22:329–341. doi: 10.1016/j.immuni.2005.01.016. [DOI] [PubMed] [Google Scholar]
- 3.Sakaguchi S. Regulatory T Cells: key controllers of immunologic self-tolerance. Cell. 2000;101:455–458. doi: 10.1016/s0092-8674(00)80856-9. [DOI] [PubMed] [Google Scholar]
- 4.Fujiwara Y, Chang AN, Williams AM, Orkin SH. Functional overlap of GATA-1 and GATA-2 in primitive hematopoietic development. Blood. 2004;103:583– 585. doi: 10.1182/blood-2003-08-2870. [DOI] [PubMed] [Google Scholar]
- 5.Manzanares M, Locascio A, Nieto MA. The increasing complexity of the Snail gene superfamily in metazoan evolution. Trends Genet. 2001;17:178–181. doi: 10.1016/s0168-9525(01)02232-6. [DOI] [PubMed] [Google Scholar]
- 6.Manzanares M, Blanco MJ, Nieto MA. Snail3 orthologues in vertebrates: divergent members of the Snail zinc-finger gene family. Dev Genes Evol. 2004;214:47–53. doi: 10.1007/s00427-003-0373-1. [DOI] [PubMed] [Google Scholar]
- 7.Barrallo-Gimeno A, Nieto MA. Evolutionary history of the Snail/Scratch superfamily. Trends Genet. 2009;25:248–252. doi: 10.1016/j.tig.2009.04.001. [DOI] [PubMed] [Google Scholar]
- 8.Kataoka H, Murayama T, Yokode M, Mori S, Sano H, Ozaki H, et al. A novel snail-related transcription factor Smuc regulates basic helix-loop-helix transcription factor activities via specific E-box motifs. Nucleic Acids Res. 2000;28:626–633. doi: 10.1093/nar/28.2.626. [DOI] [PMC free article] [PubMed] [Google Scholar]
- 9.Soleimani VD, Yin H, Jahani-Asl A, Ming H, Kockx CE, van Ijcken WF, et al. Snail regulates MyoD binding-site occupancy to direct enhancer switching and differentiation-specific transcription in myogenesis. Mol Cell. 2012;47:457–468. doi: 10.1016/j.molcel.2012.05.046. [DOI] [PMC free article] [PubMed] [Google Scholar]
- 10.Ferrari-Amorotti G, Fragliasso V, Esteki R, Prudente Z, Soliera AR, Cattelani S, et al. Inhibiting interactions of lysine demethylase LSD1 with snail/slug blocks cancer cell invasion. Cancer Res. 2013;73:235–245. doi: 10.1158/0008-5472.CAN-12-1739. [DOI] [PMC free article] [PubMed] [Google Scholar]
- 11.Herranz N, Pasini D, Diaz VM, Franci C, Gutierrez A, Dave N, et al. Polycomb complex 2 is required for E-cadherin repression by the Snail1 transcription factor. Mol Cell Biol. 2008;28:4772–4781. doi: 10.1128/MCB.00323-08. [DOI] [PMC free article] [PubMed] [Google Scholar]
- 12.Peinado H, Ballestar E, Esteller M, Cano A. Snail mediates E-cadherin repression by the recruitment of the Sin3A/histone deacetylase 1 (HDAC1)/HDAC2 complex. Mol Cell Biol. 2004;24:306–319. doi: 10.1128/MCB.24.1.306-319.2004. [DOI] [PMC free article] [PubMed] [Google Scholar]
- 13.Chen Y, Gridley T. Compensatory regulation of the Snai1 and Snai2 genes during chondrogenesis. J Bone Miner Res. 2013;28:1412–1421. doi: 10.1002/jbmr.1871. [DOI] [PMC free article] [PubMed] [Google Scholar]
- 14.Barrallo-Gimeno A, Nieto MA. The Snail genes as inducers of cell movement and survival: implications in development and cancer. Development. 2005;132:3151–3161. doi: 10.1242/dev.01907. [DOI] [PubMed] [Google Scholar]
- 15.Pioli PD, Weis JH. Snail transcription factors in hematopoietic cell development: a model of functional redundancy. Exp Hematol. 2014;42:425–430. doi: 10.1016/j.exphem.2014.03.002. [DOI] [PMC free article] [PubMed] [Google Scholar]
- 16.Lomeli H, Starling C, Gridley T. Epiblast-specific Snai1 deletion results in embryonic lethality due to multiple vascular defects. BMC Res Notes. 2009;2:22. doi: 10.1186/1756-0500-2-22. [DOI] [PMC free article] [PubMed] [Google Scholar]
- 17.Carver EA, Jiang R, Lan Y, Oram KF, Gridley T. The mouse snail gene encodes a key regulator of the epithelial-mesenchymal transition. Mol Cell Biol. 2001;21:8184–8188. doi: 10.1128/MCB.21.23.8184-8188.2001. [DOI] [PMC free article] [PubMed] [Google Scholar]
- 18.Perez-Losada J, Sanchez-Martin M, Rodriguez-Garcia A, Sanchez ML, Orfao A, Flores T, et al. Zinc-finger transcription factor Slug contributes to the function of the stem cell factor c-kit signaling pathway. Blood. 2002;100:1274–1286. [PubMed] [Google Scholar]
- 19.Bradley CK, Norton CR, Chen Y, Han X, Booth CJ, Yoon JK, et al. The snail family gene snai3 is not essential for embryogenesis in mice. PLoS ONE. 2013;8:e65344. doi: 10.1371/journal.pone.0065344. [DOI] [PMC free article] [PubMed] [Google Scholar]
- 20.Pioli PD, Dahlem TJ, Weis JJ, Weis JH. Deletion of Snai2 and Snai3 results in impaired physical development compounded by lymphocyte deficiency. PLoS ONE. 2013;8:e69216. doi: 10.1371/journal.pone.0069216. [DOI] [PMC free article] [PubMed] [Google Scholar]
- 21.Anderson G, Takahama Y. Thymic epithelial cells: working class heroes for T cell development and repertoire selection. Trends Immunol. 2012;33:256–263. doi: 10.1016/j.it.2012.03.005. [DOI] [PubMed] [Google Scholar]
- 22.Pioli PD, Debnath I, Weis JJ, Weis JH. Zfp318 regulates IgD expression by abrogating transcription termination within the Ighm/Ighd locus. J Immunol. 2014 doi: 10.4049/jimmunol.1401275. [DOI] [PMC free article] [PubMed] [Google Scholar]
- 23.Cho S, Spangrude GJ. Enrichment of functionally distinct mouse hematopoietic progenitor cell populations using CD62L. J Immunol. 2011;187:5203–5210. doi: 10.4049/jimmunol.1102119. [DOI] [PMC free article] [PubMed] [Google Scholar]
- 24.Perry SS, Wang H, Pierce LJ, Yang AM, Tsai S, Spangrude GJ. L-selectin defines a bone marrow analog to the thymic early T-lineage progenitor. Blood. 2004;103:2990–2996. doi: 10.1182/blood-2003-09-3030. [DOI] [PubMed] [Google Scholar]
- 25.Leonardo SM, Josephson JA, Hartog NL, Gauld SB. Altered B cell development and anergy in the absence of Foxp3. J Immunol. 2010;185:2147–2156. doi: 10.4049/jimmunol.1000136. [DOI] [PubMed] [Google Scholar]
- 26.Hibbs ML, Tarlinton DM, Armes J, Grail D, Hodgson G, Maglitto R, et al. Multiple defects in the immune system of Lyn-deficient mice, culminating in autoimmune disease. Cell. 1995;83:301–311. doi: 10.1016/0092-8674(95)90171-x. [DOI] [PubMed] [Google Scholar]
- 27.Gu Y, Jensen PE, Chen X. Immunodeficiency and autoimmunity in H2-O-deficient mice. J Immunol. 2013;190:126–137. doi: 10.4049/jimmunol.1200993. [DOI] [PubMed] [Google Scholar]
- 28.Ando T, Xiao W, Gao P, Namiranian S, Matsumoto K, Tomimori Y, et al. Critical role for mast cell Stat5 activity in skin inflammation. Cell Rep. 2014;6:366–376. doi: 10.1016/j.celrep.2013.12.029. [DOI] [PMC free article] [PubMed] [Google Scholar]
- 29.Huter EN, Natarajan K, Torgerson TR, Glass DD, Shevach EM. Autoantibodies in scurfy mice and IPEX patients recognize keratin 14. J Invest Dermatol. 2010;130:1391–1399. doi: 10.1038/jid.2010.16. [DOI] [PMC free article] [PubMed] [Google Scholar]
- 30.Aschermann S, Lehmann CH, Mihai S, Schett G, Dudziak D, Nimmerjahn F. B cells are critical for autoimmune pathology in Scurfy mice. Proc Natl Acad Sci USA. 2013;110:19042–19047. doi: 10.1073/pnas.1313547110. [DOI] [PMC free article] [PubMed] [Google Scholar]
- 31.Bennett CL, Ochs HD. IPEX is a unique X-linked syndrome characterized by immune dysfunction, polyendocrinopathy, enteropathy, and a variety of autoimmune phenomena. Curr Opin Pediatr. 2001;13:533–538. doi: 10.1097/00008480-200112000-00007. [DOI] [PubMed] [Google Scholar]
- 32.Bennett CL, Christie J, Ramsdell F, Brunkow ME, Ferguson PJ, Whitesell L, et al. The immune dysregulation, polyendocrinopathy, enteropathy, X-linked syndrome (IPEX) is caused by mutations of FOXP3. Nat Genet. 2001;27:20–21. doi: 10.1038/83713. [DOI] [PubMed] [Google Scholar]
- 33.Ouyang W, Beckett O, Ma Q, Paik JH, DePinho RA, Li MO. Foxo proteins cooperatively control the differentiation of Foxp3+ regulatory T cells. Nat Immunol. 2010;11:618–627. doi: 10.1038/ni.1884. [DOI] [PubMed] [Google Scholar]
- 34.Miyazaki M, Miyazaki K, Chen S, Itoi M, Miller M, Lu LF, et al. Id2 and Id3 maintain the regulatory T cell pool to suppress inflammatory disease. Nat Immunol. 2014;15:767–776. doi: 10.1038/ni.2928. [DOI] [PMC free article] [PubMed] [Google Scholar]
- 35.Komatsu N, Hori S. Full restoration of peripheral Foxp3+ regulatory T cell pool by radioresistant host cells in scurfy bone marrow chimeras. Proc Natl Acad Sci USA. 2007;104:8959–8964. doi: 10.1073/pnas.0702004104. [DOI] [PMC free article] [PubMed] [Google Scholar]
- 36.Nagasawa T. Microenvironmental niches in the bone marrow required for B-cell development. Nat Rev Immunol. 2006;6:107–116. doi: 10.1038/nri1780. [DOI] [PubMed] [Google Scholar]
- 37.Lai AY, Kondo M. Identification of a bone marrow precursor of the earliest thymocytes in adult mouse. Proc Natl Acad Sci USA. 2007;104:6311–6316. doi: 10.1073/pnas.0609608104. [DOI] [PMC free article] [PubMed] [Google Scholar]
- 38.Nakamura K, Kouro T, Kincade PW, Malykhin A, Maeda K, Coggeshall KM. Src homology 2-containing 5-inositol phosphatase (SHIP) suppresses an early stage of lymphoid cell development through elevated interleukin-6 production by myeloid cells in bone marrow. J Exp Med. 2004;199:243–254. doi: 10.1084/jem.20031193. [DOI] [PMC free article] [PubMed] [Google Scholar]
- 39.Wu WS, Heinrichs S, Xu D, Garrison SP, Zambetti GP, Adams JM, et al. Slug antagonizes p53-mediated apoptosis of hematopoietic progenitors by repressing puma. Cell. 2005;123:641–653. doi: 10.1016/j.cell.2005.09.029. [DOI] [PubMed] [Google Scholar]
- 40.Kim S, Yao J, Suyama K, Qian X, Qian BZ, Bandyopadhyay S, et al. Slug promotes survival during metastasis through suppression of puma-mediated apoptosis. Cancer Res. 2014;74:3695–3706. doi: 10.1158/0008-5472.CAN-13-2591. [DOI] [PMC free article] [PubMed] [Google Scholar]
- 41.Arienti C, Tesei A, Carloni S, Ulivi P, Romeo A, Ghigi G, et al. SLUG silencing increases radiosensitivity of melanoma cells in vitro. Cell Oncol. 2013;36:131–139. doi: 10.1007/s13402-012-0120-6. [DOI] [PubMed] [Google Scholar]
- 42.Chen Y, Gridley T. The SNAI1 and SNAI2 proteins occupy their own and each other’s promoter during chondrogenesis. Biochem Biophys Res Commun. 2013;435:356–360. doi: 10.1016/j.bbrc.2013.04.086. [DOI] [PMC free article] [PubMed] [Google Scholar]
Associated Data
This section collects any data citations, data availability statements, or supplementary materials included in this article.