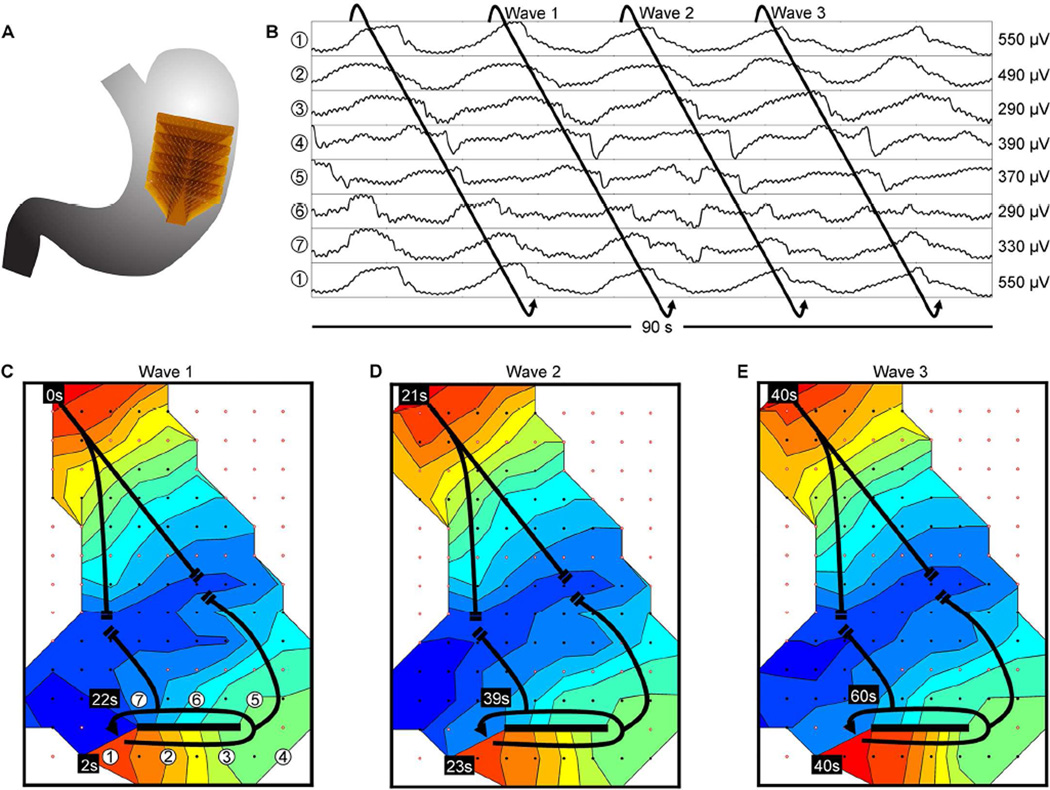
Figure 6.
Slow wave re-entry; isochronal intervals = 2 seconds. (A) Position of the array. (B) Representative electrograms from positions indicated in C; electrode 1 is repeated at the bottom of the electrograms to illustrate the continuity of the re-entrant circuit. (C–E) Isochronal activation maps. Activation propagated in a circuit around a linear conduction block (thick black line), re-activating that same circuit over successive cycles, thereby establishing re-entry (frequency, 3.3 ± 0.2 cycles/min). Slow wave activity propagated outward from the re-entrant circuit, in part colliding with an uncoupled antegrade-propagating wavefront. See Supplementary Video 3 for animation.

