

Abstract
CpG islands (CGIs) are associated with over half of human gene promoters and are characterized by a unique chromatin environment and high levels of bidirectional transcriptional activity relative to surrounding genomic regions, suggesting that RNA polymerase (Pol II) progression past the CGI boundaries is restricted. Here we describe a novel transcriptional regulatory step wherein Pol II encounters an additional barrier to elongation distinct from the promoter-proximal pause and occurring at the downstream boundary of the CGI domain. For most CGI-associated promoters, Pol II exhibits a dominant pause at either the promoter-proximal or this distal site that correlates, both in position and in intensity, with local regions of high GC skew, a sequence feature known to form unique secondary structures. Upon signal-induced gene activation, long-range enhancer contacts at the dominant pause site are selectively enhanced, suggesting a new role for enhancers at the downstream pause. These data point to an additional level of control over transcriptional output at a subset of CGI-associated genes that is linked to DNA sequence and the integrity of the CGI domain.
Roughly 60% of human promoters are associated with a CpG island (CGI), most of which lack DNA methylation and maintain a chromatin structure that is permissive to transcription; the acquisition of DNA methylation at a small percentage of these promoters during development or disease is associated with stable gene silencing (Deaton and Bird 2011; Jones 2012). Histone modifying enzymes contain embedded or associated reader domains capable of recognizing methylated or unmethylated CpGs, allowing for crosstalk between DNA methylation state and local chromatin structure (Hashimoto et al. 2010). For example, CGIs are maintained in a transcriptionally permissive state in part through the recognition of unmethylated DNA by a component of the H3K4 methyltransferase complex and the inability of de novo DNA methyltransferases to act on H3K4 modified chromatin (Jia et al. 2007; Thomson et al. 2010). As a result, there is an inverse relationship between DNA methylation and H3K4 methylation, with unmethylated CGI domains uniquely marked by H3K4me3 genome-wide. DNA sequence features have also been reported to promote or to prevent DNA methylation at CGIs (Feltus et al. 2003; Bock et al. 2006; Ginno et al. 2012). How chromatin structure and DNA sequence converge to regulate transcription initiation and elongation at CGIs is not well understood.
Genome-wide studies of RNA polymerase (Pol) II occupancy and nascent transcription have demonstrated that a significant component of transcriptional regulation occurs at post-initiation steps in the transcription cycle. Promoter-proximal pausing has emerged as an important point of post-initiation transcriptional regulation that is conserved across metazoans (Adelman and Lis 2012; Kwak and Lis 2013). After transcribing ∼50 bp, initiated Pol II pauses, awaiting additional signals for controlled release into productive elongation. This allows for rapid and/or synchronous gene activation in response to a wide variety of environmental or developmental cues. In most cases, elongation past this point requires the recruitment of positive transcription elongation factor B (P-TEFb) complex, which phosphorylates the C-terminal domain of Pol II, as well as components of the negative regulatory complexes NELF and DRB sensitivity-inducing factor (DSIF), promoting their dissociation/inactivation and the release of Pol II into active elongation (Gilchrist et al. 2010). While transient pausing is thought to be a feature of most active transcription, the degree to which this step becomes rate-limiting varies across genes and is subject to context-dependent and locus-specific modulation, presumably by factors affecting the local recruitment and/or activity of the P-TEFb complex. Central among these is bromodomain-containing protein 4 (BRD4), which directs P-TEFb to acetylated nucleosomes while also antagonizing its sequestration by the HEXIM1 complex (Jang et al. 2005; Yang et al. 2005; Liu et al. 2014).
Recent studies suggest that distal enhancer interactions play a key role in mediating these events. Enhancers are cis-acting regulatory elements that control transcription from a distance through the formation of contacts between the enhancer-bound transcription factors and promoter-bound Pol II and the looping out of intervening chromatin (Kagey et al. 2010b). BRD4 and components of the P-TEFb complex have been shown to colocalize with elongating (serine-2-phosphorylated) Pol II at both the promoters and enhancers of active genes, and inhibition of either suppresses not only elongation of promoter-derived mRNAs but also that of noncoding “eRNAs” arising at distal enhancers (Zhang et al. 2012; Anand et al. 2013; Liu et al. 2013; Loven et al. 2013; Kanno et al. 2014). In addition, long-range chromatin looping interactions have been shown to correlate with paused Pol II during Drosophila development (Ghavi-Helm et al. 2014). The relationships among chromatin looping interactions, enhancer activity, and Pol II pausing dynamics are incompletely understood.
In this study, we investigate the relationship between DNA sequence features, chromatin structure, and RNA Pol II pausing dynamics in the regulation of transcription at CGI promoters. We identify and characterize a novel Pol II pause point distinct from the promoter-proximal pause defined by local DNA sequence features that is coincident with the downstream edge of the CGI domain and serves as the predominant barrier to elongation at a significant fraction of CGI-associated genes.
Results
Genome-wide mapping of nascent transcription has shown that unmethylated CGI promoters support high levels of bidirectional (divergent) transcription, but productive elongation in only one direction, and that the levels of activity in the promoter region are poorly correlated with the levels of steady-state transcript (Core et al. 2008). This implies that there may be additional levels of transcriptional regulation at the CGI boundaries. To address this question, we performed an integrated analysis of global run-on sequencing (GRO-seq) (Hah et al. 2011), methylated DNA immunoprecipitation sequencing (MeDIP-seq) (Ruike et al. 2010), Pol II ChIP-seq (Lee et al. 2012), and ChIP-seq of histone modifications from human MCF7 cells at TSSs falling within a CGI or not. As expected, CGI-associated promoters exhibit high levels of divergent transcription and the absence of DNA methylation that distinguishes these from non-CGI promoters (Supplemental Fig. S1). Relative to non-CGI promoters, CGI promoters have significantly more engaged Pol II and are enriched in histone modifications associated with ongoing transcription, including H3K4me3 and acetylated H3 (Supplemental Fig. S1C,D). Histone modifications and transcriptional activity are distributed on both sides of the TSS, indicating that these marks are associated with both sense and divergent transcription at CGI promoters. This analysis also highlights that the majority of paused genes and ChIP-seq signal from chromatin modifications associated with transcriptional activation derive from CGI promoters.
To examine the relationship between chromatin structure and engaged Pol II specifically at CGIs, promoter-associated CGIs were sorted by CGI size. Transcriptional activity, indicated by GRO-seq tag density, was confined to the unmethylated CGI domain and corresponded with Pol II enrichment in this region (Fig. 1A). Histone modifications known to be associated with active transcription, such as H3K4me3 and H3K9ac, were similarly concentrated within the unmethylated CGI domain (Supplemental Fig. S2). Interestingly, there was significant GRO-seq enrichment at the edges of the CGI domain. Sense strand transcripts are enriched at the downstream edge of CGIs, and antisense strand transcripts are enriched at the upstream edge, suggesting that Pol II may pause in these regions. These data confirm that divergent transcription is a common feature of most if not all active CGI-associated promoters (Core et al. 2008) and underscores the relationship between divergent transcription and surrounding chromatin at CGIs; i.e., divergent transcription appears largely confined to the CGI domain.
Figure 1.
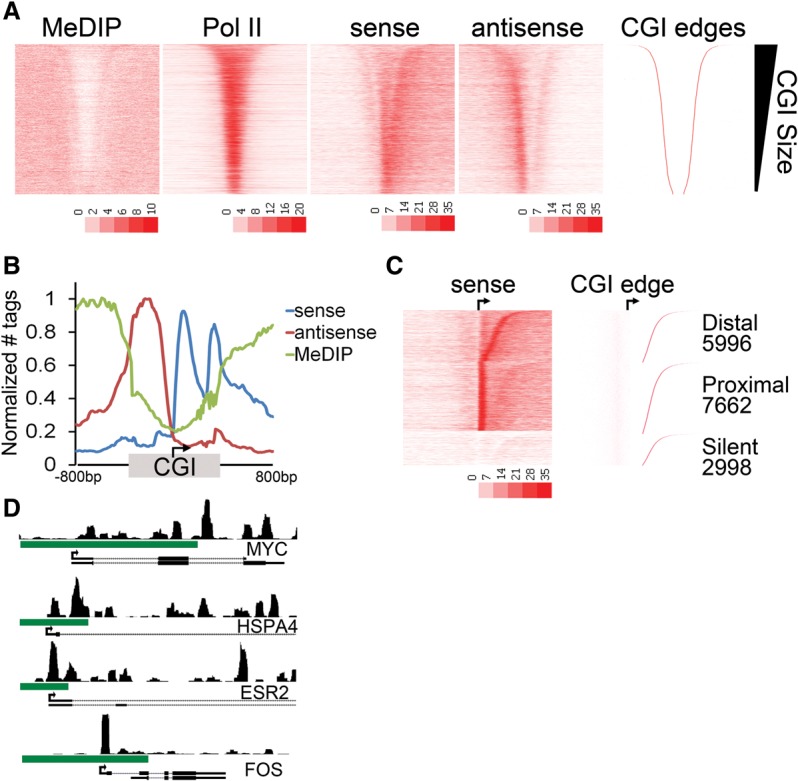
A second (distal) Pol II pause at the CGI shore. (A) Heatmap representation of MeDIP-seq, total Pol II ChIP-seq, and GRO-seq sense (plus strand) and antisense (minus strand) tag density is plotted for ±3 kb around the midpoint of the CGI and sorted by CGI size (CGI-associated promoters; n = 16,657). The upstream and downstream boundaries of the CGI domain (right) is shown for comparison. (B) Average tag densities of nascent transcripts (GRO-seq; sense, antisense) and DNA methylation (MeDIP-seq) across CGI-associated promoters. Promoters were oriented to the direction of transcription, and the distances from the TSS to the upstream and downstream CGI edge were independently scaled and anchored to the TSS (arrow). An additional 800 bp to either side of the CGI (unscaled) is included. Data are normalized between data sets by setting the maximum tags per 20 bp bin within each data set to one. (C) The relative GRO-seq tag density for the 100 bp under the proximal peak versus the 100 bp at the CGI edge was used to parse genes into proximal or distal pausing classes. Promoters with no tags in either region were considered silent. CGIs in each class were sorted by the distance from the TSS to the downstream CGI edge (indicated to the right). (D) Browser image of MCF7 GRO-seq sense tags covering an 8-kb window surrounding the promoter regions of MYC, HSPA4, ESR2, and FOS. Green bar indicates CGI.
We next sought to determine the relationship among divergent transcription, promoter-proximal pausing, and DNA methylation at CGI promoters, while taking into consideration the relative position of the TSS within the CGI domain. Genes were oriented to the direction of transcription and normalized to the CGI length such that the distance to the upstream and downstream CGI edges were independently scaled relative to the TSS. Meta-analysis across 16,657 CGI-associated promoters revealed an enrichment of GRO-seq sense strand tags at ∼50 bp downstream from the TSS, representing the well-characterized promoter-proximal pause (Fig. 1B). Interestingly, we observed a second distinct accumulation of nascent transcripts (sense strand) at the downstream edge of the CGI domain (Fig. 1B, second blue peak). Notably, divergent transcription was similarly enriched in the region upstream of the TSS to the 5′ CGI edge. Taken together, these data indicate that Pol II encounters a barrier to transcription past the downstream edge of the CGI domain that is distinct from the promoter proximal-pause and, further, that this position represents a major regulatory step for continued elongation at a significant number of genes. We refer to this as the “distal” pause.
The above observations led us to inquire whether both pausing events were characteristic of most genes, i.e., whether most genes are regulated by two sequential pauses or whether the average profile might represent distinct groups of genes with different pausing characteristics. We therefore parsed genes by the relative ratio of the proximal versus distal pausing indices, defined as the GRO-seq tag density of the 100 bp encompassing the proximal or distal peak relative to that of the gene body downstream from the CGI. This analysis indicated that CGI-associated genes can be grouped into two classes, those predominantly regulated at the proximal site or those regulated at the distal site (Fig. 1C). Approximately 35% of CGI-associated genes showed predominant pausing at the distal position (Class I, distally paused), whereas 47% showed a more prominent proximal pause (Class II, proximally paused). A third class (18%) lacked significant GRO-seq tags, indicating that they are silent in this cell type. Limiting the analysis to only those CGIs that contain a single annotated TSS had no impact on this pattern, and the same relationships were observed (Supplemental Fig. S2B). For many genes, there is a dominance of one pause point over the other, although both pauses are still observed (e.g., HSPA4 and ESR2), while other genes like MYC and FOS show a clear preference for either the distal or proximal pause, respectively (Fig. 1D). Thus, it would appear that Pol II encounters a proximal and a distal pause at most CGI genes, but the degree to which each is rate-limiting varies, with one or the other dominating.
Because the distal pause coincides with the edge of the CGI, we reasoned that DNA methylation and/or histone modifications might be candidates for regulating pausing at this position. However, analysis of histone modifications correlated with promoters and/or transcription (H3K4me3, H3K9ac, H3K14ac), or shown in Supplemental Figure S2 to be associated with the CGI edge (H3K4me2, H3K9me1, DNA methylation), showed no difference in enrichment patterns between the pausing classes (Supplemental Fig. S3A). Several protein factors implicated in the regulation of promoter-proximal pausing, such as CCNT2 and CDK9 (components of the P-TEFb complex), MYC (Rahl et al. 2010), and BRD4 (Delmore et al. 2011), were similarly analyzed. Although there was clear enrichment of these factors at the proximal pause point just downstream from the TSS as expected, this pattern was common across all active CGIs, and there was no difference in profiles between the pausing classes (Supplemental Fig. S3B). Whereas steady-state gene expression, gene size, and fraction of the gene encompassed within the CGI did not significantly differ between CGI classes, distally paused genes tended to be associated with larger CGIs and downstream distances from the TSS to 3′ CGI edge and with a higher CpG density than proximally paused genes, although the differences were relatively modest (median CGI size = 871 bp vs. 944 bp vs. 1018 bp; TSS to 3′ CGI edge = 498 bp vs. 531 bp vs. 570 bp, proximal, distal, silent, respectively) (Supplemental Fig. S4). Interestingly, the silent class shared some features with the distal class (slightly longer CGI and downstream distance) but represented a class of CGIs with lower CpG density (Supplemental Fig. S4). Gene ontology and gene set enrichment analyses indicated that the genes associated with CGIs in the proximal and distal classes share similar housekeeping-type functions, with a tendency for the proximally paused class to be enriched in genes involved in transcription and RNA processing functions, while the distal class tended toward cell division and metabolic processes (Supplemental Data). The most striking observation was in the silent class, which is strongly enriched in developmental regulators and genes subject to Polycomb-mediated repression in stem cells and other tissues (Supplemental Data).
We next asked whether other cell types with different expression patterns have the same pausing patterns. The profile of ongoing transcription (GRO-seq) from normal breast epithelia (MCF10A) (Kim et al. 2013) and fetal lung fibroblast (IMR90) (Core et al. 2008), and ChIP-seq for serine-5 phosphorylated Pol II from CD4+ T-cells (Zhang et al. 2012) was examined at CGI-associated promoters using the same sort order (distance from the TSS to the 3′ CGI edge) and class distinctions derived for MCF7 cells in Figure 1C. Interestingly, the position of the dominant pause for individual genes was consistent across multiple cell types (Fig. 2). Pol II ChIP-seq confirmed enrichment of Pol II at both the proximal and the distal sites, consistent with Pol II pausing in both positions. These data suggest that the predominant pausing class is intrinsically determined and is independent of cell-type–specific expression patterns.
Figure 2.

Predominant Pol II pausing class is conserved across cell types. (A) Heatmap representation of the GRO-seq sense tag density from MCF10A and IMR90 cells. CGI promoters are oriented to transcription and sorted within each class by the distance from the TSS to the downstream CGI edge using the same sort order as Figure 1C. (B) Pol II (S5 phosphorylated) ChIP-seq tag density from CD4+ T cells oriented and sorted as in Figure 1C. (C) Average tag densities of nascent transcripts (GRO-seq sense) and phospho-S5-Pol II for promoters in the three pausing classes shown in A and B. CGI-associated promoters were oriented to transcription and the distance from the TSS to the upstream and downstream CGI edge independently scaled and anchored to the TSS (arrow). The average tags per 20-bp bin for 800 bp to either side of the CGI (unscaled) are included.
Core promoter sequence elements have been implicated in the regulation of promoter-proximal pausing (Kwak et al. 2013). To identify local features that might discriminate CGIs in the two different pausing classes, sequence motif elicitation was performed. The MEME motif finder (Machanick and Bailey 2011) was applied to 100 bp of sequence underlying the proximal and distal pause site for all three classes of genes. This identified G-rich sequences at the corresponding dominant Pol II pausing site for each class (Fig. 3A); that is, proximally paused genes show G-enrichment near the TSS, while distally paused genes show a G-enrichment at the 3′ CGI boundary (Fig. 3A). Genes in the silent class resemble that of the distally paused genes with G-rich sequences at the distal pause site, suggesting that, when active, these genes might exhibit a distally paused pattern similar to Class I genes.
Figure 3.
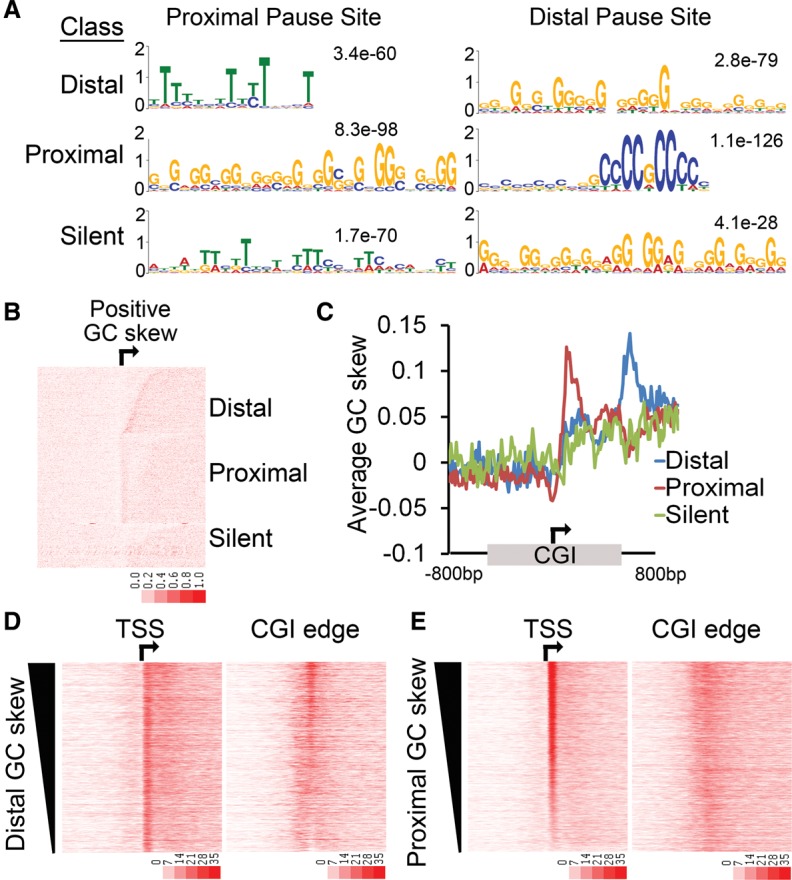
Pol II pausing correlates with GC skew. (A) MEME-ChIP was performed on the 100-bp sequence underlying the proximal pause and the distal pause for the promoters in each pausing class (distal, proximal, silent). An enrichment of G-rich sequences correlates with the predominant Pol II pause point for each class. (B) Heatmap representation of GC skew. The degree of GC skew was calculated in 20-bp bins. CGI promoters from the three classes are oriented and sorted by the distance from the TSS to the downstream CGI edge using the same sort order as Figure 1C. (C) Average GC skew across the three different pausing classes. CGI-associated promoters were oriented, and the distances from the TSS to the upstream and downstream CGI edge were independently scaled and anchored to the TSS (arrow). An additional 800 bases to either side of the CGI (unscaled) is included. (D,E) MCF7 cell GRO-seq sense tag density around the TSS (arrow) or the downstream edge of the CGI (±3 kb). All CGI promoters were sorted by decreasing GC skew for the 100 bases underlying the distal pause (D) or the proximal pause (E).
The finding of G-rich coding strand sequences that correspond with the location of the dominant pause evoked an examination of GC “skew.” GC skew is a common feature of CGI promoters and is characterized by an excess of G versus C content on the coding strand (Ginno et al. 2012). Transcription through such regions results in the formation of R-loops generated by the stable pairing between the G-rich nascent RNA back to the C-rich template behind the progressing polymerase (Aguilera and Garcia-Muse 2012). This leaves the G-rich nontemplate DNA strand unpaired, which also has the potential to form G-quadruplexes (Lam et al. 2013; Shrestha et al. 2014). These secondary structures have been shown to promote DNA damage and/or translocations while also impeding transcription at certain genes (Aguilera and Garcia-Muse 2012). To investigate the possibility that GC skew influences Pol II pausing, GC skew was calculated for the region from the TSS to the downstream CGI edge and sorted by CGI size and predominant pausing site, again using the same sort order and class distinction as in Figure 1C. This demonstrated that GC skew does indeed correlate very closely with the dominant Pol II pausing site (Fig. 3B). The compiled analysis of GC skew at all CGI-associated genes oriented to the TSS and scaled to the CGI showed that whereas there is generally positive skew downstream from the TSS as previously described (Ginno et al. 2013), the proximally paused genes have a sharp peak in GC skew located just downstream from the TSS and the distally paused genes have a sharp peak of GC skew at the CGI edge (Fig. 3C). Moreover, sorting of all active CGI-associated genes by the degree of GC skew at either the proximal or the distal site correlated with the degree of Pol II pausing at the same site, as indicated by the GRO-seq signal (Fig. 3D,E), and the interpolated pausing index (Supplemental Fig. S5A) but was independent of gene expression levels (Supplemental Fig. S5B,C). Taken together, these data indicate that Pol II pausing correlates more strongly with local GC skew than any of the chromatin modifications or trans-acting factors investigated.
Previous work by the Chedin group has shown a strong correlation between global GC skew, R-loop formation, and the lack of DNA methylation across CGI domains (Ginno et al. 2012, 2013). By use of a sequence-based algorithm, SkewR, that takes into account the degree, length, and direction of GC skew, as well as sequence composition (C + G content, CpG density), the group has classified CGIs into three classes (strong, weak, and reverse) based on a predicted propensity for R-loop formation. To determine the relationship between pausing classes and SkewR predicted propensity for R-loop formation, CGIs in the distal, proximal, and silent pausing classes were annotated to the GC skew “class.” As expected, most of the CGIs considered in this study were associated with “strong” skew features (Supplemental Fig. S6A,B). Relative to the proximal class, the distally paused class was somewhat enriched in CGIs with “strong” GC skew features, including slightly longer regions of positive GC skew, as determined by SkewR peak length (median = 765 bp vs. 822 bp, proximal vs. distal), and slightly longer first exons, a feature previously correlated with the “strong” skew class (median = 208 bp vs. 237 bp, proximal vs. distal) (Supplemental Fig. S6C,D; Ginno et al. 2013). CGIs in the silent pausing class were depleted of “strong” CGIs and enriched in “weak” and “reverse” CGIs. Consistent with this, the “reverse” skew class was also noted to be enriched in features of Polycomb-mediated repression (Ginno et al. 2013). Thus, although there was some overlap between pausing class and skew classes, global GC skew features alone did not appear to be the primary determinant of pausing class.
Next, we determined the relationship between R-loop formation and pausing class among CGI-associated promoters by examining DRIP (DNA:RNA IP)-seq data, an antibody-based approach that selectively captures RNA-DNA hybrids that has been adapted to massively parallel sequencing (Ginno et al. 2012). There was little DRIP-seq enrichment among CGIs in the silent class, consistent with a relative lack of transcriptional activity (Supplemental Fig. S6D). In contrast, both proximally and distally paused genes showed enrichment of R-loops over the CGI domain. Significantly, there was a greater enrichment of R-loops detected downstream from the TSS among the distally paused gene class that peaked at or near the 3′ edge of the CGI domain (Supplemental Fig. S6D). These data indicate that there is a correlation between the stability and/or propensity to form R-loops and the propensity to undergo pausing at the distal pause site.
Several recent studies suggest that enhancers may function to regulate transcription in part by modulating Pol II pausing (Krumm et al. 1995; Brown et al. 1996; Core and Lis 2009; Zippo et al. 2009; Anand et al. 2013; Liu et al. 2013; Loven et al. 2013). We used chromatin conformation capture (3C) to probe the relationship between enhancer–promoter looping interactions and pausing class in MCF7 cells transiently exposed to estradiol (E2). Upon estrogen stimulation, well-characterized distal enhancers for the MYC, P2RY2, and SIAH2 genes are bound by the estrogen receptor alpha, resulting in the looping between the enhancer and promoter and rapid induction of gene expression (Fullwood et al. 2009; Wang et al. 2011; Li et al. 2013). The MYC, P2RY2, and SIAH2 genes were chosen for this assay because they are rapidly induced in response to estrogen exposure, ensuring a direct transcriptional effect, and because their promoter-associated CGIs are sufficiently large that the TSS and 3′ CGI edge can be readily resolved, allowing us to determine the spatial relationship between enhancer contacts and the paused Pol II (Hah et al. 2011, 2013; Danko et al. 2013). A high-resolution 3C assay was used to finely map estrogen-induced enhancer interactions at these loci in MCF7 cells. At the two distally paused genes, MYC and SIAH2, a 10-min estrogen exposure induced a five- to 10-fold increase in the efficiency of contact between the upstream enhancer and their respective promoters. Interestingly, the interaction efficiency was two- to threefold greater at the distal edge of the CGI than surrounding regions, including the TSS (Fig. 4A,B). In contrast, at the proximally paused gene P2RY2, estrogen stimulated the interaction between the upstream enhancer and the TSS proximal region (Fig. 4C). To assess the functional consequences of enhancer looping in this setting, we interrogated GRO-seq data obtained from estradiol-stimulated MCF7 cells (Hah et al. 2011) to determine the influence of E2 stimulation on pausing indexes over time at the MYC, SIAH2, and P2RY2 genes and calculated as described above (Fig. 3). This analysis showed an approximately twofold decrease (2.2-, 1.5-, 2.0-fold, respectively) in pausing index at the corresponding distal (MYC, SIAH2) or proximal (P2RY2) pause point within ∼40 min and leveling off thereafter (data not shown).
Figure 4.
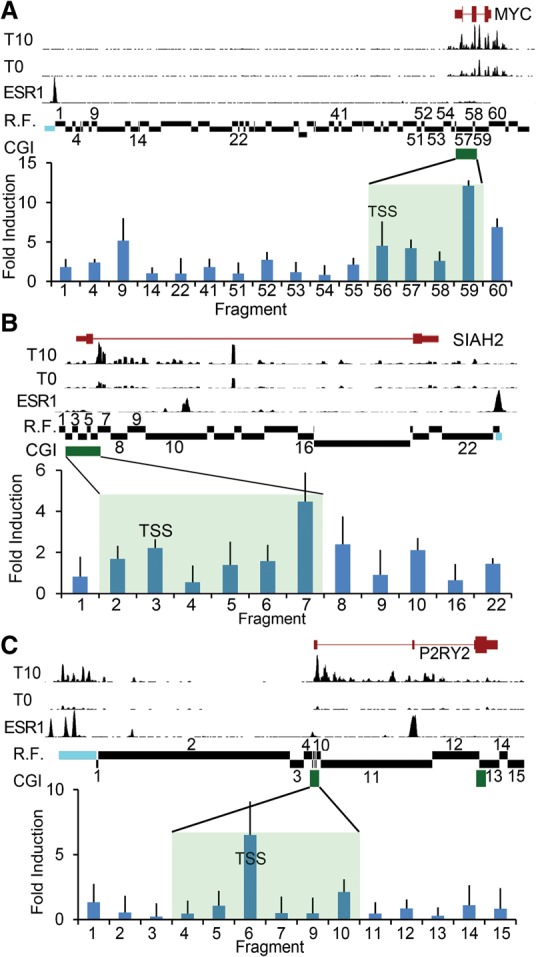
Distal enhancer interactions correlate with pausing class. A chromatin conformation capture (3C) assay was performed to investigate the interaction between known estrogen-bound enhancer elements upstream of the following: (A) MYC (shown is Chr 8: 128,679,000–128,763,000), (B) SIAH2 (Chr 3: 150,455,000–150,483,000), and (C) P2RY2 (Chr 11: 72,903,000–72,950,000) loci. The relative positions of the CGI (green bar, shaded region) and the fragment containing the TSS are indicated. Estrogen-depleted MCF7 cells were induced with 100 nM estradiol (E2) or vehicle (ethanol) for 10 min followed by crosslinking, restriction digestion, and ligation. An anchor probe was designed against the known estrogen receptor-bound enhancer (blue) and tested for ligation with the indicated restriction fragments (R.F.) by qPCR. Data are reported as mean ± SD of the fold-induction of E2-induced interaction relative to uninduced from three independent experiments assayed in triplicate. Shown for comparison are GRO-seq sense strand data from MCF7 cells depleted of estrogen for 3 d (T0) and induced with 100 nM estradiol for 10 min (T10) (Hah et al. 2011). For GRO-seq tracks, y-axis scale (total tag count every 10 bases): MYC = 1300, SIAH2 = 250, P2RY2 = 225. Shown for comparison are estrogen receptor alpha (ESR1) ChIP-seq data derived from GSM594602. For the ESR1 ChIP-seq track, y-axis scale (total tag count every 10 bp): MYC = 150, SIAH2 = 154, P2RY2 = 324. Data demonstrate estrogen-induced ESR1 binding at the enhancer and transcriptional activity at both the promoter and enhancer.
The above data suggest that enhancer interactions may play a role in the regulation and/or stability of the Pol II pause not only at the proximal site but also at the distal pause site as well. To examine the broader relationship between pausing class and enhancer–promoter interactions, we made use of the highest resolution (1 kb) Hi-C data available to date (Rao et al. 2014) to examine the frequency of contacts between the proximal and distal pause sites of each CGI-associated promoter and its nearest enhancer. We defined enhancers as regions of overlap between H3K4me1/H3K27ac based on ChIP-seq data from the same cell type from which the Hi-C data were derived (GM12878) (The ENCODE Project Consortium 2012). Given the resolution of the data, we limited the analysis to those CGIs for which the TSS and the 3′ CGI edge are >1 kb apart (proximal N = 663, distal N = 475, silent N = 558), and among these, those that had one or more annotated contacts between the enhancer and each pause point. This resulted in a total of 1225 CGI promoter-enhancer pairs considered (proximal = 527, distal = 390, silent = 308). There was no significant difference in the distance from the promoter to the nearest enhancer between the proximal and distal pausing classes (Supplemental Fig. S7). CGI promoters in the silent class were further from their nearest enhancer, which was not surprising considering the focus on “active” H3K4me1/H3K27ac marked enhancers and the tendency for the silent class to be overrepresented in Polycomb-marked genes, the bulk of which are likely silent in most differentiated tissues, including the GM12878 cells. We found that while the nearest enhancers associated with CGI promoters in the proximal and silent classes were equally likely to contact the TSS as the 3′ CGI edge, enhancers associated with CGIs in the distal class showed a 1.3-fold greater propensity for contact at the distal pause site (P = 0.027, distal vs. proximal class genes, Mann–Whitney U test) (Supplemental Fig. S7B).
Several studies have implicated cohesin in long-range chromosomal contacts and enhancer–promoter looping (Kagey et al. 2010b). We therefore examined enrichment of the cohesin subunit RAD21 (MCF7 cells) (The ENCODE Project Consortium 2012) in and around the TSS and 3′ CGI edge of promoters in the three pausing classes. We found that while cohesin is enriched throughout the CGI in both active classes (proximal and distal) relative to the silent class, there was a skew toward more distal enrichment (decreased at the TSS increased at the 3′ CGI edge) in the distally paused genes relative to the proximally paused genes (Supplemental Fig. S7C).
Taken together, these data indicate that stable contacts are made between distal enhancers and multiple points along the CGI domain among active CGI-associated genes, with a tendency for distally paused genes to exhibit a skewed distribution toward the 3′ end of the CGI domain relative to proximally paused genes. Upon transcriptional activation, contacts at the dominant pause site appear to be selectively induced and/or stabilized, at least at the E2-regulated genes examined, suggesting a new role for enhancer–promoter contacts in Pol II pausing not only at the proximal pause but also the distal pause point.
Discussion
This study provides evidence that at CGI-associated promoters Pol II encounters not one, but two major barriers to transcriptional elongation, one defined by the promoter proximal pause and a second that corresponds to the downstream boundary of the CGI domain. The relative degree to which each becomes rate-limiting is intrinsically determined by local sequence context. Both pausing events correlate with regions of high GC skew, a feature of sequences prone to the formation of secondary structures such as R-loops and G-quadruplexes (Aguilera and Garcia-Muse 2012; Ginno et al. 2012; Shrestha et al. 2014). Positive GC skew downstream from the TSS is a sequence feature of most CGIs, and R-loops extending through this region have been detected at many CGI promoters, where they are proposed to prevent DNA methylation (Ginno et al. 2012, 2013). We find that even within the overall positive GC skew typical of most CGIs, there are G-rich clusters that exhibit an even greater (two- to threefold) G-bias than the surrounding DNA, and that these correlate well, both in location and in magnitude, with the intensity of Pol II pausing. The hyperstability of the RNA:DNA duplexes formed at these sites in particular may tether the nascent transcript, impeding elongation beyond a certain distance or once a threshold level of negative supercoiling behind the progressing polymerase has been reached. Indeed, R-loop structures impede polymerase progression in a length- and supercoiling-dependent manner in vitro (Belotserkovskii et al. 2010), and promoter-proximal pausing has been correlated with local thermodynamic stability of the RNA:DNA duplex in Drosophila (Nechaev et al. 2010). Consistent with a tethering model, Pol II paused in close proximity to the G-rich sequences, not only at the promoter-proximal pause but also at the distal pause, regardless of the distance from the TSS to the downstream CGI edge and, hence, the overall length of the nascent transcript. Thus, even in the context of a nascent transcript well >1 kb, G-rich stretches still have the capacity to hinder Pol II progression. A similar mechanism may be operative at the 3′ ends of genes where Pol II pausing and R-loop formation over G-rich sequences downstream from the poly(A) signal are necessary for efficient transcription termination (Skourti-Stathaki et al. 2011, 2014).
Similar G-rich clusters interspersed throughout the immunoglobulin class switch locus are proposed to serve as points of R-loop initiation, with the R-loop spreading laterally from the point of the most stable (highest G-bias) contact (Zhang et al. 2014). Consistent with this idea, the distally paused genes were enriched in RNA:DNA hybrids that peaked near the 3′ CGI edge relative to proximally paused genes. It is possible that the additional stability afforded by the intertwining of a longer nascent transcript “tail” with the template DNA (e.g., long R-loop) at distally paused genes might obviate the need for additional protein factors to enforce the paused state. Indeed, whereas the protein complexes known to enforce (NELF, DSIF) or to relieve (BRD4 and P-TEFb) promoter-proximal pausing are enriched at the proximal site across active CGIs of both classes (Supplemental Fig. S3B), there was little enrichment of these factors at the distal pausing site in either class, suggesting that the mechanisms involved in proximal and distal pausing and release may differ. A paused state reinforced by additional trans-acting factors versus one driven by sequence and physical constraints alone might explain the difference in apparent intensities between the proximal versus the distal pause (Supplemental Fig. S8). Interestingly, classes of genes exhibiting a more proximal versus distal pause have also recently been reported in Drosophila, which lack CGIs (Kwak et al. 2013). The strong correlation between the position of pausing and GC skew is also readily evident in the Drosophila data (Supplemental Fig. S9), suggesting that the relationship between this sequence-based feature and Pol II pausing is evolutionarily conserved, and may predate the emergence of CGIs.
We demonstrate that enhancers contact the predominant pausing site in CGIs, suggesting a role for enhancers in regulating Pol II pausing not only at the proximal pause but also at the CGI edge. The role of active enhancers in mediating promoter-proximal pause release is incompletely understood but has been attributed to the delivery of the P-TEFb complex to the promoter, enhancer-mediated liberation of P-TEFb complex from local HEXIM1-mediated sequestration, and, most recently, a mechanism involving competition for promoter-bound NELF complex by enhancer-derived eRNAs (Anand et al. 2013; Liu et al. 2013; Loven et al. 2013; Schaukowitch et al. 2014). It is tempting to speculate that at distally paused genes, the enhancer might bring in factors capable of resolving R-loops or other physical constraints (e.g., supercoiling). To this end, inhibition or down-regulation of type I topoisomerases leads to an accumulation of R-loops at the MYC locus (Yang et al. 2014) or ribosomal RNA genes (El Hage et al. 2010; Marinello et al. 2013). How enhancers might be selectively directed to the promoter versus the CGI edge is unclear, but recent evidence showing that a substantial fraction of long-range looping interactions is stable across cell types and developmental windows and precedes signal-induced gene activation (Jin et al. 2013; Li et al. 2013; Ghavi-Helm et al. 2014) suggests that at least one component of enhancer activity (looping) may be linked to underlying sequence features.
Our findings highlight the importance of considering the CGI and its embedded TSS as a discrete chromatin domain whose structure has implications not only for transcriptional initiation but also for elongation. While it is well accepted that the maintenance of an open chromatin conformation at the CGI facilitates promoter access and Pol II loading (Deaton and Bird 2011), our data suggest that the CGI boundaries act, to varying degrees, as a natural barrier to transcriptional elongation in both the sense (productive) and antisense (divergent) directions (see Fig. 1; Supplemental Fig. S2B). Previous work by the Chedin group has shown that GC skew is a common feature of the CGI and that transcription through these regions, rather than transcription per se, is important for protecting CGIs from DNA methylation in transfected plasmids, implying a role for R-loop formation in this process (Ginno et al. 2012, 2013). We have previously shown that Pol II, even in the paused state, can protect CGIs from de novo methylation after drug-induced demethylation (Kagey et al. 2010a). The evolutionary preservation of CpG density in CGIs has been attributed to the absence of DNA methylation in the germline and, hence, a reduced rate of spontaneous meC-to-T transition mutations in these regions relative to the rest of the genome. The coevolution of G-C strand asymmetry in the CGI domain implies a transcriptionally dependent event that drives the preferential loss of non-CpG Cs on the coding strand (or Gs on the template strand). The preservation of highest GC skew in CGIs relative to the genome-wide average (Ginno et al. 2013) and in particular at the positions where RNA Pol II is paused (this study) suggests a role for Pol II residency time in promoting this event. Together these data add to a growing body of evidence supporting the idea that divergent transcription, GC skew/ R-loop formation, and Pol II pausing are inextricably linked and conspire to maintain the unique epigenetic environment of CGI domains.
Methods
Data sets used in this study
The following data sets were used in this study: for MCF7 cells, ChIP-seq of Pol II (GSM365929) (Welboren et al. 2009), phospho-S5 Pol II (GSM588577) (Joseph et al. 2010), H3K4me3 (GSM945269), H3K4me2 (GSM822391) (He et al. 2012), H3K9ac (GSM588573) (Joseph et al. 2010), H3K9me1 (GSM945857), H3K14ac (GSM588575) (Joseph et al. 2010), H3K27ac (GSM946850) (Frietze et al. 2012), MYC (GSM1006877), and RAD21 (GSM101079); MeDIP-seq (DRX000030) (Ruike et al. 2010); and GRO-seq (GSM1014637) (Hah et al. 2011). For IMR90 cells, the following data set was used: GRO-seq (GSM340901) (Core et al. 2008). For MCF10A cells, the following data set was used: GRO-seq (ERX016683) (Kim et al. 2013). For CD4+ T cells, the following data sets were used: ChIP-seq of Pol IIS5 (GSM1022949) (Zhang et al. 2012) and BRD4 (GSM823378) (Zhang et al. 2012). For HeLa cells, the following data sets were used: ChIP-seq of NELFA (GSM1280296) (Liu et al. 2014) and the SUPT5H component of DSIF (GSM1280295) (Liu et al. 2014). For K562 cells, the following data set was used: ChIP-seq of CCNT2 (GSM935547). For GM12878 cells, the following data sets were used: H3K4me1 and H3K27ac ChIP-seq peak files (GSM733771, GSM733772) and Hi-C contact matrices at 1-kb resolution (GSE63525) (Rao et al. 2014). For Ntera cells, the following data set was used: DRIP-seq (SRX113813) (Ginno et al. 2012). For Drosophila, the following data set was used: PRO-seq (GSE42117) (Kwak et al. 2013).
Heatmaps, CGI scaling, and genome-wide averages
CGIs were defined by the UCSC criteria (hg19; April 27, 2009; http://hgdownload.soe.ucsc.edu/goldenPath/hg19/database/cpgIslandExt.txt.gz). Heatmap representations of ChIP-seq, MeDIP-seq, and GRO-seq tag densities were generated by summing the total number of tags in 20-bp bins for 3 kb to either side of the TSS or from the midpoint of the CGI domain and visualized with Java Treeview v.1.1.6. To compare CGI features, CGI-associated TSS were oriented to the direction of transcription, and the distances from the TSS to the 5′ and 3′ edge of the CGI were independently scaled. It should be noted that as a run-on technique, GRO-seq tags will map ∼100 bases downstream from the Pol II position. As a consequence, the summit of GRO-seq enrichment at the proximal pause maps to approximately +140 to +240 relative to the TSS and is offset from the peak of Pol II ChIP enrichment (approximately +40 to +140 from the TSS) by ∼100 bp. Likewise, the GRO-seq enrichment at the CGI boundary is approximately +40 to +140 of the 3′ edge of the CGI on average. To account for this offset, 200 bp was added to the length of the CGI for GRO-seq scaling purposes in order to fully account for the second peak. The length of each half of the CGI was divided into 40 bins, and the average number of tags from each bin was compiled for all promoter-associated CGIs for the indicated class using in-house scripts (Supplemental Files). Information for a constant (unscaled) 800 bp was included on each side of the CGI for comparison.
Proximal and distal pausing indices
The pausing index was defined as the total number of GRO-seq tags for the 100 bases spanning the proximal pause (+140 to +240 relative to TSS) or the distal pause (+20 to+120 relative to 3′ CGI edge) divided by the average number of reads per 100 bases across the gene body, which was defined as the region from +200 bases downstream from the 3′ CGI edge to the transcription end site (TES). TSS-associated CGIs were parsed into the dominant pausing class by comparing the ratio of the proximal to distal pausing index. Those CGIs with a value less than one were placed in the distal class, while those with a value greater than one were placed in the proximal class. CGIs with no tags at either pause were placed in the silent class.
GC skew and gene expression
GC skew (G − C/G + C) was calculated in 20-bp bins across the human hg19 genome and the skew ±3 kb upstream and downstream to generate heatmaps sorted by CGI size of the three classes. For sorting of GC skew, all CGI promoters were sorted by decreasing GC skew for the 100 bases of enrichment (the 100 bases immediately upstream of CGI edge for the distal sort, and +40 to +140 from TSS for the proximal sort). For scaling GC skew, a 20-bp sliding window moving in 1-bp increments was calculated and scaled into a fixed number of bins (n = 50) independently from the TSS to the upstream and downstream CGI edges. The average of each bin across all genes was plotted for each class. Gene expression was determined from GRO-seq “sense” tag density as RPKM for the gene body region defined as +200 bp downstream from the 3′ edge of the CGI to the TES. GC skew (G − C/G + C) was calculated across the Drosophila genome (dm5.22) as described above, and the average skew for each bin centered on the TSS ± 250 bp was plotted for all genes in each pausing class (proximal, distal) as defined by Kwak et al. (2013).
Chromatin conformation capture
Experiments were carried out according to the method of Hagege et al. (2007) with slight modification. Briefly, 15-cm plates containing 1 × 10⁶ MCF7 cells were grown in phenol-red free media supplemented with 10% charcoal stripped serum for 4 d to deplete estrogen. Cells were treated with 100 nM estradiol or vehicle (ethanol) for 10 min at 37°C followed by crosslinking in 1% formaldehyde in the media for 10 min. Glycine was added to a final concentration of 0.125 M for 10 min at room temperature to stop the reaction. Cells were washed twice with PBS and scraped into cold lysis buffer (10 mM Tris at pH 8.0, 10 mM NaCl, 0.2% NP-40), transferred to a conical tube, and placed on ice for 15 min with occasional mixing. Nuclei were pelleted at 400g for 5 min and washed once in 1× restriction buffer. Restriction digests were carried out in 1× NEB restriction buffer 3.1 or CutSmart, 1% Triton X-100, and 400 units each restriction enzyme per sample and incubated overnight at 37°C with rocking. Enzymes were inactivated with 1.25% SDS for 25 min at 65°C. Samples were then ligated in 1× NEB ligation buffer, 1% Triton X-100, 200 μg BSA, 3000 units of ligase (NEB M0202) in a total of 7.5 mL for 4 h at 16°C. DNA was isolated by proteinase K (500 mg) digestion overnight at 65°C, followed by phenol:chloroform extraction and ethanol precipitation. Ligation efficiency between the distal enhancer and various restriction fragments was interrogated by quantitative real-time PCR using Taqman probes. A constant forward primer and Taqman probe anchored at the distal enhancer fragment were coupled with forward primers designed against selected restriction fragments across the region and every restriction fragment within the CGI. The data are represented as the average fold change in estradiol-induced samples relative to vehicle-only controls from three independent biological experiments assayed in triplicate. Primers used for 3C analysis are listed in Supplemental Table I.
Restriction enzymes used for the analysis of the MYC and SIAH2 loci were PstI (NEB no. R0140) and NsiI (NEB no. R0127); P2RY2 was XmaI (NEB no. R0180) and BsaWI (NEB no. R0567). The P2RY2 digest was modified slightly by sequential digestion first with BsaWI for 30 min at 60°C followed by the addition of XmaI and a second 400 units of BsaWI and incubation overnight at 37°C. This led to complete digestion of test BsaWI fragments (data not shown).
Hi-C enhancer contact analyses
ChIP-seq data from GM12878 cells (GSM733771, GSM733772) were used to define active enhancers as regions of overlap between H3K4me1 and H3K27ac peak files (The ENCODE Project Consortium 2012). This identified 52,422 genomic regions with a median width of 827 bp. Each CGI promoter was then annotated to the nearest putative enhancer region to its TSS. Given the resolution of the data, the analysis was limited to only those genes where the TSS and 3′ CGI edge are at least 1 kb apart (proximal N = 663, distal N = 475, silent N = 558) and, among those, those that had one or more contacts between each pause site and the nearest enhancer (proximal N = 527, distal N = 390, silent N = 308). Hi-C contact matrices from GM12878 cells at 1-kb resolution (MAPQ score >30) were obtained from Rao et al. (2014; GSE63525) and were used to determine the frequency of contacts between each pausing site and the nearest enhancer. Contacts between the proximal (TSS + 200 bp) and distal (3′ CGI edge ± 100 bp) and the nearest enhancer were counted, and the log2 of the ratio of distal pause site contacts to proximal pause site contacts was calculated.
R-loop, SkewR class analysis
SkewR peaks and TSS class assignments are available from https://www.mcb.ucdavis.edu/faculty-labs/chedin/Resources.html (Ginno et al. 2012, 2013). For SkewR peak length analysis, TSSs from genes in each pausing class were intersected with SkewR peaks (low stringency). Approximately 80% of the TSS in each class were found within a SkewR peak (proximal N = 4348, distal N = 2730, silent N = 2641). To annotate CGIs to a skew “class,” CGIs were matched to the nearest TSS within 1 kb for which a SkewR class assignment was available (proximal N = 5601, distal N = 3490, silent N = 2461) (Ginno et al. 2013).
DRIP-seq data tag densities were calculated from SRX113813 (Ginno et al. 2013). For scaling purposes, CGI-associated TSSs were oriented to the direction of transcription, and the distances from the TSS to the 5′ and 3′ edge of the CGI were independently scaled into 40 bins each. An additional fixed (unscaled) distance of 800 bp (40 × 20 bp bins) was included to each side for comparison. After removing duplicate reads, the average tag densities across all genes in each pausing class was calculated using custom scripts (Supplemental Files).
Motif elicitation
MEME-ChIP (Machanick and Bailey 2011) (http://meme-suite.org/tools/meme-chip) was performed on the 100-bp sequence underlying the proximal pause and the distal pause for the promoters in each pausing class (distal, proximal, silent) with the following options: background sequence model, first order, scan given strand only. All other MEME options were set to the default values.
Supplementary Material
Acknowledgments
We thank the authors who have publicly submitted the data sets used in this study, Dr. Paul Wade for thoughtful critique of the manuscript, and Benjamin Barwick for helpful advice. This work was supported by National Institutes of Health (NIH) grants 5R01 CA077337 and 5R01 CA132065 (to P.M.V.), and 5F31 CA186676 (to J.S.K.B.).
Footnotes
[Supplemental material is available for this article.]
Article published online before print. Article, supplemental material, and publication date are at http://www.genome.org/cgi/doi/10.1101/gr.189068.114.
References
- Adelman K, Lis JT. 2012. Promoter-proximal pausing of RNA polymerase II: emerging roles in metazoans. Nat Rev Genet 13: 720–731. [DOI] [PMC free article] [PubMed] [Google Scholar]
- Aguilera A, Garcia-Muse T. 2012. R loops: from transcription byproducts to threats to genome stability. Mol Cell 46: 115–124. [DOI] [PubMed] [Google Scholar]
- Anand P, Brown JD, Lin CY, Qi J, Zhang R, Artero PC, Alaiti MA, Bullard J, Alazem K, Margulies KB, et al. 2013. BET bromodomains mediate transcriptional pause release in heart failure. Cell 154: 569–582. [DOI] [PMC free article] [PubMed] [Google Scholar]
- Belotserkovskii BP, Liu R, Tornaletti S, Krasilnikova MM, Mirkin SM, Hanawalt PC. 2010. Mechanisms and implications of transcription blockage by guanine-rich DNA sequences. Proc Natl Acad Sci 107: 12816–12821. [DOI] [PMC free article] [PubMed] [Google Scholar]
- Bock C, Paulsen M, Tierling S, Mikeska T, Lengauer T, Walter J. 2006. CpG island methylation in human lymphocytes is highly correlated with DNA sequence, repeats, and predicted DNA structure. PLoS Genet 2: e26. [DOI] [PMC free article] [PubMed] [Google Scholar]
- Brown SA, Imbalzano AN, Kingston RE. 1996. Activator-dependent regulation of transcriptional pausing on nucleosomal templates. Genes Dev 10: 1479–1490. [DOI] [PubMed] [Google Scholar]
- Core LJ, Lis JT. 2009. Paused Pol II captures enhancer activity and acts as a potent insulator. Genes Dev 23: 1606–1612. [DOI] [PMC free article] [PubMed] [Google Scholar]
- Core LJ, Waterfall JJ, Lis JT. 2008. Nascent RNA sequencing reveals widespread pausing and divergent initiation at human promoters. Science 322: 1845–1848. [DOI] [PMC free article] [PubMed] [Google Scholar]
- Danko CG, Hah N, Luo X, Martins AL, Core L, Lis JT, Siepel A, Kraus WL. 2013. Signaling pathways differentially affect RNA polymerase II initiation, pausing, and elongation rate in cells. Mol Cell 50: 212–222. [DOI] [PMC free article] [PubMed] [Google Scholar]
- Deaton AM, Bird A. 2011. CpG islands and the regulation of transcription. Genes Dev 25: 1010–1022. [DOI] [PMC free article] [PubMed] [Google Scholar]
- Delmore JE, Issa GC, Lemieux ME, Rahl PB, Shi J, Jacobs HM, Kastritis E, Gilpatrick T, Paranal RM, Qi J, et al. 2011. BET bromodomain inhibition as a therapeutic strategy to target c-Myc. Cell 146: 904–917. [DOI] [PMC free article] [PubMed] [Google Scholar]
- El Hage A, French SL, Beyer AL, Tollervey D. 2010. Loss of Topoisomerase I leads to R-loop-mediated transcriptional blocks during ribosomal RNA synthesis. Genes Dev 24: 1546–1558. [DOI] [PMC free article] [PubMed] [Google Scholar]
- The ENCODE Project Consortium. 2012. An integrated encyclopedia of DNA elements in the human genome. Nature 489: 57–74. [DOI] [PMC free article] [PubMed] [Google Scholar]
- Feltus FA, Lee EK, Costello JF, Plass C, Vertino PM. 2003. Predicting aberrant CpG island methylation. Proc Natl Acad Sci 100: 12253–12258. [DOI] [PMC free article] [PubMed] [Google Scholar]
- Frietze S, Wang R, Yao L, Tak YG, Ye Z, Gaddis M, Witt H, Farnham PJ, Jin VX. 2012. Cell type-specific binding patterns reveal that TCF7L2 can be tethered to the genome by association with GATA3. Genome Biol 13: R52. [DOI] [PMC free article] [PubMed] [Google Scholar]
- Fullwood MJ, Liu MH, Pan YF, Liu J, Xu H, Mohamed YB, Orlov YL, Velkov S, Ho A, Mei PH, et al. 2009. An oestrogen-receptor-α-bound human chromatin interactome. Nature 462: 58–64. [DOI] [PMC free article] [PubMed] [Google Scholar]
- Ghavi-Helm Y, Klein FA, Pakozdi T, Ciglar L, Noordermeer D, Huber W, Furlong EE. 2014. Enhancer loops appear stable during development and are associated with paused polymerase. Nature 512: 96–100. [DOI] [PubMed] [Google Scholar]
- Gilchrist DA, Dos Santos G, Fargo DC, Xie B, Gao Y, Li L, Adelman K. 2010. Pausing of RNA polymerase II disrupts DNA-specified nucleosome organization to enable precise gene regulation. Cell 143: 540–551. [DOI] [PMC free article] [PubMed] [Google Scholar]
- Ginno PA, Lott PL, Christensen HC, Korf I, Chedin F. 2012. R-loop formation is a distinctive characteristic of unmethylated human CpG island promoters. Mol Cell 45: 814–825. [DOI] [PMC free article] [PubMed] [Google Scholar]
- Ginno PA, Lim YW, Lott PL, Korf I, Chedin F. 2013. GC skew at the 5′ and 3′ ends of human genes links R-loop formation to epigenetic regulation and transcription termination. Genome Res 23: 1590–1600. [DOI] [PMC free article] [PubMed] [Google Scholar]
- Hagege H, Klous P, Braem C, Splinter E, Dekker J, Cathala G, de Laat W, Forne T. 2007. Quantitative analysis of chromosome conformation capture assays (3C-qPCR). Nat Protoc 2: 1722–1733. [DOI] [PubMed] [Google Scholar]
- Hah N, Danko CG, Core L, Waterfall JJ, Siepel A, Lis JT, Kraus WL. 2011. A rapid, extensive, and transient transcriptional response to estrogen signaling in breast cancer cells. Cell 145: 622–634. [DOI] [PMC free article] [PubMed] [Google Scholar]
- Hah N, Murakami S, Nagari A, Danko CG, Kraus WL. 2013. Enhancer transcripts mark active estrogen receptor binding sites. Genome Res 23: 1210–1223. [DOI] [PMC free article] [PubMed] [Google Scholar]
- Hashimoto H, Vertino PM, Cheng X. 2010. Molecular coupling of DNA methylation and histone methylation. Epigenomics 2: 657–669. [DOI] [PMC free article] [PubMed] [Google Scholar]
- He HH, Meyer CA, Chen MW, Jordan VC, Brown M, Liu XS. 2012. Differential DNase I hypersensitivity reveals factor-dependent chromatin dynamics. Genome Res 22: 1015–1025. [DOI] [PMC free article] [PubMed] [Google Scholar]
- Jang MK, Mochizuki K, Zhou M, Jeong H-S, Brady JN, Ozato K. 2005. The bromodomain protein Brd4 is a positive regulatory component of P-TEFb and stimulates RNA polymerase II-dependent transcription. Mol Cell 19: 523–534. [DOI] [PubMed] [Google Scholar]
- Jia D, Jurkowska RZ, Zhang X, Jeltsch A, Cheng X. 2007. Structure of Dnmt3a bound to Dnmt3L suggests a model for de novo DNA methylation. Nature 449: 248–251. [DOI] [PMC free article] [PubMed] [Google Scholar]
- Jin F, Li Y, Dixon JR, Selvaraj S, Ye Z, Lee AY, Yen C-A, Schmitt AD, Espinoza CA, Ren B. 2013. A high-resolution map of the three-dimensional chromatin interactome in human cells. Nature 503: 290–294. [DOI] [PMC free article] [PubMed] [Google Scholar]
- Jones PA. 2012. Functions of DNA methylation: islands, start sites, gene bodies and beyond. Nat Rev Genet 13: 484–492. [DOI] [PubMed] [Google Scholar]
- Joseph R, Orlov YL, Huss M, Sun W, Kong SL, Ukil L, Pan YF, Li G, Lim M, Thomsen JS, et al. 2010. Integrative model of genomic factors for determining binding site selection by estrogen receptor-α. Mol Syst Biol 6: 456. [DOI] [PMC free article] [PubMed] [Google Scholar]
- Kagey JD, Kapoor-Vazirani P, McCabe MT, Powell DR, Vertino PM. 2010a. Long-term stability of demethylation after transient exposure to 5-aza-2′-deoxycytidine correlates with sustained RNA polymerase II occupancy. Mol Cancer Res 8: 1048–1059. [DOI] [PMC free article] [PubMed] [Google Scholar]
- Kagey MH, Newman JJ, Bilodeau S, Zhan Y, Orlando DA, van Berkum NL, Ebmeier CC, Goossens J, Rahl PB, Levine SS. 2010b. Mediator and cohesin connect gene expression and chromatin architecture. Nature 467: 430–435. [DOI] [PMC free article] [PubMed] [Google Scholar]
- Kanno T, Kanno Y, LeRoy G, Campos E, Sun H-W, Brooks SR, Vahedi G, Heightman TD, Garcia BA, Reinberg D. 2014. BRD4 assists elongation of both coding and enhancer RNAs by interacting with acetylated histones. Nat Struct Mol Biol 21: 1047–1057. [DOI] [PMC free article] [PubMed] [Google Scholar]
- Kim YJ, Greer CB, Cecchini KR, Harris LN, Tuck DP, Kim TH. 2013. HDAC inhibitors induce transcriptional repression of high copy number genes in breast cancer through elongation blockade. Oncogene 32: 2828–2835. [DOI] [PMC free article] [PubMed] [Google Scholar]
- Krumm A, Hickey LB, Groudine M. 1995. Promoter-proximal pausing of RNA polymerase II defines a general rate-limiting step after transcription initiation. Genes Dev 9: 559–572. [DOI] [PubMed] [Google Scholar]
- Kwak H, Lis JT. 2013. Control of transcriptional elongation. Annu Rev Genet 47: 483. [DOI] [PMC free article] [PubMed] [Google Scholar]
- Kwak H, Fuda NJ, Core LJ, Lis JT. 2013. Precise maps of RNA polymerase reveal how promoters direct initiation and pausing. Science 339: 950–953. [DOI] [PMC free article] [PubMed] [Google Scholar]
- Lam EY, Beraldi D, Tannahill D, Balasubramanian S. 2013. G-quadruplex structures are stable and detectable in human genomic DNA. Nat Commun 4: 1796. [DOI] [PMC free article] [PubMed] [Google Scholar]
- Lee BK, Bhinge AA, Battenhouse A, McDaniell RM, Liu Z, Song L, Ni Y, Birney E, Lieb JD, Furey TS, et al. 2012. Cell-type specific and combinatorial usage of diverse transcription factors revealed by genome-wide binding studies in multiple human cells. Genome Res 22: 9–24. [DOI] [PMC free article] [PubMed] [Google Scholar]
- Li W, Notani D, Ma Q, Tanasa B, Nunez E, Chen AY, Merkurjev D, Zhang J, Ohgi K, Song X, et al. 2013. Functional roles of enhancer RNAs for oestrogen-dependent transcriptional activation. Nature 498: 516–520. [DOI] [PMC free article] [PubMed] [Google Scholar]
- Liu W, Ma Q, Wong K, Li W, Ohgi K, Zhang J, Aggarwal AK, Rosenfeld MG. 2013. Brd4 and JMJD6-associated anti-pause enhancers in regulation of transcriptional pause release. Cell 155: 1581–1595. [DOI] [PMC free article] [PubMed] [Google Scholar]
- Liu P, Xiang Y, Fujinaga K, Bartholomeeusen K, Nilson K, Price DH, Peterlin BM. 2014. Release of P-TEFb from 7SK snRNP Activates HEXIM1 Transcription. J Biol Chem 289: 9918–9925. [DOI] [PMC free article] [PubMed] [Google Scholar]
- Loven J, Hoke HA, Lin CY, Lau A, Orlando DA, Vakoc CR, Bradner JE, Lee TI, Young RA. 2013. Selective inhibition of tumor oncogenes by disruption of super-enhancers. Cell 153: 320–334. [DOI] [PMC free article] [PubMed] [Google Scholar]
- Machanick P, Bailey TL. 2011. MEME-ChIP: motif analysis of large DNA datasets. Bioinformatics 27: 1696–1697. [DOI] [PMC free article] [PubMed] [Google Scholar]
- Marinello J, Chillemi G, Bueno S, Manzo SG, Capranico G. 2013. Antisense transcripts enhanced by camptothecin at divergent CpG-island promoters associated with bursts of topoisomerase I-DNA cleavage complex and R-loop formation. Nucleic Acids Res 41: 10110–10123. [DOI] [PMC free article] [PubMed] [Google Scholar]
- Nechaev S, Fargo DC, dos Santos G, Liu L, Gao Y, Adelman K. 2010. Global analysis of short RNAs reveals widespread promoter-proximal stalling and arrest of Pol II in Drosophila. Science 327: 335–338. [DOI] [PMC free article] [PubMed] [Google Scholar]
- Rahl PB, Lin CY, Seila AC, Flynn RA, McCuine S, Burge CB, Sharp PA, Young RA. 2010. c-Myc regulates transcriptional pause release. Cell 141: 432–445. [DOI] [PMC free article] [PubMed] [Google Scholar]
- Rao SS, Huntley MH, Durand NC, Stamenova EK, Bochkov ID, Robinson JT, Sanborn AL, Machol I, Omer AD, Lander ES. 2014. A 3D map of the human genome at kilobase resolution reveals principles of chromatin looping. Cell 159: 1665–1680. [DOI] [PMC free article] [PubMed] [Google Scholar]
- Ruike Y, Imanaka Y, Sato F, Shimizu K, Tsujimoto G. 2010. Genome-wide analysis of aberrant methylation in human breast cancer cells using methyl-DNA immunoprecipitation combined with high-throughput sequencing. BMC Genomics 11: 137. [DOI] [PMC free article] [PubMed] [Google Scholar]
- Schaukowitch K, Joo J-Y, Liu X, Watts JK, Martinez C, Kim T-K. 2014. Enhancer RNA facilitates NELF release from immediate early genes. Mol Cell 56: 29–42. [DOI] [PMC free article] [PubMed] [Google Scholar]
- Shrestha P, Xiao S, Dhakal S, Tan Z, Mao H. 2014. Nascent RNA transcripts facilitate the formation of G-quadruplexes. Nucleic Acids Res 42: 7236–7246. [DOI] [PMC free article] [PubMed] [Google Scholar]
- Skourti-Stathaki K, Proudfoot NJ, Gromak N. 2011. Human senataxin resolves RNA/DNA hybrids formed at transcriptional pause sites to promote Xrn2-dependent termination. Mol Cell 42: 794–805. [DOI] [PMC free article] [PubMed] [Google Scholar]
- Skourti-Stathaki K, Kamieniarz-Gdula K, Proudfoot NJ. 2014. R-loops induce repressive chromatin marks over mammalian gene terminators. Nature 516: 436–439. [DOI] [PMC free article] [PubMed] [Google Scholar]
- Thomson JP, Skene PJ, Selfridge J, Clouaire T, Guy J, Webb S, Kerr AR, Deaton A, Andrews R, James KD, et al. 2010. CpG islands influence chromatin structure via the CpG-binding protein Cfp1. Nature 464: 1082–1086. [DOI] [PMC free article] [PubMed] [Google Scholar]
- Wang C, Mayer JA, Mazumdar A, Fertuck K, Kim H, Brown M, Brown PH. 2011. Estrogen induces c-myc gene expression via an upstream enhancer activated by the estrogen receptor and the AP-1 transcription factor. Mol Endocrinol 25: 1527–1538. [DOI] [PMC free article] [PubMed] [Google Scholar]
- Welboren WJ, van Driel MA, Janssen-Megens EM, van Heeringen SJ, Sweep FC, Span PN, Stunnenberg HG. 2009. ChIP-seq of ERα and RNA polymerase II defines genes differentially responding to ligands. EMBO J 28: 1418–1428. [DOI] [PMC free article] [PubMed] [Google Scholar]
- Yang Z, Yik JH, Chen R, He N, Jang MK, Ozato K, Zhou Q. 2005. Recruitment of P-TEFb for stimulation of transcriptional elongation by the bromodomain protein Brd4. Mol Cell 19: 535–545. [DOI] [PubMed] [Google Scholar]
- Yang Y, McBride KM, Hensley S, Lu Y, Chedin F, Bedford MT. 2014. Arginine methylation facilitates the recruitment of TOP3B to chromatin to prevent R loop accumulation. Mol Cell 53: 484–497. [DOI] [PMC free article] [PubMed] [Google Scholar]
- Zhang W, Prakash C, Sum C, Gong Y, Li Y, Kwok JJ, Thiessen N, Pettersson S, Jones SJ, Knapp S. 2012. Bromodomain-containing protein 4 (BRD4) regulates RNA polymerase II serine 2 phosphorylation in human CD4+ T cells. J Biol Chem 287: 43137–43155. [DOI] [PMC free article] [PubMed] [Google Scholar]
- Zhang ZZ, Pannunzio NR, Han L, Hsieh CL, Yu K, Lieber MR. 2014. The strength of an Ig switch region is determined by its ability to drive R loop formation and its number of WGCW sites. Cell Rep 8: 557–569. [DOI] [PMC free article] [PubMed] [Google Scholar]
- Zippo A, Serafini R, Rocchigiani M, Pennacchini S, Krepelova A, Oliviero S. 2009. Histone crosstalk between H3S10ph and H4K16ac generates a histone code that mediates transcription elongation. Cell 138: 1122–1136. [DOI] [PubMed] [Google Scholar]
Associated Data
This section collects any data citations, data availability statements, or supplementary materials included in this article.