

Abstract
Speciation is a continuous process during which genetic changes gradually accumulate in the genomes of diverging species. Recent studies have documented highly heterogeneous differentiation landscapes, with distinct regions of elevated differentiation (“differentiation islands”) widespread across genomes. However, it remains unclear which processes drive the evolution of differentiation islands; how the differentiation landscape evolves as speciation advances; and ultimately, how differentiation islands are related to speciation. Here, we addressed these questions based on population genetic analyses of 200 resequenced genomes from 10 populations of four Ficedula flycatcher sister species. We show that a heterogeneous differentiation landscape starts emerging among populations within species, and differentiation islands evolve recurrently in the very same genomic regions among independent lineages. Contrary to expectations from models that interpret differentiation islands as genomic regions involved in reproductive isolation that are shielded from gene flow, patterns of sequence divergence (dxy and relative node depth) do not support a major role of gene flow in the evolution of the differentiation landscape in these species. Instead, as predicted by models of linked selection, genome-wide variation in diversity and differentiation can be explained by variation in recombination rate and the density of targets for selection. We thus conclude that the heterogeneous landscape of differentiation in Ficedula flycatchers evolves mainly as the result of background selection and selective sweeps in genomic regions of low recombination. Our results emphasize the necessity of incorporating linked selection as a null model to identify genome regions involved in adaptation and speciation.
Uncovering the genetic architecture of reproductive isolation and its evolutionary history are central tasks in evolutionary biology. The identification of genome regions that are highly differentiated between closely related species, and thereby constitute candidate regions involved in reproductive isolation, has recently been a major focus of speciation genetic research. Studies from a broad taxonomic range, involving organisms as diverse as plants (Renaut et al. 2013), insects (Turner et al. 2005; Lawniczak et al. 2010; Nadeau et al. 2012; Soria-Carrasco et al. 2014), fishes (Jones et al. 2012), mammals (Harr 2006), and birds (Ellegren et al. 2012) contribute to the emerging picture of a genomic landscape of differentiation that is usually highly heterogeneous, with regions of locally elevated differentiation (“differentiation islands”) widely spread over the genome. However, the evolutionary processes driving the evolution of the differentiation landscape and the role of differentiation islands in speciation are subject to controversy (Turner and Hahn 2010; Cruickshank and Hahn 2014; Pennisi 2014).
Differentiation islands were originally interpreted as “speciation islands,” regions that harbor genetic variants involved in reproductive isolation and are shielded from gene flow by selection (Turner et al. 2005; Soria-Carrasco et al. 2014). During speciation-with-gene-flow, speciation islands were suggested to evolve through selective sweeps of locally adapted variants and by hitchhiking of physically linked neutral variation (“divergence hitchhiking”) (Via and West 2008); gene flow would keep differentiation in the remainder of the genome at bay (Nosil 2008; Nosil et al. 2008). In a similar way, speciation islands can arise by allopatric speciation followed by secondary contact. In this case, genome-wide differentiation increases during periods of geographic isolation, but upon secondary contact, it is reduced by gene flow in genome regions not involved in reproductive isolation. In the absence of gene flow in allopatry, speciation islands need not (but can) evolve by local adaptation, but may consist of intrinsic incompatibilities sensu Bateson-Dobzhansky-Muller (Bateson 1909; Dobzhansky 1937; Muller 1940) that accumulated in spatially isolated populations.
However, whether differentiation islands represent speciation islands has been questioned. Rather than being a cause of speciation, differentiation islands might evolve only after the onset of reproductive isolation as a consequence of locally accelerated lineage sorting (Noor and Bennett 2009; Turner and Hahn 2010; White et al. 2010; Cruickshank and Hahn 2014; Renaut et al. 2014), such as in regions of low recombination (Nachman 2002; Sella et al. 2009; Cutter and Payseur 2013). In these regions, the diversity-reducing effects of both positive selection and purifying selection (background selection [BGS]) at linked sites (“linked selection”) impact physically larger regions due to the stronger linkage among sites. The thereby locally reduced effective population size (Ne) will enhance genetic drift and hence inevitably lead to increased differentiation among populations and species.
These alternative models for the evolution of a heterogeneous genomic landscape of differentiation are not mutually exclusive, and their population genetic footprints can be difficult to discern. In the cases of (primary) speciation-with-gene-flow and gene flow at secondary contact, shared variation outside differentiation islands partly stems from gene flow. In contrast, under linked selection, ancestral variation is reduced and differentiation elevated in regions of low recombination, while the remainder of the genome may still share considerable amounts of ancestral genetic variation and show limited differentiation. Many commonly used population genetic statistics do not capture these different origins of shared genetic variation and have the same qualitative expectations under both models, such as reduced diversity (π) and skews toward an excess of rare variants (e.g., lower Tajima's D) in differentiation islands relative to the remainder of the genome. However, since speciation islands should evolve by the prevention or breakdown of differentiation by gene flow in regions not involved in reproductive isolation, substantial gene flow should be detectable in these regions (Cruickshank and Hahn 2014) and manifested in the form of reduced sequence divergence (dxy) or as an excess of shared derived alleles in cases of asymmetrical gene flow (Patterson et al. 2012). Under linked selection, predictions are opposite for dxy (Cruickshank and Hahn 2014), owing to reduced ancestral diversity in low-recombination regions. Further predictions for linked selection include positive and negative relationships of recombination rate with genetic diversity (π) and differentiation (FST), respectively, and inverse correlations of the latter two with the density of targets for selection. Finally, important insights into the nature of differentiation islands may be gained by studying the evolution of differentiation landscapes across the speciation continuum. Theoretical models and simulations of speciation-with-gene-flow predict that after an initial phase during which differentiation establishes in regions involved in adaptation, differentiation should start spreading from these regions across the entire genome (Feder et al. 2012, 2014; Flaxman et al. 2013).
Unravelling the processes driving the evolution of the genomic landscape of differentiation, and hence understanding how genome differentiation unfolds as speciation advances, requires genome-wide data at multiple stages of the speciation continuum and in a range of geographical settings from allopatry to sympatry (Seehausen et al. 2014). Although studies of the speciation continuum are emerging (Hendry et al. 2009; Kronforst et al. 2013; Shaw and Mullen 2014, and references therein), empirical examples of genome differentiation at multiple levels of species divergence remain scarce (Andrew and Rieseberg 2013; Kronforst et al. 2013; Martin et al. 2013), and to our knowledge, have so far not jointly addressed the predictions of alternative models for the evolution of the genomic landscape of differentiation. In the present study, we implemented such a study design encompassing multiple populations of four black-and-white flycatcher sister species of the genus Ficedula (Fig. 1A,B; Supplemental Fig. S1; for a comprehensive reconstruction of the species tree, see Nater et al. 2015). Previous analyses in collared flycatcher (F. albicollis) and pied flycatcher (F. hypoleuca) revealed a highly heterogeneous differentiation landscape across the genome (Ellegren et al. 2012). An involvement of gene flow in its evolution would be plausible, as hybrids between these species occur at low frequencies in sympatric populations in eastern Central Europe and on the Baltic Islands of Gotland and Öland (Alatalo et al. 1990; Sætre et al. 1999), although a recent study based on genome-wide markers identified no hybrids beyond the F1 generation (Kawakami et al. 2014a). Still, gene flow from pied into collared flycatcher appears to have occurred (Borge et al. 2005; Backström et al. 2013; Nadachowska-Brzyska et al. 2013) despite premating isolation (for review, see Sætre and Sæther 2010), hybrid female sterility (Alatalo et al. 1990; Tegelström and Gelter 1990), and strongly reduced long-term fitness of hybrid males (Wiley et al. 2009). Atlas flycatcher (F. speculigera) and semicollared flycatcher (F. semitorquata) are two closely related species, which have been less studied, but may provide interesting insights into how genome differentiation evolves over time. Here, we take advantage of this system to identify the processes underlying the evolution of differentiation islands based on the population genetic analysis of whole-genome resequencing data of 200 flycatchers.
Figure 1.

A recurrently evolving genomic landscape of differentiation across the speciation continuum in Ficedula flycatchers. (A) Species’ neighbor-joining tree based on mean genome-wide net sequence divergence (dA). The same species tree topology was inferred with 100% bootstrap support from the distribution of gene trees under the multispecies coalescent (Supplemental Fig. S1). (B) Map showing the locations of population sampling and approximate species ranges. (C) Population genomic parameters along an example chromosome (Chromosome 4A) (see Supplemental Figs. S2, S4 for all chromosomes). Color codes for specific–specific parameters: (blue) collared; (green) pied; (orange) Atlas; (red) semicollared. Color codes for dxy: (green) collared-pied; (light blue) collared-Atlas; (blue) collared-semicollared; (orange) pied-Atlas; (red) pied-semicollared; (black) Atlas-semicollared. For differentiation within species, comparisons with the Italian (collared) and Spanish (pied) populations are shown. Color codes for FST within collared flycatchers: (cyan) Italy–Hungary; (light blue) Italy–Czech Republic; (dark blue) Italy–Baltic. Color codes for FST within pied flycatchers: (light green) Spain–Sweden; (green) Spain–Czech Republic; (dark green) Spain–Baltic. (D) Distributions of differentiation (FST) from collared flycatcher along the speciation continuum. Distributions are given separately for three autosomal recombination percentiles (33%; 33%–66%; 66%–100%) corresponding to high (>3.4 cM/Mb, blue), intermediate (1.3–3.4 cM/Mb, orange), and low recombination rate (0–1.3 cM/Mb, red), and the Z Chromosome (green). Geographically close within-species comparison: Italy–Hungary. Comparisons within species include the geographically close Italian and Hungarian populations (within [close]), and the geographically distant Italian and Baltic populations (within [far]). Geographically far within-species comparison: Italy–Baltic. (E) Differentiation from collared flycatcher along an example chromosome (Chromosome 11) (see Supplemental Fig. S3 for all chromosomes). Color codes for between-species comparisons: (green) pied; (orange) Atlas; (red) semicollared; (dark red) red-breasted; (black) snowy-browed flycatcher. Color codes for within-species comparisons: (cyan) Italy–Hungary; (blue) Italy–Baltic. Flycatcher artwork in panel A courtesy of Dan Zetterström.
Results
Recurrent evolution of a highly similar genomic landscape of differentiation in independent lineages
We resequenced genomes from four populations each of collared flycatcher and pied flycatcher, one population each of Atlas flycatcher and semicollared flycatcher (n = 20 for all populations), and single individuals of two outgroup species, red-breasted flycatcher (F. parva) and snowy-browed flycatcher (F. hyperythra) (Supplemental Table S1). The average sequencing coverage was 14.7 ± 4.5 × (mean ± SD) (Supplemental Table S2), and we identified a total of approximately 50 million variant sites across the four focal species (73 million variant sites, including outgroups). On average, two random chromosomes from any two species differ by 0.448% to 0.502%, which is only 1.13–1.68 times the average number of differences observed between two chromosomes within species (average nucleotide diversity, π: collared, 3.95 × 10⁻³; pied, 3.20 × 10⁻³; Atlas, 3.06 × 10⁻³; semicollared, 2.98 × 10⁻³). As illustrated by the distributions of genome-wide differentiation (FST) among populations and species, our data cover a wide range of differentiation across the speciation continuum (Fig. 1D).
In line with results from a pilot comparison of 10 collared and 10 pied flycatchers that identified about 50 differentiation islands distributed across most chromosomes (Ellegren et al. 2012), all pairwise comparisons between species revealed highly heterogeneous genomic landscapes of differentiation (Fig. 1C,E; Supplemental Figs. S2, S3). Strikingly, differentiation along the genomes was highly correlated between all possible pairwise comparisons among species (Fig. 1C,E; Supplemental Figs. S2, S3). Since these comparisons sample some branches repeatedly and therefore are not phylogenetically independent, we estimated population branch statistics (PBS), which represent lineage-specific FST (Shriver et al. 2004; Yi et al. 2010). This analysis revealed highly concordant differentiation landscapes among species, with islands independently appearing in the same genomic regions across all species (Fig. 1C,E; Supplemental Figs. S2, S3). The first axis (PC1) of a principal component analysis (PCA) captured 97.8% of the variance in PBS of homologous 200-kb windows among lineages. Moreover, FST in two phylogenetically independent pairwise comparisons, pied versus Atlas flycatcher, and collared versus semicollared flycatcher (Fig. 1A) were highly correlated (R = 0.804, t = 96.6, P < 10−15; PC1 explaining 99.6% of the common variance) (Fig. 2A). Furthermore, differentiation from outgroup species was also increased in the regions corresponding to differentiation islands among the black-and-white flycatchers (Fig. 1E; Supplemental Fig. S3). The findings were independent of window size, with qualitatively congruent results with a window size of 5 kb.
Figure 2.
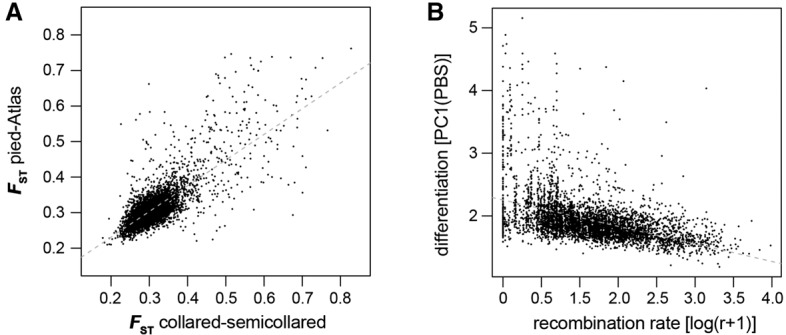
Differentiation in independent lineages and its correlation with recombination rate. (A) Correlation of FST in 200-kb windows among two phylogenetically independent comparisons (Pearson's correlation: R = 0.804, t = 96.6, P < 10−15). (B) Relationship between differentiation and recombination rate (r, cM/Mb). Differentiation is expressed as the first axis (PC1) from a PCA on lineage-specific FST (PBS; linear regression, t = −40.7, P < 10−15, R2 = 0.266).
These results demonstrate recurrent evolution of high differentiation in the same genomic regions across the speciation continuum and may be best explained by shared genomic features underlying the emergence of differentiation islands in independent lineages. In contrast, a parallel involvement of the very same large set of loci in reproductive isolation in different lineages appears unlikely. The former is supported by reduced levels of nucleotide diversity (π) in differentiation islands of all species (Supplemental Table S3) and a high correlation of π among species (PC1 explains 93.6% of the genome-wide variation) (Fig. 1C,E; Supplemental Fig. S2), suggesting common underlying mechanisms reducing Ne in differentiation islands. Importantly, a reduction of Ne in a common ancestor is not sufficient to explain the pattern of locally reduced diversity seen in all species, as this would be incompatible with high FST in those regions in comparisons between descendent lineages. Still, to further explore this possibility, we focused on SNPs unique to each species, which are expected to be highly enriched for lineage-specific mutations affected only by processes in descendent lineages. We found that lineage-specific SNPs showed strongly reduced diversity in differentiation islands in all four species (Fig. 1C; Supplemental Fig. S2; Supplemental Table S3), evidencing recurrent processes contributing toward highly concordant differentiation landscapes among species. Moreover, differentiation islands were not only observed in comparisons between species. Similar to Heliconius butterflies (Martin et al. 2013), already in the geographically most isolated populations within collared and pied flycatchers, regions corresponding to differentiation islands between species exhibited higher FST within species than the genomic background of low differentiation (Fig. 1C,E; Supplemental Fig. S4). Approximately half of the genomic windows within interspecific differentiation islands showed elevated differentiation also in any of the comparisons among collared (46.8%) or pied flycatcher (49.6%) populations, and within-species differentiation of the geographically most isolated populations was positively correlated with interspecific differentiation (PBS collared Italy: t = 20.6, P < 10−15; R2 = 0.084; PBS pied Spain: t = 30.5, P < 10−15; R2 = 0.167).
Gene flow is not a main factor governing the heterogeneous differentiation landscape
To investigate the predicted characteristics of the speciation island model, we explored whether the gene flow previously reported between collared and pied flycatcher (Backström et al. 2013; Nadachowska-Brzyska et al. 2013) may have homogenized genomes after secondary contact following the last glaciation. In such a scenario, differentiation is expected to decrease with increasing opportunity for gene flow (Martin et al. 2013), and an excess of derived variants shared between sympatric populations should be observed. To test these predictions, we benefited from a study design that included four pairs of collared flycatcher and pied flycatcher populations (Fig. 1B; Supplemental Table S1) that differ in the degree and timing of interspecific contact: (1) the presumed refugial populations of the respective species in Italy and Spain; (2) allopatric populations from Hungary and Sweden; (3) populations from an old zone of sympatry in the Czech Republic; and (4) populations from recent sympatry (50–150 yr ago) (Lundberg and Alatalo 1992) on the Baltic Island of Öland. Analysis of differentiation patterns showed that, against the prediction of a model with postglacial gene flow, sympatric populations were not less differentiated than allopatric populations (mean FST, sympatric: Czech Republic, 0.291, Baltic Sea island, 0.303; allopatric: Italy-Spain, 0.274; Hungary-Sweden, 0.288). This result was further supported by ABBA-BABA tests that found no excess of shared derived variants among sympatric populations of the two species (Tests 1–2, Supplemental Table S4).
To address the possibility of gene flow during previous interglacial periods, we first used ABBA-BABA tests with collared and pied flycatcher represented by their presumable refugial populations from Italy and Spain, respectively, together with the other two black-and-white flycatchers. Footprints of gene flow during this period were detected among collared, pied, and semicollared flycatchers (Tests 3–6, Supplemental Table S4), potentially indicating an impact of ancient gene flow on genome differentiation. However, this was not supported by an analysis of the variation in sequence divergence (dxy) along the genome. FST and dxy should both be reduced if variation in the genomic background is homogenized by gene flow, whereas differentiation islands are expected to show higher FST and dxy if they are resistant to introgression (Cruickshank and Hahn 2014). The same predictions as for dxy apply to relative node depth (RND) (Feder et al. 2005), which aims at correcting sequence divergence for mutation rate variation. Such a pattern was not observed in flycatchers (Fig. 1C; Supplemental Fig. S2; Supplemental Tables S5, S6). On the contrary, differentiation islands exhibited lower dxy and RND than the genomic background, suggesting reductions of Ne in islands already in the ancestral population (Nachman and Payseur 2012) that exceed the amplitude of potential antagonistic effects of gene flow on sequence divergence. Finally, contrary to predictions from models of genetic hitchhiking during speciation-with-gene-flow (Feder et al. 2012; Flaxman et al. 2013), no sign of broadening of differentiation islands across the flycatcher speciation continuum was observed (Fig. 1C; Supplemental Fig. S2), not even in comparisons including the two outgroup species (Fig. 1E; Supplemental Fig. S3).
Accelerated lineage sorting in regions of low recombination
An alternative hypothesis to the idea that differentiation islands are speciation islands is that they represent genomic regions of low intraspecific rates of recombination in which the effect of linked selection on Ne, and therefore levels of diversity, is pronounced (Noor and Bennett 2009; Nachman and Payseur 2012). The access to a recently developed high-density linkage map of the collared flycatcher genome (Kawakami et al. 2014a, b) enabled us to examine the relationship between recombination and differentiation in more detail than previously possible. Lineage-specific differentiation (PBS) significantly increased with decreasing recombination rate (linear regression, t = −40.7, P < 10−15, R2 = 0.266) (Fig. 2B), and low recombination was a hallmark of differentiation islands (marked examples including, for example, Chromosomes 4A, 10, 12, and 17) (Fig. 1C; Supplemental Fig. S2). Importantly, differentiation evolved faster toward fixation of segregating variants in low-recombination regions across the speciation continuum (Fig. 1D).
Strong impact of linked selection on the evolution of the differentiation landscape
As predicted for a model of linked selection (Charlesworth et al. 1993; Sella et al. 2009), genetic diversity (π) significantly correlated with recombination rate and the density of targets for selection measured as the density of coding sequence (multiple linear regression, recombination rate: t = 2.923, P = 0.003; exon density: t = −17.3, P < 10−15; interaction: t = 7.5, P < 10−12 ; R2 = 0.131). The same result was found for dxy (multiple linear regression, recombination rate: t = −3.5, P = 5 × 10⁻⁴; exon density: t = −19.9, P < 10−15; interaction: t = 9.8, P < 10−15 ; R2 = 0.121; without interaction: recombination rate: t = 8.1, P < 10−15 ; exon density: t = −22.4, P < 10−15; R2 = 0.102) and RND (multiple linear regression, recombination rate: t = 4.1, P = 4.5 × 10⁻⁵ ; exon density: t = −11.1, P < 10−15; interaction: t = 9.1, P < 10−15 ; R2 = 0.102), which at this level of divergence mostly reflect ancestral diversity. As predicted by the dependence of differentiation on within-population diversity (Charlesworth 1998), differentiation was highly negatively correlated to diversity (linear regression, t = −71.3, P < 10−15, R2 = 0.523). Accordingly, differentiation correlated with recombination rate and the density of targets for selection (multiple linear regression, recombination: t = −21.3, P < 10−15; exon density: t = 6.8, P < 10−10; interaction: t = −2.7, P = 0.007; R2 = 0.279).
Tajima's D was reduced in differentiation islands (Supplemental Fig. S2; Supplemental Table S7), demonstrating a skew in the site frequency spectrum toward an excess of low-frequency variants. Although this signal is in line with the action of linked selection in the evolution of differentiation islands, it does not discern whether linked selection occurred in the form of background selection against slightly deleterious mutations alone, or whether positive selection for advantageous variants was also involved. Moreover, selective sweeps may be difficult to detect in the presence of background selection (e.g., Enard et al. 2014). We therefore investigated the unfolded site frequency spectrum for skews that are unique to hitchhiking under positive selection. Low values of Fay and Wu's H (Fay and Wu 2000), indicative of an excess of high-frequency derived variants, were almost exclusively found in highly differentiated genome regions (Supplemental Fig. S2). However, contrary to all other population genetic parameters, drops in H in one species were usually not paralleled in other species (Supplemental Fig. S2), suggesting lineage-specific episodes of positive selection. Around 5% of conspicuous differentiation islands per species showed a pronounced excess of high-frequency derived variants expected from selective sweeps (Fig. 3; Supplemental Fig. S2; Supplemental Table S8). This leads us to conclude that in addition to a dominating role of background selection, divergent selection contributes to the evolution of reduced diversity and increased differentiation in a fraction of genome regions with low recombination.
Figure 3.
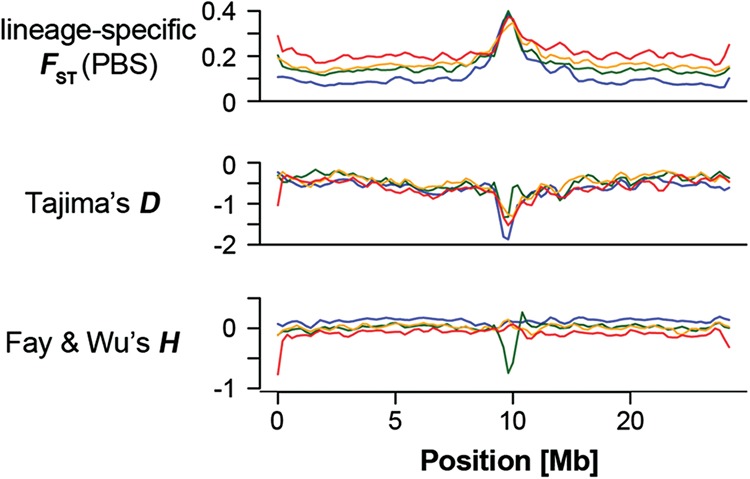
Site-frequency spectrum statistics across an example chromosome (Chromosome 10). Color codes: (blue) collared; (green) pied; (orange) Atlas; (red) semicollared flycatcher. A signal of selection as indicated by negative Tajima's D is seen in the centrally located island in all species, while evidence for positive selection as indicated by negative Fay and Wu's H, i.e., an excess of high-frequency derived variants, is seen in only one species (pied flycatcher). See Supplemental Figure S2 for all chromosomes.
Discussion
Genome-wide variation in gene flow and the effects of linked selection represent two mutually nonexclusive processes that can contribute to the evolution of heterogenous genomic landscapes of differentiation. If regions involved in reproductive isolation coincide with regions of low recombination, both processes may contribute to the evolution of low diversity and high differentiation in such regions relative to the remainder of the genome. Their effects may then only be discerned by their antagonistic effects on sequence divergence (dxy), which is reduced in low recombination regions by linked selection but reduced elsewhere by gene flow. Here, the demonstration of strongly reduced sequence divergence in low recombination regions is not compatible with a pure model of heterogeneous gene flow, but provides compelling evidence for a significant effect of linked selection on the genomic landscapes of diversity and differentiation. Therefore, although a contribution of gene flow to the observed patterns cannot be excluded, the diversity-reducing effects of linked selection must have been the dominant driver of high differentiation in genome regions of low recombination in Ficedula flycatchers.
We conclude that the heterogeneous genomic landscape of differentiation in Ficedula flycatchers evolves mainly as a consequence of a heterogeneous landscape of recombination. It starts emerging in structured populations and, owing to the conservation of the recombination landscape among species, evolves recurrently in independent lineages across the speciation continuum due to effects of linked selection. This supports models according to which the genomic landscape of differentiation does not primarily reflect processes associated with reproduction isolation and speciation (Turner and Hahn 2010; White et al. 2010; Roesti et al. 2012; Renaut et al. 2013). However, contrary to previous assertions (Cruickshank and Hahn 2014), speciation is not required for the evolution of a heterogeneous differentiation landscape, but more moderate reductions in gene flow such as in structured populations are sufficient to trigger this process. These results imply that differentiation islands are not necessarily involved in speciation, but do not exclude the possibility that a subset of these regions harbor speciation genes or that enhanced rates of genetic drift due to locally reduced Ne facilitate the (neutral) fixation of intrinsic incompatibilities in a subset of these regions.
The generality of the role of recombination in mediating the effects of linked selection (Charlesworth and Campos 2014) suggests that our conclusions are of broad relevance to the fields of speciation and adaptation genomics. Associations of high differentiation with low recombination rates in species with well-documented interspecific gene flow (Andrew and Rieseberg 2013; Renaut et al. 2013, 2014) demonstrate that recombination rate variation is an important factor in determining the distribution of differentiation across the genome even in cases of speciation-with-gene-flow. When gene flow occurs, its relative impact on the evolution of the genomic landscape of differentiation compared to linked selection will depend on various factors, including the amplitude of recombination rate variation across the genome. Everything else equal, linked selection will lead to more heterogeneous differentiation landscapes in species with high recombination rate variation and with a recombination landscape conserved for a longer period of time (Cutter and Payseur 2013). Variation in the relative impact of gene flow versus linked selection among species with comparable rates of gene flow may therefore be explained by different mechanisms regulating recombination (e.g., Youds and Boulton 2011; Serrentino and Borde 2012; Baudat et al. 2013) or differences in turnover rates of karyotypes affecting the stability of recombination cold spots, such as centromeres, the latter of which likely colocalize with differentiation islands within chromosomes of Ficedula flycatchers (Ellegren et al. 2012). The strong recombination rate variation observed in birds (Groenen et al. 2009; Backström et al. 2010; Kawakami et al. 2014b) and their stable karyotypes (Ellegren 2010) may therefore be highly conducive to patterns such as the ones reported here from Ficedula flycatchers.
Finally, our results call for utter caution with the interpretation of genome scans for adaptively evolving genome regions that are based on differentiation (FST and related measures, such as dA and df) or diversity and that do not take into account recombination rate variation or its effects on intraspecific genetic diversity. Such scans are likely to identify recombination-mediated elevations of differentiation not necessarily attributable to selective sweeps. Likewise, our findings argue that the presence of high differentiation in the same genome regions of closely related taxa should not be mistaken as evidence for parallel evolution. Rather, this pattern is a direct prediction of linked selection in low-recombination regions of taxa among which the recombination landscape is conserved. The effects of linked selection in heterogeneous recombination landscapes should therefore be taken into account to formulate appropriate null models to reliably identify genome regions involved in speciation or adaptation.
Methods
Sampling
Seventy-nine collared flycatchers and 79 pied flycatchers were sampled from four localities (20 birds from each population, 10 males and 10 females, except in two cases with 19 individuals) (Supplemental Table S1), with varying degree of geographic overlap with the range of the other species. Collared flycatchers were sampled in Italy, Hungary, Czech Republic, and on the Baltic Sea island Öland (referred to as “Baltic”) in Sweden. Pied flycatchers were sampled in Spain, Sweden (mainland), Czech Republic, and on Öland (“Baltic”) in Sweden. In addition, 20 Atlas flycatchers (F. speculigera; 14 males, 6 females) were sampled in the Moroccan Atlas Mountains, and 20 semicollared flycatchers (F. semitorquata; 9 males, 11 females) were sampled in Bulgaria. A red-breasted flycatcher (F. parva) from Sweden and a snowy-browed flycatcher (F. hyperythra) from Indonesia were included as outgroups to polarize polymorphisms. According to mitochondrial cytochrome b sequence divergence, the divergence time of red-breasted flycatcher and of snowy-browed flycatcher to the black-and-white flycatcher complex dates back to ∼4–5 and 6 million years ago, respectively.
DNA extraction, genome sequencing, and SNP-array genotyping
Samples consisted of blood stored in 96% ethanol (Spain, Czech Republic, Baltic pied flycatcher) or Queen's Lysis buffer (Italy, Atlas flycatcher, semicollared flycatcher) stored at 4°C (Atlas and semicollared flycatcher) or −20°C (all others). Tissues from Sweden, Baltic collared flycatcher, and red-breasted flycatcher consisted of muscle stored in 96% ethanol. The tissue of snowy-browed flycatcher consisted of muscle stored in salt buffer containing DMSO.
DNA was prepared using Qiagen's Blood and Tissue Kit following the manufacturer's instruction (Qiagen), including RNA-digestion, and avoiding strong vortexing in order to limit sharing of the DNA. Whole-genome resequencing was performed with Illumina paired-end sequencing technology, using a HiSeq 2000 instrument at the SNP&Seq Technology Platform of Uppsala University. Individually tagged libraries with insert sizes of ∼450 bp were constructed and sequenced from both ends using 100 cycles.
Twelve individuals from each collared and pied flycatcher population (except six for the Baltic pied population) were genotyped on a custom 50K Illumina iSelect SNP array according to protocols described elsewhere (Kawakami et al. 2014a) for use as a training data set for VQSR.
Data preparation
All raw sequencing reads were mapped to a repeat-masked version of the collared flycatcher genome assembly FicAlb1.5 (Kawakami et al. 2014b) using BWA 0.7.4 (Li and Durbin 2009) with a soft-clipping base-quality threshold of 5 to avoid low-quality bases in alignments. On average, 94.2% ± 3.3% of the reads mapped to the reference genome, and reads from all four focal species mapped equally well (Supplemental Table S2). Mapping success was reduced to 83.6% and 72.6% in the near (F. parva) and far (F. hyperythra) outgroup, respectively. Alignment quality was enhanced by local realignment with GATK (McKenna et al. 2010; DePristo et al. 2011). Duplicates were marked at the library level using Picard (http://broadinstitute.github.io/picard/). Final sequencing coverage (excluding duplicates) was 14.7× per individual (minimum 5.0×, maximum 26.7×) (Supplemental Table S2) when considering the total assembly length (1.1 Gb).
All subsequent steps were performed for each population separately to account for population structure in the process of SNP identification. Base quality score recalibration (BQSR) requires knowledge of variant sites. However, no extensive catalogs of such sites were available for flycatchers. We therefore applied an approach to identify a reliable set of variant sites that iteratively calls variants and uses a high-quality variant set from these for BQSR. The initial round of variant calling using the original BAM files was performed using UnifiedGenotyper in GATK, SAMtools (Li et al. 2009), and FreeBayes (Garrison and Marth 2012) using default settings. Variant sites overlapping between all three methods were extracted. From these sites, SNPs for which at least one nonreference homozygote individual was identified were included in the set of sites to be input into BQSR as variant sites. A second round of variant calling was then run, using GATK only. As a test, we performed a second round of BQSR for one population, and since variant calls were consistent between the second and third rounds of calling, we considered the procedure to have converged and thus refrained from using a third round. For analyses that required genotypes, variant quality-score recalibration (VQSR) was performed. Following BQSR, the SNP calls were analyzed, and the highest scoring 20% of SNPs and 34,786 variant sites confirmed by SNP typing on the SNP array were used as a training data set for VQSR in GATK. SNPs contained in the 90% and 99% tranches were retained, resulting in approximately 11–22 million SNPs per population/species (Supplemental Table S2). Finally, a catalog of all sites variable within and between all populations and species was assembled using GATK's CombineVariants, and all sites (73,366,635 sites when including outgroups, 50,005,568 without outgroups) were genotyped using UnifiedGenotyper. Genotyping was performed for each population separately in order to account for allele frequency stratification. Final analyses for each population only considered sites with data for all individuals in that population.
Repeat annotation
After the recent release of a second-generation collared flycatcher genome assembly (Kawakami et al. 2014b), we updated the repeat annotation in order to optimize the exclusion of repeat-derived regions. We screened the FicAlb1.5 assembly for flycatcher-specific repeats by using RepeatModeler (version 1.0.5; http://www.repeatmasker.org/RepeatModeler.html), a de novo repeat identification and modelling package that uses RMBlast (http://www.repeatmasker.org/RMBlast.html) and integrates the programs RECON version 1.07 (Bao and Eddy 2002), RepeatScout version 1.0.5 (Price et al. 2005), and Tandem repeats finder version 4.0.4 (Benson 1999). We manually curated the resulting repeat candidate library following standard procedures (Lavoie et al. 2013). Briefly, curation was done via BLASTN (Altschul et al. 1990) searching for long terminal repeat (LTR) retrotransposon-like repeat candidates against FicAlb1.5 and extraction of up to 50 of the best hits along with 1 kb of flanking sequence, respectively. For each of these LTR repeat candidates, we aligned the consensus sequence with its BLASTN hits using MAFFT (Katoh and Toh 2008) and subsequently generated a new, manually inspected consensus sequence. Each consensus sequence was considered to be complete only if it was flanked by a single-copy sequence at its 5′ and 3′ ends within the alignment. After combining the flycatcher repeat library (containing 30 LTR subfamilies with complete consensus sequences and 249 other possibly incomplete repeat consensus sequences) with previously known avian repeat elements (mainly from chicken and zebra finch) available in Repbase (http://www.girinst.org/repbase/index.html), we used this custom repeat library to annotate and mask the collared flycatcher genome assembly via RepeatMasker (version 3.2.9; http://www.repeatmasker.org/RMDownload.html). The masked version was used in all subsequent analyses.
Estimation and analysis of population genetic parameters
Population genetic parameters were estimated for nonoverlapping 200-kb windows along the genome, as 200 kb was the highest resolution for which pedigree-based recombination rates could be estimated. Population genetic inference was based on genotype likelihoods. ANGSD (Korneliussen et al. 2014) was used to estimate allele frequency likelihoods, obtain a maximum likelihood estimate of the unfolded site frequency spectrum (SFS) (Nielsen et al. 2012), and estimate diversity and SFS statistics including Tajima's D, and Fay and Wu's H (Fay and Wu 2000). Only sites with a minimal mapping quality of 1 and minimal quality score of 20 were considered. The ancestral sequence was reconstructed using genotypes from the two outgroup species based on parsimony. Genetic differentiation (FST) based on genotype likelihoods was estimated based on the two-dimensional SFS using ngsTools (Fumagalli et al. 2014). Sequence divergence (dxy) was estimated from minor allele frequencies estimated in ANGSD. Additionally, to obtain an estimate of sequence divergence corrected for mutation rate, relative node depth (RND) (Feder et al. 2005) was estimated by dividing dxy between focal species with the average of dxy between each focal species and snowy-browed flycatcher. To obtain the latter, dxy was estimated based on genotype data from the collared (Italy), pied (Spain), Atlas, and semicollared flycatcher individual (male) with the highest mean sequencing coverage. In order to obtain an estimator for the amount of allele frequency changes specific to each population, we estimated the population branch statistic (PBS) (Shriver et al. 2004; Yi et al. 2010) for collared, pied, Atlas, and semicollared flycatchers. Final analyses included 4961 200-kb windows containing at least 100,000 sites passing the filtering criteria in ANGSD.
To study differentiation across longer evolutionary time scales, we estimated FST between the four black-and-white flycatchers and the two outgroups. Since only single outgroup individuals were sequenced, only one individual of each species was used for this analysis (the male with highest mean sequencing coverage), and only loci with data available for all individuals in the population sample were included. Weir and Cockerham's (1984) unbiased estimator of FST was estimated based on genotypes using Yang's (1998) hierarchical estimation procedure implemented in the HIERFSTAT package (Goudet 2005) in R. Multi-SNP FST estimates for the 200-kb windows were obtained as ratio of averages of variance components.
Recombination rate estimates in cM/Mb for 200-kb windows were taken from Kawakami et al (2014b).
To investigate the relationship between the population genetic parameters and genomic features, we performed principal component analyses (PCA) of the four π estimates, six dxy estimates, six RND estimates, and four PBS estimates and used the respective first axis (PC1) as representative for the common variation in diversity, sequence divergence, and differentiation, respectively. We performed multiple linear regression analysis with either PC1(π), PC1(dxy), PC1(RND), or PC1(PBS) as response variable and recombination rate, exon density, and their interaction term as candidate explanatory variables. To reduce the skewedness in their distribution, we transformed PC1(PBS) by log-transformation to base 10, recombination rate by log-transformation to base 10, after adding a constant of 1 to keep zero rate values, and exon density by square root transformation. The same analysis was done using FST instead of PBS, providing highly similar results (data not shown). To investigate the correlation of the interspecific differentiation landscape with the differentiation landscapes within collared and within pied flycatcher, we performed linear regressions of PC1(PBS) from interspecific comparisons obtained as described above against PBS estimates obtained from within-species comparisons, and estimated the overlap of interspecific differentiation islands with windows attributed to differentiation islands within any of the six within-species comparisons within collared or pied flycatcher respectively. All statistical analyses were performed using autosomal windows exclusively.
To test each differentiation island for whether it had significantly reduced Fay and Wu's H and Tajima's D, we compared the mean value in each island against the background distribution of these parameters. The latter was obtained by excluding all windows attributed to differentiation islands in any species. Significance of the tests was estimated after sequential Bonferroni correction.
Unless otherwise stated, parameter estimates of all figures are shown smoothed using a Savitzky-Golay filter with a cubic regression within five consecutive windows.
Inference of differentiation islands
In order to detect autosomal 200-kb windows of high differentiation, a null distribution of differentiation for each pairwise comparison was obtained by randomizing autosomal SNPs across SNP positions, while maintaining the number of windows and the distribution of the number of SNPs per window. From this, PBS cut-off values were obtained by calculating PBS from the upper 0.5% percentile of the null distribution. Observed PBS-values were smoothed using a Savitzky-Golay smoothing filter in R with a cubic regression within 15 consecutive windows. Windows were then assigned to differentiation islands if their smoothed lineage-specific FST value exceeded the respective cut-off. Interspecific differentiation islands were defined as windows situated in differentiation islands in all interspecific comparisons.
Estimation of shared derived variation
To infer gene flow among the four flycatcher species, we applied a test based on Patterson's D-statistic (Kulathinal et al. 2009; Green et al. 2010; Durand et al. 2011) that uses an asymmetric four-species tree setting (also known as “ABBA-BABA” test). In such a framework, an excess of shared derived variation between the first outgroup species and one of the inner species (“ABBA”) versus the other inner species (“BABA”) is interpreted as gene flow into the species showing the excess. To assess genome-wide patterns of introgression in species with population samples, we calculated the frequency of “ABBA” and “BABA” patterns using the formulas (1-p1)p2p3 and p1(1-p2)p3, respectively, with pi being the estimated derived allele frequencies for the three inner species obtained from ANGSD (Green et al. 2010; Durand et al. 2011). The fourth species is used to determine the ancestral state of SNPs and is not required in our case, since we already polarized variant sites with data from F. parva and F. hyperythra. We then summed the frequencies of the “ABBA” and “BABA” site patterns over contiguous 5-Mb windows (n = 197) and obtained standard errors by applying a block-jackknife procedure (Green et al. 2010). We chose the length of the blocks to be much larger than the occurrence of linkage disequilibrium in flycatchers, even in low-recombination regions, therefore addressing the problem of non-independence among sites (Kawakami et al. 2014a). We then calculated the mean and variance of the D-statistic among the 197 leave-one-out replicates by weighting by the number of polymorphic sites within each 5-Mb window. This way, we obtained approximately normally distributed standard errors (Efron 1981; Reich et al. 2009), from which we calculated Z-scores against an expected value of the D-statistic of zero. We then obtained the corresponding two-tailed P-values from the cumulative function of the standard normal distribution.
Genealogical sorting
To assess genome-wide variation in lineage sorting within each of the four focal species, we calculated the genealogical sorting index (gsi) (Cummings et al. 2008) for each species in 200-kb windows. The gsi statistic quantifies the degree of clustering of haplotypes in a phylogenetic tree, with a value of one indicating that a species forms a monophyletic group, and a value of zero indicating a random distribution of haplotypes in the tree. To minimize recombination within and linkage between loci, we calculated gsi statistics for 10-kb windows with a spacing of 40 kb between subsequent windows and then averaged over four windows to obtain statistics for the same 200-kb windows as used in the other population genomic analyses. For each 10-kb window, we first performed statistical phasing with fastPHASE v1.4.0 (Scheet and Stephens 2006), using a fixed number of 10 clusters and otherwise default settings. We phased all 198 individuals of the four flycatcher species together, but provided subpopulation structure to the program based on the species designation. We coded heterozygous positions with <80% posterior phasing support as missing data. Furthermore, we randomly selected one haplotype per individual for further analysis to minimize the effect of phasing error. Due to unequal sampling sizes in the four species, we subsampled collared and pied flycatchers to 20 individuals each after phasing by selecting the five individuals per population with the highest sequence coverage for each window. For the two outgroup individuals, we produced haplotypes by selecting one of the two alleles for each heterozygous position at random. Using an alignment of 82 haploid sequences, we built a phylogenetic tree applying the GTRGAMMA substitution model in RAxML v8.0.20 (Stamatakis 2014). We rooted the resulting tree with the F. hyperythra outgroup using Newick Utilities v1.6 (Junier and Zdobnov 2010) and calculated gsi statistics on the rooted tree with a custom-made Perl script using the BioPerl Tree module (Stajich et al. 2002).
Species tree reconstruction
To infer the species tree of the four closely related flycatcher species and the two outgroups, we analyzed a large number of gene trees in a multispecies coalescent framework implemented in the software MP-EST v1.4 (Liu et al. 2010). For this, we reused the same set of gene trees from 10-kb windows as inferred for the gsi statistic, but excluded windows on the Z Chromosome, resulting in a total of 17,504 gene trees. We then performed 10 independent runs of MP-EST and retained the species tree with the highest pseudolikelihood (Supplemental Fig. S1). To get bootstrap support values for each clade, we applied a gene tree resampling approach. We performed 1000 bootstrap replicates by resampling with replacement 17,504 trees from the set of gene trees. Each bootstrap replicate was then used to run MP-EST as for the original species tree inference. The set of species trees from the bootstrap replicates were summarized with Newick Utilities (Junier and Zdobnov 2010), and the resulting bootstrap support values were added to the species tree inferred from the original data.
Data access
Resequencing data from this study have been submitted to the EMBL-EBI European Nucleotide Archive (ENA; http://www.ebi.ac.uk/ena) under accession number PRJEB7359. Custom Perl and R scripts used in this study are available as Supplemental Scripts.
Supplementary Material
Acknowledgments
This research was supported by the European Research Council (AdG 249976), the Knut and Alice Wallenberg Foundation (Wallenberg Scholar Grant), and the Swedish Research Council (2010-5650, all to H.E.); the Swiss National Science Foundation (PBLAP3-134299 and PBLAP3_140171 to R.B.); and the Czech Science Foundation (P302/12/1207 to S.B.). Sequencing was performed by the SNP&SEQ Technology Platform in Uppsala, which is supported by Uppsala University, Uppsala University Hospital, Science for Life Laboratory Uppsala, and the Swedish Research Council (80576801 and 70374401). We thank Elodie Kuhnert, Jochen Wolf, Egidio Fulco, Stefano Sarrocco, and Fernando Spina, and the Instituto Superiore per la Protezione e la Ricerca Ambientale for support with fieldwork. We are grateful to Matteo Fumagalli and Thorfinn Korneliussen for assistance with ngsTools and ANGSD software, respectively. The Natural History Museum of Stockholm and the Zoological Museum of the University of Copenhagen kindly contributed tissue samples of red-breasted flycatcher (Ficedula parva; accession NRM996601) and snowy-browed flycatcher (F. hyperythra; accession 148317), respectively. The Natural History Museum in Oslo stored DNA samples. We thank Chris Jiggins and two additional reviewers for their constructive comments on an earlier version of the manuscript. Computations were performed on resources provided by SNIC through the Uppsala Multidisciplinary Center for Advanced Computational Science (UPPMAX).
Author contributions: R.B. and H.E. conceived the study. R.B., S.B., L.Z.G., S.H., J.M., A.Q., M.R., S.A.S., G.P.S., and J.T. performed field work. R.B. and P.I.O. performed bioinformatics analyses. A.S. was responsible for the repeat annotation. L.S. updated the reference assembly. R.B., A.N., T.K., C.F.M., and L.D. conducted population genomic analyses. R.B. and H.E. wrote the manuscript with input from the other authors and prepared the Supplemental Material with contributions from A.N. and A.S.
Footnotes
[Supplemental material is available for this article.]
Article published online before print. Article, supplemental material, and publication date are at http://www.genome.org/cgi/doi/10.1101/gr.196485.115.
Freely available online through the Genome Research Open Access option.
References
- Alatalo RV, Eriksson D, Gustafsson L, Lundberg A. 1990. Hybridization between pied and collared flycatchers—sexual selection and speciation theory. J Evol Biol 3: 375–389. [Google Scholar]
- Altschul SF, Gish W, Miller W, Myers EW, Lipman DJ. 1990. Basic local alignment search tool. J Mol Biol 215: 403–410. [DOI] [PubMed] [Google Scholar]
- Andrew RL, Rieseberg LH. 2013. Divergence is focused on few genomic regions early in speciation: incipient speciation in sunflower ecotypes. Evolution 67: 2468–2482. [DOI] [PubMed] [Google Scholar]
- Backström N, Forstmeier W, Schielzeth H, Mellenius H, Nam K, Bolund E, Webster MT, Öst T, Schneider M, Kempenaers B, et al. 2010. The recombination landscape of the zebra finch Taeniopygia guttata genome. Genome Res 20: 485–495. [DOI] [PMC free article] [PubMed] [Google Scholar]
- Backström N, Sætre GP, Ellegren H. 2013. Inferring the demographic history of European Ficedula flycatcher populations. BMC Evol Biol 13: 2. [DOI] [PMC free article] [PubMed] [Google Scholar]
- Bao Z, Eddy SR. 2002. Automated de novo identification of repeat sequence families in sequenced genomes. Genome Res 12: 1269–1276. [DOI] [PMC free article] [PubMed] [Google Scholar]
- Bateson W. 1909. Heredity and variation in modern lights. In Darwin and modern science (ed. Seward AC), pp. 85–101. Cambridge University Press, Cambridge, UK. [Google Scholar]
- Baudat F, Imai Y, de Massy B. 2013. Meiotic recombination in mammals: localization and regulation. Nat Rev Genet 14: 794–806. [DOI] [PubMed] [Google Scholar]
- Benson G. 1999. Tandem repeats finder: a program to analyze DNA sequences. Nucleic Acids Res 27: 573–580. [DOI] [PMC free article] [PubMed] [Google Scholar]
- Borge T, Lindroos K, Nádvorník P, Syvänen AC, Sætre GP. 2005. Amount of introgression in flycatcher hybrid zones reflects regional differences in pre and post-zygotic barriers to gene exchange. J Evol Biol 18: 1416–1424. [DOI] [PubMed] [Google Scholar]
- Charlesworth B. 1998. Measures of divergence between populations and the effect of forces that reduce variability. Mol Biol Evol 15: 538–543. [DOI] [PubMed] [Google Scholar]
- Charlesworth B, Campos JL. 2014. The relations between recombination rate and patterns of molecular variation and evolution in Drosophila. Annu Rev Genet 48: 383–403. [DOI] [PubMed] [Google Scholar]
- Charlesworth B, Morgan MT, Charlesworth D. 1993. The effect of deleterious mutations on neutral molecular variation. Genetics 134: 1289–1303. [DOI] [PMC free article] [PubMed] [Google Scholar]
- Cruickshank TE, Hahn MW. 2014. Reanalysis suggests that genomic islands of speciation are due to reduced diversity, not reduced gene flow. Mol Ecol 23: 3133–3157. [DOI] [PubMed] [Google Scholar]
- Cummings MP, Neel MC, Shaw KL. 2008. A genealogical approach to quantifying lineage divergence. Evolution 62: 2411–2422. [DOI] [PubMed] [Google Scholar]
- Cutter AD, Payseur BA. 2013. Genomic signatures of selection at linked sites: unifying the disparity among species. Nat Rev Genet 14: 262–274. [DOI] [PMC free article] [PubMed] [Google Scholar]
- DePristo MA, Banks E, Poplin R, Garimella KV, Maguire JR, Hartl C, Philippakis AA, del Angel G, Rivas MA, Hanna M, et al. 2011. A framework for variation discovery and genotyping using next-generation DNA sequencing data. Nat Genet 43: 491–498. [DOI] [PMC free article] [PubMed] [Google Scholar]
- Dobzhansky T. 1937. Genetics and the origin of species. Columbia University Press, New York. [Google Scholar]
- Durand EY, Patterson N, Reich D, Slatkin M. 2011. Testing for ancient admixture between closely related populations. Mol Biol Evol 28: 2239–2252. [DOI] [PMC free article] [PubMed] [Google Scholar]
- Efron B. 1981. Nonparametric estimates of standard error: the jackknife, the bootstrap and other methods. Biometrika 68: 589–599. [Google Scholar]
- Ellegren H. 2010. Evolutionary stasis: the stable chromosomes of birds. Trends Ecol Evol 25: 283–291. [DOI] [PubMed] [Google Scholar]
- Ellegren H, Smeds L, Burri R, Olason PI, Backström N, Kawakami T, Kunstner A, Makinen H, Nadachowska-Brzyska K, Qvarnstrom A, et al. 2012. The genomic landscape of species divergence in Ficedula flycatchers. Nature 491: 756–760. [DOI] [PubMed] [Google Scholar]
- Enard D, Messer PW, Petrov DA. 2014. Genome-wide signals of positive selection in human evolution. Genome Res 24: 885–895. [DOI] [PMC free article] [PubMed] [Google Scholar]
- Fay JC, Wu CI. 2000. Hitchhiking under positive Darwinian selection. Genetics 155: 1405–1413. [DOI] [PMC free article] [PubMed] [Google Scholar]
- Feder JL, Xie X, Rull J, Velez S, Forbes A, Leung B, Dambroski H, Filchak KE, Aluja M. 2005. Mayr, Dobzhansky, and Bush and the complexities of sympatric speciation in Rhagoletis. Proc Natl Acad Sci 102: 6573–6580. [DOI] [PMC free article] [PubMed] [Google Scholar]
- Feder JL, Egan SP, Nosil P. 2012. The genomics of speciation-with-gene-flow. Trends Genet 28: 342–350. [DOI] [PubMed] [Google Scholar]
- Feder JL, Nosil P, Wacholder AC, Egan SP, Berlocher SH, Flaxman SM. 2014. Genome-wide congealing and rapid transitions across the speciation continuum during speciation with gene flow. J Hered 105: 810–820. [DOI] [PubMed] [Google Scholar]
- Flaxman SM, Feder JL, Nosil P. 2013. Genetic hitchhiking and the dynamic buildup of genomic divergence during speciation with gene flow. Evolution 67: 2577–2591. [DOI] [PubMed] [Google Scholar]
- Fumagalli M, Vieira FG, Linderoth T, Nielsen R. 2014. ngsTools: methods for population genetics analyses from next-generation sequencing data. Bioinformatics 30: 1486–1487. [DOI] [PMC free article] [PubMed] [Google Scholar]
- Garrison E, Marth G. 2012. Haplotype-based variation detection from short-read sequencing. arXiv:1207.3907. [q-bio.GN]. [Google Scholar]
- Goudet J. 2005. HIERFSTAT, a package for R to compute and test hierarchical F-statistics. Mol Ecol Notes 5: 184–186. [Google Scholar]
- Green RE, Krause J, Briggs AW, Maricic T, Stenzel U, Kircher M, Patterson N, Li H, Zhai W, Fritz MH, et al. 2010. A draft sequence of the Neandertal genome. Science 328: 710–722. [DOI] [PMC free article] [PubMed] [Google Scholar]
- Groenen MA, Wahlberg P, Foglio M, Cheng HH, Megens HJ, Crooijmans RP, Besnier F, Lathrop M, Muir WM, Wong GK, et al. 2009. A high-density SNP-based linkage map of the chicken genome reveals sequence features correlated with recombination rate. Genome Res 19: 510–519. [DOI] [PMC free article] [PubMed] [Google Scholar]
- Harr B. 2006. Genomic islands of differentiation between house mouse subspecies. Genome Res 16: 730–737. [DOI] [PMC free article] [PubMed] [Google Scholar]
- Hendry AP, Bolnick DI, Berner D, Peichel CL. 2009. Along the speciation continuum in sticklebacks. J Fish Biol 75: 2000–2036. [DOI] [PubMed] [Google Scholar]
- Jones FC, Grabherr MG, Chan YF, Russell P, Mauceli E, Johnson J, Swofford R, Pirun M, Zody MC, White S, et al. 2012. The genomic basis of adaptive evolution in threespine sticklebacks. Nature 484: 55–61. [DOI] [PMC free article] [PubMed] [Google Scholar]
- Junier T, Zdobnov EM. 2010. The Newick utilities: high-throughput phylogenetic tree processing in the UNIX shell. Bioinformatics 26: 1669–1670. [DOI] [PMC free article] [PubMed] [Google Scholar]
- Katoh K, Toh H. 2008. Recent developments in the MAFFT multiple sequence alignment program. Brief Bioinform 9: 286–298. [DOI] [PubMed] [Google Scholar]
- Kawakami T, Backström N, Burri R, Husby A, Olason P, Rice AM, Ålund M, Qvarnström A, Ellegren H. 2014a. Estimation of linkage disequilibrium and interspecific gene flow in Ficedula flycatchers by a newly developed 50k single-nucleotide polymorphism array. Mol Ecol Res 14: 1248–1260. [DOI] [PMC free article] [PubMed] [Google Scholar]
- Kawakami T, Smeds L, Backström N, Husby A, Qvarnström A, Mugal CF, Olason P, Ellegren H. 2014b. A high-density linkage map enables a second-generation collared flycatcher genome assembly and reveals the patterns of avian recombination rate variation and chromosomal evolution. Mol Ecol 23: 4035–4058. [DOI] [PMC free article] [PubMed] [Google Scholar]
- Korneliussen TS, Albrechtsen A, Nielsen R. 2014. ANGSD: Analysis of Next Generation Sequencing Data. BMC Bioinformatics 15: 356. [DOI] [PMC free article] [PubMed] [Google Scholar]
- Kronforst MR, Hansen ME, Crawford NG, Gallant JR, Zhang W, Kulathinal RJ, Kapan DD, Mullen SP. 2013. Hybridization reveals the evolving genomic architecture of speciation. Cell Rep 5: 666–677. [DOI] [PMC free article] [PubMed] [Google Scholar]
- Kulathinal RJ, Stevison LS, Noor MAF. 2009. The genomics of speciation in Drosophila: diversity, divergence, and introgression estimated using low-coverage genome sequencing. PLoS Genet 5: e1000550. [DOI] [PMC free article] [PubMed] [Google Scholar]
- Lavoie CA, Platt RN II, Novick PA, Counterman BA, Ray DA. 2013. Transposable element evolution in Heliconius suggests genome diversity within lepidoptera. Mobile DNA 4: 21. [DOI] [PMC free article] [PubMed] [Google Scholar]
- Lawniczak MK, Emrich SJ, Holloway AK, Regier AP, Olson M, White B, Redmond S, Fulton L, Appelbaum E, Godfrey J, et al. 2010. Widespread divergence between incipient Anopheles gambiae species revealed by whole genome sequences. Science 330: 512–514. [DOI] [PMC free article] [PubMed] [Google Scholar]
- Li H, Durbin R. 2009. Fast and accurate short read alignment with Burrows–Wheeler transform. Bioinformatics 25: 1754–1760. [DOI] [PMC free article] [PubMed] [Google Scholar]
- Li H, Handsaker B, Wysoker A, Fennell T, Ruan J, Homer N, Marth G, Abecasis G, Durbin R, 1000 Genome Project Data Processing Subgroup. 2009. The sequence alignment/map format and SAMtools. Bioinformatics 25: 2078–2079. [DOI] [PMC free article] [PubMed] [Google Scholar]
- Liu L, Yu L, Edwards S. 2010. A maximum pseudo-likelihood approach for estimating species trees under the coalescent model. BMC Evol Biol 10: 302. [DOI] [PMC free article] [PubMed] [Google Scholar]
- Lundberg A, Alatalo RV. 1992. The pied flycatcher. T & AD Poyser Ltd., London, UK. [Google Scholar]
- Martin SH, Dasmahapatra KK, Nadeau NJ, Salazar C, Walters JR, Simpson F, Blaxter M, Manica A, Mallet J, Jiggins CD. 2013. Genome-wide evidence for speciation with gene flow in Heliconius butterflies. Genome Res 23: 1817–1828. [DOI] [PMC free article] [PubMed] [Google Scholar]
- McKenna A, Hanna M, Banks E, Sivachenko A, Cibulskis K, Kernytsky A, Garimella K, Altshuler D, Gabriel S, Daly M, et al. 2010. The Genome Analysis Toolkit: a MapReduce framework for analyzing next-generation DNA sequencing data. Genome Res 20: 1297–1303. [DOI] [PMC free article] [PubMed] [Google Scholar]
- Muller HJ. 1940. Bearing of the Drosophila work on systematics. In The new systematics (ed. Huxley J). Clarendon Press, Oxford, UK. [Google Scholar]
- Nachman MW. 2002. Variation in recombination rate across the genome: evidence and implications. Curr Opin Genet Dev 12: 657–663. [DOI] [PubMed] [Google Scholar]
- Nachman MW, Payseur BA. 2012. Recombination rate variation and speciation: theoretical predictions and empirical results from rabbits and mice. Philos Trans R Soc Lond B Biol Sci 367: 409–421. [DOI] [PMC free article] [PubMed] [Google Scholar]
- Nadachowska-Brzyska K, Burri R, Olason PI, Kawakami T, Smeds L, Ellegren H. 2013. Demographic divergence history of pied flycatcher and collared flycatcher inferred from whole-genome re-sequencing data. PLoS Genet 9: e1003942. [DOI] [PMC free article] [PubMed] [Google Scholar]
- Nadeau NJ, Whibley A, Jones RT, Davey JW, Dasmahapatra KK, Baxter SW, Quail MA, Joron M, ffrench-Constant RH, Blaxter ML, et al. 2012. Genomic islands of divergence in hybridizing Heliconius butterflies identified by large-scale targeted sequencing. Philos Trans R Soc Lond B Biol Sci 367: 343–353. [DOI] [PMC free article] [PubMed] [Google Scholar]
- Nater A, Burri R, Kawakami T, Smeds L, Ellegren H. 2015. Resolving evolutionary relationships in closely related species with whole-genome sequencing data. Syst Biol 10.1093/sysbio/syv045. [DOI] [PMC free article] [PubMed] [Google Scholar]
- Nielsen R, Korneliussen T, Albrechtsen A, Li Y, Wang J. 2012. SNP calling, genotype calling, and sample allele frequency estimation from New-Generation Sequencing data. PLoS One 7: e37558. [DOI] [PMC free article] [PubMed] [Google Scholar]
- Noor MA, Bennett SM. 2009. Islands of speciation or mirages in the desert? Examining the role of restricted recombination in maintaining species. Heredity 103: 439–444. [DOI] [PMC free article] [PubMed] [Google Scholar]
- Nosil P. 2008. Speciation with gene flow could be common. Mol Ecol 17: 2103–2106. [DOI] [PubMed] [Google Scholar]
- Nosil P, Egan SP, Funk DJ. 2008. Heterogeneous genomic differentiation between walking-stick ecotypes: “isolation by adaptation” and multiple roles for divergent selection. Evolution 62: 316–336. [DOI] [PubMed] [Google Scholar]
- Patterson NJ, Moorjani P, Luo Y, Mallick S, Rohland N, Zhan Y, Genschoreck T, Webster T, Reich D. 2012. Ancient admixture in human history. Genetics 192: 1065–1093. [DOI] [PMC free article] [PubMed] [Google Scholar]
- Pennisi E. 2014. Disputed islands. Science 345: 611–613. [DOI] [PubMed] [Google Scholar]
- Price AL, Jones NC, Pevzner PA. 2005. De novo identification of repeat families in large genomes. Bioinformatics 21: i351–i358. [DOI] [PubMed] [Google Scholar]
- Reich D, Thangaraj K, Patterson N, Price AL, Singh L. 2009. Reconstructing Indian population history. Nature 461: 489–494. [DOI] [PMC free article] [PubMed] [Google Scholar]
- Renaut S, Grassa CJ, Yeaman S, Moyers BT, Lai Z, Kane NC, Bowers JE, Burke JM, Rieseberg LH. 2013. Genomic islands of divergence are not affected by geography of speciation in sunflowers. Nat Commun 4: 1827. [DOI] [PubMed] [Google Scholar]
- Renaut S, Owens GL, Rieseberg LH. 2014. Shared selective pressure and local genomic landscape lead to repeatable patterns of genomic divergence in sunflowers. Mol Ecol 23: 311–324. [DOI] [PubMed] [Google Scholar]
- Roesti M, Hendry AP, Salzburger W, Berner D. 2012. Genome divergence during evolutionary diversification as revealed in replicate lake–stream stickleback population pairs. Mol Ecol 21: 2852–2862. [DOI] [PubMed] [Google Scholar]
- Sætre GP, Sæther SA. 2010. Ecology and genetics of speciation in Ficedula flycatchers. Mol Ecol 19: 1091–1106. [DOI] [PubMed] [Google Scholar]
- Sætre GP, Král K, Bures S, Ims RA. 1999. Dynamics of a clinal hybrid zone and a comparison with island hybrid zones of flycatchers (Ficedula hypoleuca and F. albicollis). J Zool 247: 53–64. [Google Scholar]
- Scheet P, Stephens M. 2006. A fast and flexible statistical model for large-scale population genotype data: applications to inferring missing genotypes and haplotypic phase. Am J Hum Genet 78: 1611–1618. [DOI] [PMC free article] [PubMed] [Google Scholar]
- Seehausen O, Butlin RK, Keller I, Wagner CE, Boughman JW, Hohenlohe PA, Peichel CL, Sætre GP, Bank C, Brannstrom A, et al. 2014. Genomics and the origin of species. Nat Rev Genet 15: 176–192. [DOI] [PubMed] [Google Scholar]
- Sella G, Petrov DA, Przeworski M, Andolfatto P. 2009. Pervasive natural selection in the Drosophila genome? PLoS Genet 5: e1000495. [DOI] [PMC free article] [PubMed] [Google Scholar]
- Serrentino ME, Borde V. 2012. The spatial regulation of meiotic recombination hotspots: Are all DSB hotspots crossover hotspots? Exp Cell Res 318: 1347–1352. [DOI] [PubMed] [Google Scholar]
- Shaw KL, Mullen SP. 2014. Speciation continuum. J Hered 105: 741–742. [DOI] [PubMed] [Google Scholar]
- Shriver M, Kennedy G, Parra E, Lawson H, Sonpar V, Huang J, Akey J, Jones K. 2004. The genomic distribution of population substructure in four populations using 8,525 autosomal SNPs. Human Genomics 1: 274–286. [DOI] [PMC free article] [PubMed] [Google Scholar]
- Soria-Carrasco V, Gompert Z, Comeault AA, Farkas TE, Parchman TL, Johnston JS, Buerkle CA, Feder JL, Bast J, Schwander T, et al. 2014. Stick insect genomes reveal natural selection's role in parallel speciation. Science 344: 738–742. [DOI] [PubMed] [Google Scholar]
- Stajich JE, Block D, Boulez K, Brenner SE, Chervitz SA, Dagdigian C, Fuellen G, Gilbert JGR, Korf I, Lapp H, et al. 2002. The BioPerl Toolkit: Perl modules for the life sciences. Genome Res 12: 1611–1618. [DOI] [PMC free article] [PubMed] [Google Scholar]
- Stamatakis A. 2014. RAxML version 8: a tool for phylogenetic analysis and post-analysis of large phylogenies. Bioinformatics 30: 1312–1313. [DOI] [PMC free article] [PubMed] [Google Scholar]
- Tegelström H, Gelter HP. 1990. Haldane rule and sex biased gene flow between two hybridizing flycatcher species (Ficedula albicollis and F. hypoleuca, Aves, Muscicapidae). Evolution 44: 2012–2021. [DOI] [PubMed] [Google Scholar]
- Turner TL, Hahn MW. 2010. Genomic islands of speciation or genomic islands and speciation? Mol Ecol 19: 848–850. [DOI] [PubMed] [Google Scholar]
- Turner TL, Hahn MW, Nuzhdin SV. 2005. Genomic islands of speciation in Anopheles gambiae. PLoS Biol 3: e285. [DOI] [PMC free article] [PubMed] [Google Scholar]
- Via S, West J. 2008. The genetic mosaic suggests a new role for hitchhiking in ecological speciation. Mol Ecol 17: 4334–4345. [DOI] [PubMed] [Google Scholar]
- Weir BS, Cockerham CC. 1984. Estimating F-statistics for the analysis of population structure. Evolution 38: 1358–1370. [DOI] [PubMed] [Google Scholar]
- White BJ, Cheng CD, Simard F, Costantini C, Besansky NJ. 2010. Genetic association of physically unlinked islands of genomic divergence in incipient species of Anopheles gambiae. Mol Ecol 19: 925–939. [DOI] [PMC free article] [PubMed] [Google Scholar]
- Wiley C, Qvarnström A, Andersson G, Borge T, Sætre GP. 2009. Postzygotic isolation over multiple generations of hybrid descendants in a natural hybrid zone: How well do single-generation estimates reflect reproductive isolation? Evolution 63: 1731–1739. [DOI] [PubMed] [Google Scholar]
- Yang RC. 1998. Estimating hierarchical F-statistics. Evolution 52: 950–956. [DOI] [PubMed] [Google Scholar]
- Yi X, Liang Y, Huerta-Sanchez E, Jin X, Cuo ZX, Pool JE, Xu X, Jiang H, Vinckenbosch N, Korneliussen TS, et al. 2010. Sequencing of 50 human exomes reveals adaptation to high altitude. Science 329: 75–78. [DOI] [PMC free article] [PubMed] [Google Scholar]
- Youds JL, Boulton SJ. 2011. The choice in meiosis—defining the factors that influence crossover or non-crossover formation. J Cell Sci 124: 501–513. [DOI] [PubMed] [Google Scholar]
Associated Data
This section collects any data citations, data availability statements, or supplementary materials included in this article.