

Costello et al. demonstrate that Smad4/Eomes-dependent Lhx1 expression in the epiblast marks the entire definitive endoderm lineage, the anterior mesendoderm, and midline progenitors. In proteomic experiments, they characterize a complex comprised of Lhx1, Otx2, and Foxa2 as well as the chromatin-looping protein Ldb1.
Keywords: Lhx1, definitive endoderm, mesendoderm, midline, node, Ldb1
Abstract
Gene regulatory networks controlling functional activities of spatially and temporally distinct endodermal cell populations in the early mouse embryo remain ill defined. The T-box transcription factor Eomes, acting downstream from Nodal/Smad signals, directly activates the LIM domain homeobox transcription factor Lhx1 in the visceral endoderm. Here we demonstrate Smad4/Eomes-dependent Lhx1 expression in the epiblast marks the entire definitive endoderm lineage, the anterior mesendoderm, and midline progenitors. Conditional inactivation of Lhx1 disrupts anterior definitive endoderm development and impedes node and midline morphogenesis in part due to severe disturbances in visceral endoderm displacement. Transcriptional profiling and ChIP-seq (chromatin immunoprecipitation [ChIP] followed by high-throughput sequencing) experiments identified Lhx1 target genes, including numerous anterior definitive endoderm markers and components of the Wnt signaling pathway. Interestingly, Lhx1-binding sites were enriched at enhancers, including the Nodal-proximal epiblast enhancer element and enhancer regions controlling Otx2 and Foxa2 expression. Moreover, in proteomic experiments, we characterized a complex comprised of Lhx1, Otx2, and Foxa2 as well as the chromatin-looping protein Ldb1. These partnerships cooperatively regulate development of the anterior mesendoderm, node, and midline cell populations responsible for establishment of the left–right body axis and head formation.
Shortly after implantation, Nodal and Wnt signaling pathways coordinately instruct the symmetrical cup-shaped epiblast, the founder tissue of the embryo proper, to become appropriately patterned and give rise to the three primary germ layers: the ectoderm, endoderm, and mesoderm (Tam and Loebel 2007; Arnold and Robertson 2009). The anterior–posterior axis first becomes evident at the onset of gastrulation, when cells on the prospective posterior side of the epiblast undergo an epithelial-to-mesenchymal transition to form nascent mesoderm in the primitive streak (PS). Nodal and Wnt antagonists expressed in the anterior visceral endoderm (AVE) ensure that the anterior epiblast gives rise to neuroectoderm progenitors (Arnold and Robertson 2009; Fossat et al. 2012). The definitive endoderm (DE) progenitors, ingressing through the anterior PS (APS), initially intermingle with mesoderm, subsequently become polarized, and emerge onto the outer surface of the embryo, dispersing the visceral endoderm (VE) cells (Kwon et al. 2008; Viotti et al. 2014). Extension of the PS toward the distal tip of the epiblast leads to the formation of the anterior mesendoderm (AME), a specialized subset of cells that condense at the midline and displace the overlying VE (Yamanaka et al. 2007). A few hours later, a transient and architecturally distinct structure, the node, arises from the APS progenitors. By a process of convergent extension, the node gives rise to the notochord, which, together with the AME, forms a continuous midline cell population (Yamanaka et al. 2007), the source of key growth factor signals necessary to promote growth and patterning of the overlying neuroectoderm. Asymmetric Nodal signaling from the node specifies the left–right (L–R) body axis (Collignon et al. 1996), whereas the specialized midline cell population provides an essential barrier function to confine Nodal signaling to the left side of the embryo (Lee and Anderson 2008).
The T-box transcription factor (TF) Eomesodermin (Eomes) has been identified as a key regulator acting downstream from dose-dependent Nodal/Smad signals (Arnold et al. 2008). During gastrulation, Eomes controls allocation of cardiovascular and DE progenitors in the PS (Costello et al. 2011; Teo et al. 2011). Additionally, Eomes is required at earlier stages for specification and maintenance of the AVE (Nowotschin et al. 2013). Recent experiments demonstrate in the VE that Eomes directly activates the homeobox LIM domain TF Lhx1 (Lim1) (Nowotschin et al. 2013). Lhx1 is also transiently expressed in nascent mesoderm (Barnes et al. 1994; Shawlot and Behringer 1995; Perea-Gomez et al. 1999). Loss-of-function Lhx1 mutant embryos display a severe block to gastrulation, characterized by constriction of the VE at the extraembryonic ectoderm/epiblast boundary that acutely disrupts morphogenetic cell movements (Shawlot and Behringer 1995). Decreasing Lhx1 expression in the epiblast causes defective AME formation and consequently leads to anterior truncations (Shawlot et al. 1999; Fossat et al. 2015).
Here we demonstrate that Nodal/Smad signals activate Eomes-dependent Lhx1 expression in the epiblast. As for the Eomes+ cell population (Costello et al. 2011), Lhx1+ progenitors exclusively colonize the head and cardiac mesoderm and the entire gut endoderm as well as APS derivatives, including the AME, node, and notochord. Consistent with previous studies (Fossat et al. 2015), we found here that conditional deletion from the epiblast does not perturb early mesoderm induction. However, high-resolution imaging revealed striking defects in anterior DE (ADE) emergence and dispersal of the VE population. Additionally, we demonstrated that epiblast-specific deletion profoundly disturbs node morphogenesis as well as formation of the embryonic anterior midline population.
To learn more about Lhx1 functional contributions, we performed transcriptional profiling experiments. We identified Lhx1 targets, including numerous AME and DE marker genes, as well as components of the Wnt signaling pathway required for correct head patterning (Arkell et al. 2013). To gain further mechanistic insights, we also carried out a proteomic screen in stably transfected P19CL6 cells expressing epitope-tagged Lhx1 constructs. These results demonstrate Lhx1 interacts with its well-described binding partners, Ldb1 and Ssbp3 (Agulnick et al. 1996; Nishioka et al. 2005; Enkhmandakh et al. 2006). Additionally, we characterized a tripartite TF complex comprised of Lhx1, the forkhead family member Foxa2 (Hnf3β), and the paired-like homeobox protein Otx2. Finally, genome-wide chromatin immunoprecipitation (ChIP) followed by high-throughput sequencing (ChIP-seq) experiments demonstrate Lhx1 occupancy primarily at putative enhancer elements. Strikingly, Lhx1 binds to enhancer regions at both Otx2 and Foxa2. Collectively, these findings strongly argue that Lhx1 functions together with its transcriptional partners, Otx2 and Foxa2, to coordinately regulate AME, node, and midline development.
Results
Lhx1 expressed downstream from Smad/Eomes marks the DE lineage and midline progenitors
Beginning at embryonic day 6.5 (E6.5), Lhx1 is expressed throughout the VE overlying the epiblast (Fig. 1A) and a small number of mesoderm cells at the proximal rim of the posterior epiblast. A few hours later, Lhx1 is detectable in mesoderm, ingressing along the length of the PS as well as in the distal tip cells and the anterior midline mesendoderm (Fig. 1B). Subsequent to node formation, the ciliated ventral cells of the notochordal plate express high levels of Lhx1 (Fig. 1C). At the early headfold (EHF) stage, robust Lhx1 expression becomes confined to the node and midline, with lower levels detectable in the cranial and cardiac mesoderm (Fig. 1D).
Figure 1.

Smad/Eomes functional activities are required for Lhx1 expression in the epiblast. (A) Confocal microscopy reveals Lhx1 expression (green) at the onset of gastrulation in nascent mesoderm, emerging at the tip of the PS (asterisk) and the overlying VE and AVE (arrowhead). (B) Slightly later, at E7.5, Lhx1 expression marks nascent mesoderm, emerging along the PS and APS progenitors at the distal tip. (C) Arl13b-positive (red) ciliated cells localized within the ventral notochordal plate strongly express Lhx1. (D) Three-dimensional (3D) images at EHF stages reveal the highest levels of Lhx1 expression (red) within the midline mesoderm and node. (E) Eomes mutant (EomesΔEpi) embryos selectively lack epiblast expression (red), but Lhx1 expression is retained in the overlying VE. (F,G) Transient expression is lost in the early mesoderm and midline of EomesΔEpi (F) and Smad4Δepi (G) mutant embryos, but Lhx1 expression is retained in the genetically wild-type AVE. (H) Two-dimensional (2D) and 3D imaging of E8.5 Lhx1iCre:ROSA26RYFP reporter embryos reveals that Lhx1+ progenitors selectively give rise to the cranial mesoderm (arrow), heart mesoderm (arrowhead), and midline and DE progenitors (asterisk).
Recent experiments demonstrated that the T-box TF Eomes directly activates Lhx1 expression in the VE (Nowotschin et al. 2013). To test whether Eomes also acts upstream of Lhx1 in the epiblast, we examined Lhx1 expression in embryos carrying an epiblast-specific Eomes deletion (EomesΔEpi) (Arnold et al. 2008). The genetically wild-type VE retains Lhx1 expression. However, conditional inactivation of Eomes eliminates Lhx1 expression throughout the epiblast (Fig. 1E,F). Smad4 function in the epiblast is known to be essential for specification of the APS, midline, and DE (Chu et al. 2004). Smad4 conditional inactivation in the epiblast similarly results in failure to activate Lhx1 expression in the epiblast (Fig. 1G).
Next, to trace the fate of Lhx1+ cells, we engineered a dual-purpose Lhx1iCreIRESLacZ reporter allele carrying LacZ and Cre expression cassettes introduced under the control of endogenous Lhx1 regulatory elements (Supplemental Fig. S1). The LacZ reporter is transiently expressed at E6.5 in the AVE and nascent mesoderm and slightly later in the ventral node, AME, and midline. At early somite stages, a second domain of Lhx1.LacZ expression was detectable in the lateral nephrogenic mesoderm. To further characterize Lhx1+ derivatives, Lhx1iCreIRESLacZ/+ males were mated to females carrying either the Rosa26RLacZ or Rosa26RYFP reporter allele (Soriano 1999; Srinivas et al. 2001). As for Eomes+ epiblast cells (Costello et al. 2011), we also found that Lhx1+ LacZ progeny give rise to the head mesenchyme, heart, gut endoderm, node, and notochord (Supplemental Fig. S1H–J). To globally visualize YFP+ Lhx1 descendants, we used confocal microscopy and three-dimensional (3D) rendering software (Fig. 1H). Transient Lhx1 expression labels the entire DE lineage. The rostro–caudal axis of the forming gut tube, from the most anterior foregut pocket to the hindgut diverticulum, is exclusively derived from Lhx1+ progenitors (Fig. 1H; Supplemental Fig. S1H–J).
Conditional loss of Lhx1 disrupts ADE and AME development
Partial loss (∼70%) of Lhx1 from the epiblast causes abnormalities in anterior patterning associated with Wnt signaling defects (Tanaka et al. 2010; Fossat et al. 2015). To completely eliminate Lhx1 function in the epiblast, we exploited the Sox2Cre deleter strain (Hayashi et al. 2002) together with a novel Lhx1 conditional allele generated using a EUCOMM (European Conditional Mouse Mutagenesis Program) resource targeting vector (Supplemental Fig. S2). The resulting Lhx1Δ/−:Sox2CreTg/+ (hereafter referred to as Lhx1ΔEpi) mutant embryos (Supplemental Fig. S2F) appear morphologically normal at early stages but, by E9.5, display marked cardiac defects, including abnormal looping, expanded pericardium and cardia bifida, and a marked reduction of anterior endoderm and neural tissue (Supplemental Fig. S2G–I). By E10.5, all Lhx1ΔEpi mutants are growth-retarded and necrotic (Supplemental Fig. S2J).
We observed in Lhx1ΔEpi mutants that expression of the ADE markers Hhex and Hesx1 mRNA is severely compromised (Fig. 2A,B). Foxa2 is normally expressed in the anterior midline mesendoderm, the developing node, and their derivatives (Fig. 2C; Sasaki and Hogan 1993). Lhx1ΔEpi mutants display markedly reduced Foxa2 expression in the AME and emerging midline. By somite stages, Lhx1ΔEpi embryos lack Foxa2 expression in the anterior midline underlying the forebrain/midbrain (Fig. 2C). However, node progenitors at the tip of the PS at E7.75 retain robust Foxa2 expression (Fig. 2C). The Nodal/Bmp/Wnt antagonist Cer1, transiently expressed in the nascent DE emerging onto the surface of the embryo, is correctly induced in Lhx1ΔEpi mutant embryos, but, as assessed by whole-mount in situ hybridization (WISH) and confocal imaging of immunofluorescence data, the number of Cer1+ cells is significantly reduced (Fig. 2D,E). Afp expression transiently labels the VE overlying the epiblast, whereas the DE that emerges onto the surface epithelium lacks Afp expression. Importantly, as judged by WISH analysis, patchy Afp expression is retained in Lhx1ΔEpi mutants (Supplemental Fig. S3A), indicative of a disturbance in DE intercalation or delay of Afp down-regulation.
Figure 2.

Conditional Lhx1 inactivation in the epiblast disrupts ADE specification and VE dispersal. (A,B) Expression of the ADE markers Hhex (A) and Hesx1 (B) is barely detectable in Lhx1ΔEpi embryos. (C) Development of Foxa2-positive midline cells is severely compromised at both E7.75 and E8.5. (D,E) Cer1 mRNA (D) and protein (E) expression levels are markedly reduced in Lhx1 mutant embryos. (E) Confocal imaging shows significantly fewer Cer1-positive (red) DE progenitors present on the ventral surface. (F) Confocal imaging of Afp:GFP (green) transgene expression and Sox17 (red) staining reveals dramatically reduced Sox17high DE emergence and excessive representation of GFP+ VE cells at the distal tip of Lhx1ΔEpi embryos.
To further investigate Lhx1’s contributions to DE emergence, we exploited the well-characterized Afp:GFP transgenic reporter strain (Kwon et al. 2008) in combination with the pan-endodermal marker Sox17. Prior to E7.75, Sox17 is weakly expressed in the VE, whereas emerging epiblast-derived DE cells robustly express Sox17 (Sox17high). At late bud (LB)-EHF stages in wild-type embryos, the lateral posterior surface is comprised predominantly of Sox17high DE cells, corresponding to the earliest ADE progenitors exiting the PS (Fig. 2F). In contrast, in Lhx1ΔEpi mutants, the representation of Sox17highGFP− DE cells is greatly diminished, and a substantial proportion of the lateral surface remains covered by Sox17lowGFP+ VE cells (Fig. 2F). Thus, we conclude that Lhx1 is essential for specification of the initial population of APS progenitors giving rise to the AME and for efficient intercalation of the DE cell population into the overlying VE layer.
Lhx1 plays a crucial role during midline and node morphogenesis
Sonic hedgehog (Shh) expressed in the anterior midline mesendoderm and posterior notochord precursors initiates dorsal–ventral patterning of the overlying neural plate (Chiang et al. 1996). In Lhx1ΔEpi embryos, early Shh expression is absent (Fig. 3A). By E7.75, expression along the anterior midline is discontinuous, and by E8.5, the anterior Shh domain that normally underlies the ventral forebrain is completely absent (Fig. 3A). Additionally, we observed patchy Brachyury expression in the anterior midline (Fig. 3B,C). Foxa2 expression in the emerging midline is also perturbed (Fig. 3D). Displacement of the overlying VE, an essential feature of midline development that normally allows the column of midline cells to emerge onto the ventral surface (Kwon et al. 2008; Viotti et al. 2012), is also severely compromised. Consistent with results above, when we evaluated Sox17 and Afp:GFP transgene expression in Lhx1ΔEpi mutant embryos, we observed that scattered Sox17+ and GFP+ VE cells partially conceal the compromised Foxa2+/Brachyury+ midline population (Fig. 3D,E).
Figure 3.

Lhx1 function is essential for midline morphogenesis. (A) Shh expression is absent at E7.5 in the node progenitors and subsequently, at E7.75, becomes discontinuous and fails to extend anteriorly. By E8.5, the anterior midline is severely disturbed. (B) At EHF stages, Brachyury is normally expressed in the PS, node (asterisk), and anterior midline, whereas, in Lhx1ΔEpi embryos, midline expression is patchy. The observed speckles are background staining. (C) Frontal view at slightly later stages (four- to five-somite stage) reveals discontinuous Brachyury staining in Lhx1ΔEpi mutants. (D) Sox17 (red) and Foxa2 (green) double staining of the emerging midline. In Lhx1ΔEpi embryos, midline Foxa2 staining is reduced, and the Sox17+ endoderm obscures the midline. (E) Analysis of Afp:GFP reporter expression in Lhx1ΔEpi embryos reveals defective node and midline development. The endoderm-obstructing node and midline emergence is GFP+ VE.
At the LB to EHF stages, the emerging node is normally exposed on the outer surface of the embryo. In contrast, a high proportion of Lhx1ΔEpi mutant embryos display a noticeable morphological thickening at the distal tip. Moreover, a continuous layer of Sox17+ endoderm cells conceals the ventral node (Fig. 4A,B). Scanning electron microscopy (SEM) confirmed in wild-type embryos, prior to the emergence of the node, an uninterrupted layer of endoderm (Fig. 4C), whereas Lhx1ΔEpi mutants are characterized by a local out-pocketing of cells on the surface of the distal tip (Fig. 4C). Slightly later, at EHF stages, when the patent bilayered node (consisting of ciliated cells on the ventral surface) normally becomes visible (Fig. 4D), we observed in Lhx1ΔEpi embryos that GFP+ VE cells obscure the posterior aspect of the node (Figs. 3E, 4D).
Figure 4.
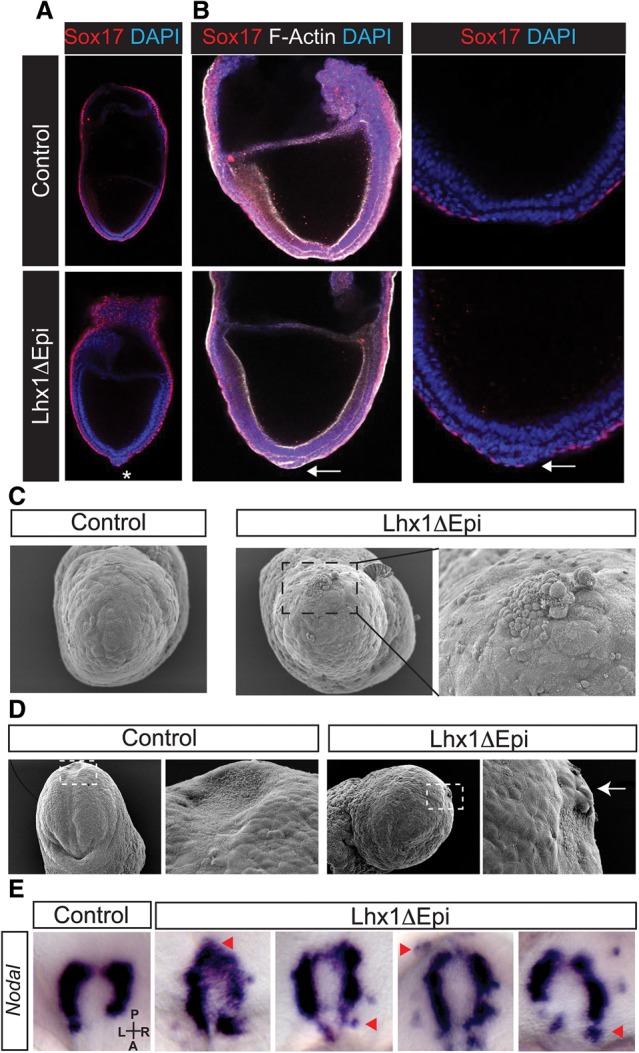
Lhx1 is required for node emergence and asymmetric Nodal expression. (A) The node is normally exposed at the distal tip of the embryo at LB stages. As judged by DAPI staining (blue), in Lhx1ΔEpi mutants, the node has condensed to form a bilayer structure but is obscured by Sox17+ endoderm (asterisk). (B) Slightly later, F-Actin staining (white) and DAPI nuclear staining (blue) demonstrate that the bilayered node has emerged. In contrast, in Lhx1ΔEpi-null embryos, the presumptive node remains encapsulated by Sox17+ endoderm cells (arrow). (C) SEM demonstrates a monolayer of endoderm overlying the distal tip, whereas, in contrast, cells accumulate on the surface of Lhx1ΔEpi embryos. (D) At EHF stages, the node is conspicuously visible as a concave, teardrop-shaped structure composed of monociliated cells. In contrast, in Lhx1Δepi embryos, squamous endoderm-like cells cover the posterior end of the node (arrow). (E) Unlike asymmetric left-sided Nodal expression in wild-type embryos, Lhx1ΔEpi embryos display bilateral, right-sided, and ectopic Nodal expression at the node (examples shown by arrowheads).
At early somite stages, asymmetric Nodal expression in the node selectively promotes its own induction in left lateral plate mesoderm (LPM) via an autoregulatory feed-forward loop that establishes the L–R body axis (Adachi et al. 1999; Norris and Robertson 1999). In Lhx1ΔEpi mutants, Nodal is ectopically expressed around the posterior end of the node and beyond its normal boundary (n = 5/5) (Fig. 4E). A similar ectopic expression is seen in Sox17 mutants (Viotti et al. 2012). Despite robust expression in the node, asymmetric Nodal expression is disturbed and fails to be induced in the LPM of mutant embryos (n = 5/5). Considering that the DE plays an essential role in relaying signaling cues from the node to the LPM (Viotti et al. 2012), failure to activate Nodal in the LPM is probably caused by defective DE emergence.
Transcriptional profiling identifies Lhx1 downstream target genes
To further characterize Lhx1 functional contributions, we tested the ability of wild-type and Lhx1-null embryonic stem (ES) cells to differentiate toward APS fates in the presence of high doses of ActivinA (Morrison et al. 2008; Costello et al. 2011). As expected, mesodermal markers were efficiently induced (Supplemental Fig. 3B). The APS and DE markers Gsc and Cxcr4 were also robustly expressed. In contrast, in the absence of Lhx1, expression of Foxa2, Sox17, and Cer1 was significantly reduced (Fig. 5A). The ADE markers Hhex and Hesx1 were barely detectable (Fig. 5A; Supplemental Fig. S3B). Interestingly, expression of Embigin, previously identified as a potential Lhx1 target in the AME (Shimono and Behringer 1999), and Trh, another DE marker (McKnight et al. 2007), are both dramatically reduced.
Figure 5.

Transcriptional profiling experiments identify candidate Lhx1 targets. (A) Quantitative RT–PCR (qRT–PCR) analysis of endoderm and midline markers in day 6 ActivinA-treated embryoid bodies. (Blue bars) Wild-type samples (n = 4); (red bars) Lhx1-null samples (n = 4). Statistical analysis was performed using the Prism6 statistic package and the Student's t-test. Statistical significance, P < 0.05. The analysis is displayed as floating bars (minimum to maximum) with a line at the median. (B) Summary of genes misregulated at both day 5 and day 6 time points during embryoid body differentiation. The heat map indicates reduced (green) or increased (red) transcripts at day 5 as well as the average fold change at both day 5 and day 6. (C) Gene ontology (GO) of biological annotation identified high enrichment scores for the categories indicated. (D) qRT–PCR confirmed decreased expression of Fzd5, Fzd8, Shisa2, Sfrp1, and Tcf7l2, but Dkk1 expression was not significantly (n.s.) altered at day 6. (Blue bars) Wild-type samples (n = 4); (red bars) Lhx1-null samples (n = 4). Statistical significance, P < 0.05. (E) WISH analysis shows markedly decreased Fzd5 and Shisa2 expression in the anterior midline.
Next, we performed transcriptional profiling experiments. We identified 52 and 372 misregulated Ensembl annotated transcripts at day 5 and day 6, respectively (Illumina Diff Score >13, equivalent to P < 0.05) (Supplemental File 1). Of these, we focused on 25 transcripts misregulated at both time points: 22 down-regulated and three up-regulated (Fig. 5B). Functional annotation (gene ontology [GO]) clustering analysis of all misregulated genes with DAVID demonstrated high enrichment scores for development, endoderm, Wnt signaling, morphogenesis, and migration categories (Fig. 5C).
Consistent with the results above, DE and AME marker genes (namely, Hhex, Sox17, Otx2, and Foxa2) were markedly reduced. Additionally, several novel candidate Lhx1 target genes were identified: Pkdcc overlaps with Lhx1 expression in the AVE, ADE, and AME (Imuta et al. 2009); Calca is coexpressed in the AME and node (Tamplin et al. 2011); and Cyb561 is coexpressed in the node (Tamplin et al. 2008). Additionally, 4933427D14Rik, Sema6d, Kdm5b, Pdpn, and Ovol2 were coexpressed with Lhx1 at the late streak (LS) to EHF stages (Supplemental Fig. S4B). Interestingly, Shh, Col2a1, Epb4.1l5, and Shroom3—genes previously shown to be required for proper midline, node, and neural morphogenesis (Chiang et al. 1996; Hildebrand and Soriano 1999; Lee et al. 2010; Leung et al. 2010)—were markedly down-regulated at day 6 of differentiation (−4.5-fold, −3.6-fold, −2.5-fold, and −2.1-fold, respectively) (Supplemental File 1). Overall, transcriptional profiling experiments confirm and extend the list of ADE, AME, and midline marker genes dependent on Lhx1 expression.
Wnt signaling plays an essential role in patterning the anterior neuroectoderm (Arkell et al. 2013). GO analysis revealed that Wnt pathway components are significantly misregulated in Lhx1-null DE cultures (Fig. 5C). The Wnt receptors Fzd5 and Fzd8, the Wnt antagonists Shisa2 and Sfrp1, and the Wnt effector Tcf7l2 are all significantly down-regulated (Fig. 5D; Supplemental Fig. S4C). A proposed Wnt target gene, Apcdd1 (Takahashi et al. 2002), is up-regulated (Supplemental Fig. S4C). However, expression of Wnt3, B-catenin, Frzb, and Sfrp2 as well Dkk1, an important Wnt antagonist essential for anterior patterning (Mukhopadhyay et al. 2001), was unaffected (Fig. 5D; Supplemental Fig. S4C). WISH experiments confirmed in Lhx1ΔEpi mutant embryos that expression of Fzd5 and Shisa2 is dramatically reduced (Fig. 5E). Therefore, Lhx1 modulates Wnt signaling by regulating the expression of multiple pathway components.
Foxa2 and Otx2 interact with the core Lhx1 TF complex
DMSO-treated P19CL6 embryonal carcinoma cells transiently adopt a mesendodermal-like state, as judged by robust coexpression of Lhx1, Eomes, T, Foxa2, and Cxcr4 (Costello et al. 2011). To learn more about Lhx1 functional activities, we performed an unbiased proteomic screen using expression constructs containing full-length Lhx1 cDNA tagged with either an N-terminal (SF-Lhx1) or a C-terminal (Lhx1-SF) StrepFlag (SF) sequence (Fig. 6A). Additionally, to stimulate nuclear import in response to tamoxifen treatment, we added a C-terminal-ER sequence to the SF-Lhx1 N-terminal construct. Nuclear extracts from stably transfected differentiated (day 4) P19CL6 subclones were precipitated using StrepTactin resin and subjected to mass spectrometry (MS) analysis. A complete list of interacting proteins is presented in Supplemental File 2.
Figure 6.

Identification of Lhx1 interaction partners and candidate target genes. (A) Schematic representation of SF epitope-tagged expression constructs. (B) Summary of select Lhx1 protein partnerships identified by MS analysis. The percentage of coverage for each protein, the number of unique peptide sequences, and corresponding pull-down fractions are shown. (C) Western blot analysis of StrepTactin pull-down (St-PD) experiments. As a positive control, 5% of the input (Inp) sample was analyzed. Proteins, indicated at the right, were enriched in test pull-down fractions (SF-Lhx1 Nter and Lhx1-SF Cter). (D) Functional annotation analysis using GREAT reveals that Lhx1 preferentially binds to genes associated with development, differentiation, and morphogenesis processes; namely, embryonic (yellow highlight), neural (pink), renal (green), and limb (blue) Lhx1-expressing tissues. (E) De novo motif analysis (Weeder) reveals an enrichment of a TAAT-containing sequence underlying Lhx1 peaks. (F) The distance from the nearest transcription start site (TSS) for each ChIP-seq peak and the number of peaks within each grouping are indicated. (G) Lhx1 ChIP-seq peaks were compared with previously reported histone modification profiles in mouse ES cells. (H) University of California at Santa Cruz (UCSC) track view of ChIP (red) and input (blue) wiggle plot overlays showing enrichment of Lhx1 ChIP-seq density at Hesx1, Fzd8, Embigin, Nodal, Otx2, and Foxa2. Purple boxes indicate the positions of previously mapped Nodal enhancer elements. (RPM) Reads per million.
Lhx1 interacts with Ldb and Ssbp proteins to form an Lhx–Ldb–Ssbp core complex (Agulnick et al. 1996; Hobert and Westphal 2000; Nishioka et al. 2005; Enkhmandakh et al. 2006). The present experiments demonstrated in differentiating P19CL6 cells that Lhx1 binds to conserved components of the core complex (Fig. 6B; Supplemental File 2), including Ldb1 and Ldb2 as well as Ssbp2, Ssbp3 and Ssbp4. Interestingly, as for Lhx1, both Ldb1 and Ssbp3 mutant embryos similarly display anterior patterning defects (Mukhopadhyay et al. 2003; Nishioka et al. 2005; Enkhmandakh et al. 2006). These findings strongly suggest that Lhx1, Ldb1, and Ssbp3 cooperatively govern ADE specification and midline morphogenesis.
The homeobox TF Otx2 has been shown to bind Lhx1 and Foxa2 in vitro (Nakano et al. 2000). The present MS and Western blot analyses similarly demonstrate Lhx1 associations with Otx2 (Fig. 6B,C). Due to evidence for an interaction between Otx2 and Foxa2, we sought to identify whether Lhx1 could also interact with Foxa2. Lhx1–Foxa2 interactions were clearly detectable by StrepTactin pull-down and immunoblotting experiments (Fig. 6C). These results directly demonstrated for the first time in the context of mesendodermal cells a tripartite TF complex comprised of Lhx1, Foxa2, and Otx2.
The Notch signaling pathway plays an essential role in node morphogenesis (Przemeck et al. 2003; Raya et al. 2003). As for Lhx1ΔEpi mutants, embryos lacking Rbpj or the Notch ligand Delta-1 (Dll1) display a spectrum of node and midline defects (Oka et al. 1995; Przemeck et al. 2003; Raya et al. 2003). In Lhx1ΔEpi mutants, as in Dll1-null embryos, the ventral surface of the node remains covered with endoderm, preventing its emergence (Przemeck et al. 2003). We found that Rbpj, a downstream effector of the Notch signaling, was present in all three test fractions (Fig. 6B). Western blot analysis confirmed Rbpj associations with Lhx1 complexes (Fig. 6C), suggesting that Lhx1 acts together with Rbpj during node emergence and L–R axis patterning.
Lhx1 preferentially binds to putative enhancer elements governing target gene expression
To identify Lhx1 transcriptional targets genome-wide, we performed ChIP-seq experiments using differentiated P19CL6 cells stably transfected with the C-terminal cmER-tagged SF expression construct (Supplemental File 3). GREAT analysis revealed embryonic morphogenesis, anterior/posterior pattern specification, and morphogenesis of embryonic epithelium as terms associated with Lhx1-binding events (Fig. 6D). De novo motif finding identified the TAAT-containing sequence within the Lhx1 peak regions (Fig. 6E), confirming that Lhx1 binds to the previously described TAAT core motif recognized by several homeodomain TF family members (Berger et al. 2008).
Analysis of the genomic distribution of binding sites relative to the nearest transcription start site (TSS) revealed peak enrichments 5–500 kb on either side of and not immediately proximal to (<5 kb) the TSS, suggesting that Lhx1 may preferentially bind to enhancer regions (Fig. 6F). To evaluate this possibility, we compared Lhx1 ChIP-seq peaks with histone modification profiles reported for mouse ES cells (Fig. 6G). Interestingly, the majority of our Lhx1 peaks overlap with H3K4me1 peaks (Fig. 6G), known to be enriched at enhancer regions, and 26.1% of ChIP-peak regions overlap p300-bound regions in ES cells (Supplemental Fig. S5A). A smaller proportion of bound regions also display H3K27ac in ES cells, a marker of active enhancers, while only 8.7% of bound sites contain H3K4me3 modifications, associated with promoter regions (Fig. 6G).
Several putative Lhx1 target genes were represented in our ChIP data set. For example, Lhx1 binding was detected at two distinct regions at the Hesx1 locus, including a regulatory element in the 5′ untranslated region (containing two Lhx1-binding motifs) and a 3′ distal enhancer (Fig. 6H; Chou et al. 2006). Lhx1 ChIP peaks were also present upstream of Embigin exon 1 (Fig. 6H). Embigin, an IgG superfamily member normally expressed in the VE, ADE, and forebrain neuroepithelium (Shimono and Behringer 1999; Sousa-Nunes et al. 2003), is down-regulated in Lhx1-null embryos (Shimono and Behringer 1999) and, as reported here, differentiated DE cultures (Fig. 5A). Thus, Embigin represents a direct Lhx1 target. One of the strongest Lhx1 ChIP peaks lies upstream of the Fzd8 gene (Fig. 6H). Moreover, Fzd8 is down-regulated in Lhx1 mutant DE cultures (Fig. 5D). Additionally, Lhx1 peaks were also found associated with Sfrp1 and Tcf7l2 (Supplemental File 3). We conclude that Lhx1 directly regulates components of the Wnt pathway.
The node-specific Nodal enhancer (NDE) contains Rbpj-binding sites governing Notch-dependent Nodal expression (Raya et al. 2003). However, there was no evidence for Lhx1 occupancy within the NDE (Fig. 6H), and, as shown above, Nodal induction in the node is Lhx1-independent. Rather, we found Lhx1 enrichment at the Nodal proximal epiblast enhancer (PEE) element responsible for controlling Nodal expression levels in the PS (Norris and Robertson 1999; Vincent et al. 2003). Interestingly, as for Lhx1ΔEpi embryos, NodalΔPEE/− embryos display severe defects in the formation of the APS derivatives and develop anterior truncations (Vincent et al. 2003). Moreover, the Rbpj-binding motif TGGGAA (Castel et al. 2013) is present within the PEE sequence element (Supplemental Fig. S5B,C). These findings strongly argue that Lhx1/Rbpj interactions cooperatively fine-tune Nodal signaling in the PS to govern dose-dependent formation of APS progenitors.
Otx2 has been shown to bind 1.5 kb upstream of and 6.5 kb downstream from the Lhx1 TSS (Ip et al. 2014). Reciprocally, the present experiments identified prominent Lhx1 ChIP-seq peaks upstream of Otx2 within both the EP/AN1 (epiblast/anterior neuroectoderm1) and FM1 (forebrain/midbrain1) enhancer regions (Fig. 6H; Kurokawa et al. 2004a,b). Additionally, we detected Lhx1 binding 3′ to the Foxa2 gene at a site partially overlapping with the floor plate enhancer (Fig. 6H; Sasaki and Hogan 1996), suggesting that Lhx1 directly regulates expression of its transcriptional partners, Foxa2 and Otx2. This feed-forward regulatory loop in turn is required for AME and midline development.
Collectively, our results demonstrate Lhx1 interactions with Foxa2 and Otx2. Consistent with this, examination of previously published Otx2 and Foxa2 ChIP data sets (from ActivinA-treated EpiLCs or ES-derived DE cells, respectively) (Xu et al. 2012; Buecker et al. 2014) revealed overlapping binding sites (Supplemental Fig. S6). Of the high-confidence Lhx1 peaks, 114 (18.4%) were directly overlapping with the Foxa2 sites. These observations strengthen our proposed model in which the Lhx1/Foxa2/Otx2 TF complex cooperatively regulates the same genomic regions.
Discussion
It is well known that specification of APS derivatives requires highest levels of Nodal/Smad signaling (Vincent et al. 2003; Chu et al. 2004; Ben-Haim et al. 2006; Morsut et al. 2010). This instructive cue guides formation of midline, node, and DE progenitors, the key cell populations that promote growth and patterning of the neuroectoderm and establishment of the L–R body axis. The T-box TF Eomes acts downstream from Nodal to control allocation of mesodermal and DE progenitors in the APS (Arnold et al. 2008; Costello et al. 2011). The present experiments demonstrated that Eomes directly activates Lhx1 expression in the epiblast. Moreover, ChIP-seq analysis revealed Lhx1 enrichment at the Tcf/Lef-dependent Nodal-proximal epiblast enhancer. These findings strongly suggest that Lhx1 acts synergistically with the Wnt signaling pathway to sustain the positive feedback loop that amplifies Nodal signaling in the PS necessary to specify APS progenitors (Ben-Haim et al. 2006).
We demonstrated for the first time that Lhx1 plays a pivotal role in axial midline and node morphogenesis. Early EM and imaging studies provided descriptive insights into the timing and emergence of these architecturally distinct structures (Lee and Anderson 2008). Beginning at E7.5, the cells of the prospective ventral node as well as clusters of midline cells located more anteriorly coalesce, become columnar in shape, and gradually emerge on the embryos’ surface. Displacement of the overlying VE cells allows these columnar cells to expand and eventually occupy the entire midline ventral surface (Kwon et al. 2008). In Lhx1ΔEpi embryos, the genetically wild-type VE cells fail to displace appropriately and prevent the orderly emergence of the node and axial midline precursors.
Interestingly, our transcriptional profiling experiments identified several known regulators of cellular behavior—including Epb4.1l5, Shroom3, and Col2a1—that are markedly down-regulated. Loss of Epb4.1l5 disrupts apical–basal polarity and leads to a disordered F-Actin cytoskeletal network (Lee et al. 2007). Node precursors induced in Epb4.1l5 mutants fail to organize and displace the overlying VE, resulting in L–R axis defects (Lee et al. 2010). Epb4.1l5 is required for apical accumulation of another important cytoskeletal regulator, Shroom3 (Chu et al. 2013). Targeted loss of Shroom3 function causes neural tube defects (Hildebrand and Soriano 1999). Col2a1 encodes the extracellular matrix type II collagen proteins (procollagens IIA and IIB). Procollagen IIA mutants display decreased Shh expression in the midline and partially penetrant head truncation phenotypes (Leung et al. 2010). Our ChIP-seq analysis revealed proximal Lhx1 binding at the Shroom3 locus. Thus, Lhx1 may directly regulate cellular architecture.
The present results confirm and extend earlier work suggesting that Lhx1 modulates the strength of Wnt signaling in the midline to ensure correct anterior neuroectoderm patterning (Fossat et al. 2015). Our transcriptional profiling experiments demonstrated that expression of multiple Wnt signaling components depends on Lhx1 activity. Fzd5 (a Wnt receptor) and Shisa2 (a Wnt antagonist normally expressed in the AME) are significantly down-regulated. Importantly, ChIP-seq experiments identified several Wnt pathway genes—including Fzd8, Sfrp1, and Tcf7l2—as direct Lhx1 targets.
Recent evidence suggests that Otx2, coexpressed with Lhx1 in the AME, regulates Lhx1 expression levels (Ip et al. 2014). Likewise, Lhx1 and Foxa2 are coexpressed in APS progenitors, the node, and the midline. Foxa2-null embryos fail to form a node and lack axial mesoderm-derived structures (Ang and Rossant 1994). Foxa2 is critical for polarization of DE cells and epithelization of the midline structures (Burtscher and Lickert 2009). Conditional Lhx1 ablation selectively within the Foxa2 expression domain disrupts head development (Fossat et al. 2015). Our ChIP-seq experiments identified Lhx1-binding sites present at key enhancer regions controlling expression of Otx2 and Foxa2. Additionally, protein interaction experiments clearly demonstrated Lhx1 interactions with both Otx2 and Foxa2. Intriguingly, Lhx1, Otx2, and Foxa2 are also coexpressed in the embryonic VE at early post-implantation stages. All three loss-of-function alleles independently result in profound defects within the VE, causing a constriction at the interface of the proximal extraembryonic ectoderm and distal epiblast (Ang and Rossant 1994; Shawlot and Behringer 1995; Ang et al. 1996). Thus, the tripartite TF complex comprised of Lhx1/Foxa2/Otx2 probably activates common gene regulatory networks required in VE, DE, and AME lineages.
Additionally, we characterized for the first time a higher-order Lhx1/Ldb1/Ssbp3 complex assembled in mesendodermal cell cultures. Ssbp3 stabilizes the complex, regulating Lhx1 and Ldb1 steady-state levels (Gungor et al. 2007; Xu et al. 2007), thereby ensuring proper complex stoichiometry. Ldb1 mutant embryos arrest during early development and display severe patterning defects, including constriction at the extraembryonic/embryonic boundary and anterior truncations (Mukhopadhyay et al. 2003). Ldb1 has been described as a looping factor that mediates long-range promoter enhancer interactions (Deng et al. 2012; Krivega et al. 2014). During erythroid cell differentiation, Ldb1 complexes with lineage-restricted TFs Gata1, Tal1, and Klf1 to activate β-globin gene expression (Love et al. 2014). Recently, in cardiac progenitors, Ldb1 has been shown to complex with another homedomain TF, Isl1, to regulate Mef2c and Hand2 transcription (Caputo et al. 2015). The fact that defects caused by targeted disruption of the Lhx1 LIM domains (responsible for Ldb1 interaction) also phenocopy those seen in Lhx1-null embryos (Cheah et al. 2000) strongly argues that associations with Ldb1 are essential for Lhx1 function.
Distal enhancers are brought into close proximity with promoter regions to activate developmentally regulated target gene expression. Otx2 and Foxa2 are enriched at enhancers and promoters, depending on the cell context (Wederell et al. 2008; Bochkis et al. 2012; Xu et al. 2012; Buecker et al. 2014; Yang et al. 2014). The simplest possibility (depicted in Fig. 7) is that Lhx1, via its interactions with Otx2 and Foxa2, selectively recruits the Ldb1 chromatin-looping machinery to coordinately regulate transcriptional programs required for ADE, node, and midline development.
Figure 7.

Summary of Lhx1 functional roles. (A) At LB stages, DE cells (white) normally migrate onto the outer surface, dispersing the VE (green) cells. In Lhx1ΔEpi mutants, the overlying VE is not properly dispersed, leaving pockets enriched with VE-derived cells. (B) At the EHF stage, the midline and node have emerged to form a continuous layer with the endoderm. In Lhx1ΔEpi mutants, VE-derived cells remain overlying the midline and posterior node. (C) Hypothetical model showing Lhx1 DNA binding at enhancers together with Otx2 acting as a pioneer factor to recruit higher-order Lhx1–Ldb1–Ssbp3 complexes and promote Foxa2 binding to promoter regions and activate transcription of target genes.
Materials and methods
Animals and PCR genotyping
EomesCA/N;Sox2Cre (Arnold et al. 2008), ROSA26RLacZ (Soriano 1999), ROSA26RYFP (Srinivas et al. 2001), Lim1+/− (Shawlot and Behringer 1995), and AFP:GFPTG/+ (Kwon et al. 2006) strains were genotyped as described. A novel Lhx1CA allele was generated using the EUCOMM targeting vector (PGRS0002_B_E08) from the German Research Center for Environmental Health. AsiSI-linearized vector (15 µg) was electroporated into CCE ES cells, and neomycin-resistant colonies were screened by Southern blot analysis using the restriction enzyme and the probe combination shown in Supplemental Figure. S2. The offspring derived from two independent correctly targeted clones were crossed with FLPe mice (Farley et al. 2000) to remove the LacZ and Neo cassettes. The resulting Lhx1CA/CA strain was maintained on a mixed 129SvEv/C57BL/6 background. Lim1+/−;Sox2-CreTg/+ males were crossed with Lhx1CA/CA females to generate Lhx1Epiblast-deleted/− (Lhx1ΔEpi) embryos.
To generate the Lhx1iCre-LacZ reporter allele, a codon-optimized Cre-IRES-nlacZ followed by a FRT-flanked neo cassette (iCre-IRES-nlacZ-FRT-neo-FRT) (Mould et al. 2012) was introduced in-frame into exon 1. Correctly targeted clones were identified by Southern blot analysis (Supplemental Fig. S1) and transiently transfected with a FLP expression construct to remove the neo cassette. PCR genotyping primers for Lhx1CA/+ and LhxiCre mice are shown in Supplemental Table S1. All animal procedures were approved by the Ethical Review Committee of the University of Oxford and the Institutional Animal Care and Use Committee of Memorial Sloan Kettering.
ES cell culture
Wild-type control and Lhx1-null ES cell lines were derived from Lhx1Δ/+ intercross blastocysts in 2i/LIF medium: N2B27 medium (StemCells, Inc.) supplemented with 1 µM PD0325901, 3 µM CHIR99021, and LIF (Millipore). Established ES cell lines were maintained in DMEM (Invitrogen) with 15% FBS, 1% nonessential amino acids, 0.1 mM β-mercaptoethanol, and 1000 U/mL recombinant LIF (Millipore). To induce DE formation, ES cells were seeded at low density (5 × 10³ cells per milliliter) in the absence of LIF in bacteriological-grade plates, and 50 ng/mL ActivinA (R&D systems) and 20 ng/mL EGF (Peprotech) were added after 48 h in N2B27 medium (based on Morrison et al. 2008).
Immunofluorescence
Embryos were fixed in 4% paraformaldehyde for 30 min at room temperature; permeabilized with 0.5% Triton-X in PBS for 15 min; washed with 0.1% Triton-X in PBS; blocked in 5% donkey serum, 0.2% BSA, and 0.1% Triton-X in PBS for 1 h at room temperature; incubated with primary antibodies overnight at 4°C; washed in 0.1% Triton-X-PBS; incubated with fluorophore-conjugated secondary antibodies (AlexaFluor, Invitrogen); and counterstained with DAPI and/or Alex fluor 633 phalloidin (Invitrogen). The antibodies used are listed in Supplemental Table S2. Laser-scanning confocal data were acquired on an Olympus FV1000 or Zeiss LSM880, and image data were processed using ImageJ, ZEN software, and Bitplane Imaris software.
SEM
Embryos fixed in 2.5% glutaraldehyde for at least 24 h were post-fixed with osmium tetroxide, dehydrated with a graded alcohol series, and critical point-dried from liquid CO2. Specimens were mounted on aluminum stubs with double-sided tape and coated with gold and were viewed at 5 kV on a JEOL scanning electron microscope.
RNA analysis
RNA was prepared and analyzed by one-step and quantitative RT–PCR (qRT–PCR) as described (Costello et al. 2011) using the primer sequences listed in Supplemental Table S3. For transcriptional profiling experiments, RNA was isolated from four independent Lhx1-null (biological replicates) and wild-type control ES cell lines induced to differentiate into DE at days 4, 5, and 6. cRNA was hybridized to Illumina Mouse WG-6 v2 Expression BeadChips as described previously (Harper et al. 2011). Differential probe expression was determined following rank invariant normalization by using the Illumina custom error model option with Benjamini and Hochberg false discovery rate. Probes with significant different expression (differential score >13, equivalent to P < 0.05) were analyzed by using DAVID Bioinformatics Resources 6.7 (http://david.abcc.ncifcrf.gov).
In situ hybridization, X-gal staining, and histology
WISH and X-gal staining were performed as before (Costello et al. 2011). The antisense ribroprobes used are described in Supplemental Table S4. For histology, embryos were post-fixed in 4% paraformaldehyde, dehydrated in ethanol, embedded in paraffin wax, sectioned (8 μm), and eosin-counterstained.
Generation of SF-tagged Lhx1-expressing P19CL6 embryonal carcinoma cell lines
To generate stably expressing SF-tagged Lhx1 sublines, linearized pCAG-SF-Lhx1-IRES-Puro (N-terminal), pCAG-Lhx1-SF-IRES-Puro (C-terminal), or pCAG-SF-Lhx1-cmER-IRES-Puro vectors were introduced by electroporation, and drug-resistant clones were selected in 1 μg/mL puromycin and screened by Western blot analysis. For SF-Lhx1-cmER activation, 1 μg/mL 4-hydroxytamoxifen (Sigma, H7904) was added to the culture medium. P19CL6 cells were induced to differentiate via DMSO addition as previously described (Costello et al. 2011).
ChIP-seq analysis
For ChIP-seq analysis, two independent SF-Lhx1-cmER-expressing clones and control P19CL6 cells were induced to differentiate for 4 d in the presence of DMSO and tamoxifen. ChIP was performed as described (Costello et al. 2011) using anti-Lhx1 antibody (Santa Cruz Biotechnology, sc-19341x) or control goat IgG (Santa Cruz Biotechnology, sc-2088). Eluted DNA samples recovered using a “ChIP DNA Clean and Concentrator” column kit (Zymo Research) were multiplexed and sequenced using two lanes on an Illumina HiSeq 2000 sequencer. Sequence reads were mapped to the mm9 mouse genome release with Stampy using default parameters (Lunter and Goodson 2011). Peak calling was performed using MACS1.4.2 (Zhang et al. 2008) using default parameters to call areas of enrichment. De novo motif finding within ChIP-seq peaks was performed using Weeder version 1.4.2 (Pavesi et al. 2004). The distribution and functional annotation of Lhx1 ChIP-seq peaks were performed using GREAT version 2.0.2 using the basal plus extension rule, annotating genes within 5 kb of TSSs initially and within 1 Mb where no proximal genes exist (McLean et al. 2010). Terms with a binomial P-value of ≤1 × 10⁻⁵ were considered significant. For comparison, H3K4me1, H3K4me3, H3K27ac, and p300 ChIP-seq peak coordinates were downloaded from NCBI Gene Expression Omnibus (GEO) accession numbers GSE31039 and GSE36027, while Otx2 and Foxa2 were downloaded from NCBI GEO accession numbers GSM1355169 and GSM993787, respectively. Regions of overlap between the ChIP-seq peaks identified in the present study and other published data sets were compared using custom Perl scripts.
StrepTactin pull-downs and MS analysis
StrepTactin pull-down experiments were performed using nuclear extracts from SF-Lhx1 (N-terminal), Lhx1-SF (C-terminal), or SF-Lhx1-cmER stably transfected or control P19Cl6 cells induced to differentiate for 4 d. Twenty micrograms of Avidin per milligram of extract was added to block endogenous biotin, and nuclear extracts were treated with 1.25 U/mg benzonase. For large-scale precipitation, 15 mg of nuclear extract was incubated with StrepTactin Superflow resin (Iba, 2-21206) for 2 h, and the bound fraction was recovered in elution buffer (100 mM Tris, 150 mM Nacl, 1mM EDTA, 2.5 mM DesthioBiotin, 10% glycerol, 0.5 mM DTT) and subjected to electrophoresis in a 4%–20% miniprotean TGX gel (Bio-Rad, 456-1094S). Gel-excised fragments were digested with trypsin and analyzed by MS. Data were acquired on a Thermo Q Exactive mass spectrometer coupled to a Dionex RSLC nano-high-performance liquid chromatography system. Raw data files were converted to .MGF file format and analyzed using the Central Proteomics Facility Pipeline (Trudgian et al. 2010), and label-free quantitation was performed using SINQ (Trudgian et al. 2011). Criteria for identifying specific interactions included protein identification, including 1% false discovery rate and one or more unique peptides representative of each full-length sequence. Proteins present in control P19CL6 samples were filtered out of the final interpretation.
Accession numbers
The microarray and ChIP-seq data have been deposited in NCBI GEO with accession number GSE70958.
Supplementary Material
Acknowledgments
We thank Andrew Nelson for discussions, Rob Klose for reagents, Benjamin Thomas and Svenja Hester of the Central Proteomics Facility (http://www.proteomics.ox.ac.uk) for performing the MS work, and the High-Throughput Genomics Group at the Wellcome Trust Centre for Human Genetics for generating the microarray and sequencing data (funded by Wellcome Trust grant 090532/Z/09/Z and Medical Research Council Hub grant G0900747 91070). Microscopy was carried out in the Dunn School Bioimaging Facility and the Micron Advanced Bioimaging Unit (funded from Wellcome Trust Strategic Award 091911), and we are grateful to Benjamin Gordon, Errin Johnson, and Alan Wainman for technical assistance. This work was supported by a Wellcome Trust Principal Research Fellowship 102811 to E.J.R., and National Institutes of Health grants R01-DK084391, R01-HD052115, and P30-CA008748 to A.-K.H.
Footnotes
Supplemental material is available for this article.
Article is online at http://www.genesdev.org/cgi/doi/10.1101/gad.268979.115.
Freely available online through the Genes & Development Open Access option.
References
- Adachi H, Saijoh Y, Mochida K, Ohishi S, Hashiguchi H, Hirao A, Hamada H. 1999. Determination of left/right asymmetric expression of nodal by a left side-specific enhancer with sequence similarity to a lefty-2 enhancer. Genes Dev 13: 1589–1600. [DOI] [PMC free article] [PubMed] [Google Scholar]
- Agulnick AD, Taira M, Breen JJ, Tanaka T, Dawid IB, Westphal H. 1996. Interactions of the LIM-domain-binding factor Ldb1 with LIM homeodomain proteins. Nature 384: 270–272. [DOI] [PubMed] [Google Scholar]
- Ang SL, Rossant J. 1994. HNF-3β is essential for node and notochord formation in mouse development. Cell 78: 561–574. [DOI] [PubMed] [Google Scholar]
- Ang SL, Jin O, Rhinn M, Daigle N, Stevenson L, Rossant J. 1996. A targeted mouse Otx2 mutation leads to severe defects in gastrulation and formation of axial mesoderm and to deletion of rostral brain. Development 122: 243–252. [DOI] [PubMed] [Google Scholar]
- Arkell RM, Fossat N, Tam PP. 2013. Wnt signalling in mouse gastrulation and anterior development: new players in the pathway and signal output. Curr Opin Genet Dev 23: 454–460. [DOI] [PubMed] [Google Scholar]
- Arnold SJ, Robertson EJ. 2009. Making a commitment: cell lineage allocation and axis patterning in the early mouse embryo. Nat Rev Mol Cell Biol 10: 91–103. [DOI] [PubMed] [Google Scholar]
- Arnold SJ, Hofmann UK, Bikoff EK, Robertson EJ. 2008. Pivotal roles for eomesodermin during axis formation, epithelium-to-mesenchyme transition and endoderm specification in the mouse. Development 135: 501–511. [DOI] [PMC free article] [PubMed] [Google Scholar]
- Barnes JD, Crosby JL, Jones CM, Wright CV, Hogan BL. 1994. Embryonic expression of Lim-1, the mouse homolog of Xenopus Xlim-1, suggests a role in lateral mesoderm differentiation and neurogenesis. Dev Biol 161: 168–178. [DOI] [PubMed] [Google Scholar]
- Ben-Haim N, Lu C, Guzman-Ayala M, Pescatore L, Mesnard D, Bischofberger M, Naef F, Robertson EJ, Constam DB. 2006. The nodal precursor acting via activin receptors induces mesoderm by maintaining a source of its convertases and BMP4. Dev Cell 11: 313–323. [DOI] [PubMed] [Google Scholar]
- Berger MF, Badis G, Gehrke AR, Talukder S, Philippakis AA, Pena-Castillo L, Alleyne TM, Mnaimneh S, Botvinnik OB, Chan ET, et al. 2008. Variation in homeodomain DNA binding revealed by high-resolution analysis of sequence preferences. Cell 133: 1266–1276. [DOI] [PMC free article] [PubMed] [Google Scholar]
- Bochkis IM, Schug J, Ye DZ, Kurinna S, Stratton SA, Barton MC, Kaestner KH. 2012. Genome-wide location analysis reveals distinct transcriptional circuitry by paralogous regulators Foxa1 and Foxa2. PLoS Genet 8: e1002770. [DOI] [PMC free article] [PubMed] [Google Scholar]
- Buecker C, Srinivasan R, Wu Z, Calo E, Acampora D, Faial T, Simeone A, Tan M, Swigut T, Wysocka J. 2014. Reorganization of enhancer patterns in transition from naive to primed pluripotency. Cell Stem Cell 14: 838–853. [DOI] [PMC free article] [PubMed] [Google Scholar]
- Burtscher I, Lickert H. 2009. Foxa2 regulates polarity and epithelialization in the endoderm germ layer of the mouse embryo. Development 136: 1029–1038. [DOI] [PubMed] [Google Scholar]
- Caputo L, Witzel HR, Kolovos P, Cheedipudi S, Looso M, Mylona A, van IJcken WF, Laugwitz KL, Evans SM, Braun T, et al. 2015. The Isl1/Ldb1 complex orchestrates genome-wide chromatin organization to instruct differentiation of multipotent cardiac progenitors. Cell Stem Cell 17: 287–299. [DOI] [PMC free article] [PubMed] [Google Scholar]
- Castel D, Mourikis P, Bartels SJ, Brinkman AB, Tajbakhsh S, Stunnenberg HG. 2013. Dynamic binding of RBPJ is determined by Notch signaling status. Genes Dev 27: 1059–1071. [DOI] [PMC free article] [PubMed] [Google Scholar]
- Cheah SS, Kwan KM, Behringer RR. 2000. Requirement of LIM domains for LIM1 function in mouse head development. Genesis 27: 12–21. [DOI] [PubMed] [Google Scholar]
- Chiang C, Litingtung Y, Lee E, Young KE, Corden JL, Westphal H, Beachy PA. 1996. Cyclopia and defective axial patterning in mice lacking Sonic hedgehog gene function. Nature 383: 407–413. [DOI] [PubMed] [Google Scholar]
- Chou SJ, Hermesz E, Hatta T, Feltner D, El-Hodiri HM, Jamrich M, Mahon K. 2006. Conserved regulatory elements establish the dynamic expression of Rpx/HesxI in early vertebrate development. Dev Biol 292: 533–545. [DOI] [PubMed] [Google Scholar]
- Chu GC, Dunn NR, Anderson DC, Oxburgh L, Robertson EJ. 2004. Differential requirements for Smad4 in TGFβ-dependent patterning of the early mouse embryo. Development 131: 3501–3512. [DOI] [PubMed] [Google Scholar]
- Chu CW, Gerstenzang E, Ossipova O, Sokol SY. 2013. Lulu regulates Shroom-induced apical constriction during neural tube closure. PLoS One 8: e81854. [DOI] [PMC free article] [PubMed] [Google Scholar]
- Collignon J, Varlet I, Robertson EJ. 1996. Relationship between asymmetric nodal expression and the direction of embryonic turning. Nature 381: 155–158. [DOI] [PubMed] [Google Scholar]
- Costello I, Pimeisl IM, Drager S, Bikoff EK, Robertson EJ, Arnold SJ. 2011. The T-box transcription factor Eomesodermin acts upstream of Mesp1 to specify cardiac mesoderm during mouse gastrulation. Nat Cell Biol 13: 1084–1091. [DOI] [PMC free article] [PubMed] [Google Scholar]
- Deng W, Lee J, Wang H, Miller J, Reik A, Gregory PD, Dean A, Blobel GA. 2012. Controlling long-range genomic interactions at a native locus by targeted tethering of a looping factor. Cell 149: 1233–1244. [DOI] [PMC free article] [PubMed] [Google Scholar]
- Enkhmandakh B, Makeyev AV, Bayarsaihan D. 2006. The role of the proline-rich domain of Ssdp1 in the modular architecture of the vertebrate head organizer. Proc Natl Acad Sci 103: 11631–11636. [DOI] [PMC free article] [PubMed] [Google Scholar]
- Farley FW, Soriano P, Steffen LS, Dymecki SM. 2000. Widespread recombinase expression using FLPeR (flipper) mice. Genesis 28: 106–110. [PubMed] [Google Scholar]
- Fossat N, Jones V, Garcia-Garcia MJ, Tam PP. 2012. Modulation of WNT signaling activity is key to the formation of the embryonic head. Cell Cycle 11: 26–32. [DOI] [PubMed] [Google Scholar]
- Fossat N, Ip CK, Jones VJ, Studdert JB, Khoo PL, Lewis SL, Power M, Tourle K, Loebel DA, Kwan KM, et al. 2015. Context-specific function of the LIM homeobox 1 transcription factor in head formation of the mouse embryo. Development 142: 2069–2079. [DOI] [PubMed] [Google Scholar]
- Gungor C, Taniguchi-Ishigaki N, Ma H, Drung A, Tursun B, Ostendorff HP, Bossenz M, Becker CG, Becker T, Bach I. 2007. Proteasomal selection of multiprotein complexes recruited by LIM homeodomain transcription factors. Proc Natl Acad Sci 104: 15000–15005. [DOI] [PMC free article] [PubMed] [Google Scholar]
- Harper J, Mould A, Andrews RM, Bikoff EK, Robertson EJ. 2011. The transcriptional repressor Blimp1/Prdm1 regulates postnatal reprogramming of intestinal enterocytes. Proc Natl Acad Sci 108: 10585–10590. [DOI] [PMC free article] [PubMed] [Google Scholar]
- Hayashi S, Lewis P, Pevny L, McMahon AP. 2002. Efficient gene modulation in mouse epiblast using a Sox2Cre transgenic mouse strain. Mech Dev 119: S97–S101. [DOI] [PubMed] [Google Scholar]
- Hildebrand JD, Soriano P. 1999. Shroom, a PDZ domain-containing actin-binding protein, is required for neural tube morphogenesis in mice. Cell 99: 485–497. [DOI] [PubMed] [Google Scholar]
- Hobert O, Westphal H. 2000. Functions of LIM-homeobox genes. Trends Genet 16: 75–83. [DOI] [PubMed] [Google Scholar]
- Imuta Y, Nishioka N, Kiyonari H, Sasaki H. 2009. Short limbs, cleft palate, and delayed formation of flat proliferative chondrocytes in mice with targeted disruption of a putative protein kinase gene, Pkdcc (AW548124). Dev Dyn 238: 210–222. [DOI] [PubMed] [Google Scholar]
- Ip CK, Fossat N, Jones V, Lamonerie T, Tam PP. 2014. Head formation: OTX2 regulates Dkk1 and Lhx1 activity in the anterior mesendoderm. Development 141: 3859–3867. [DOI] [PubMed] [Google Scholar]
- Krivega I, Dale RK, Dean A. 2014. Role of LDB1 in the transition from chromatin looping to transcription activation. Genes Dev 28: 1278–1290. [DOI] [PMC free article] [PubMed] [Google Scholar]
- Kurokawa D, Kiyonari H, Nakayama R, Kimura-Yoshida C, Matsuo I, Aizawa S. 2004a. Regulation of Otx2 expression and its functions in mouse forebrain and midbrain. Development 131: 3319–3331. [DOI] [PubMed] [Google Scholar]
- Kurokawa D, Takasaki N, Kiyonari H, Nakayama R, Kimura-Yoshida C, Matsuo I, Aizawa S. 2004b. Regulation of Otx2 expression and its functions in mouse epiblast and anterior neuroectoderm. Development 131: 3307–3317. [DOI] [PubMed] [Google Scholar]
- Kwon GS, Fraser ST, Eakin GS, Mangano M, Isern J, Sahr KE, Hadjantonakis AK, Baron MH. 2006. Tg(Afp-GFP) expression marks primitive and definitive endoderm lineages during mouse development. Dev Dyn 235: 2549–2558. [DOI] [PMC free article] [PubMed] [Google Scholar]
- Kwon GS, Viotti M, Hadjantonakis AK. 2008. The endoderm of the mouse embryo arises by dynamic widespread intercalation of embryonic and extraembryonic lineages. Dev Cell 15: 509–520. [DOI] [PMC free article] [PubMed] [Google Scholar]
- Lee JD, Anderson KV. 2008. Morphogenesis of the node and notochord: the cellular basis for the establishment and maintenance of left–right asymmetry in the mouse. Dev Dyn 237: 3464–3476. [DOI] [PMC free article] [PubMed] [Google Scholar]
- Lee JD, Silva-Gagliardi NF, Tepass U, McGlade CJ, Anderson KV. 2007. The FERM protein Epb4.1l5 is required for organization of the neural plate and for the epithelial-mesenchymal transition at the primitive streak of the mouse embryo. Development 134: 2007–2016. [DOI] [PubMed] [Google Scholar]
- Lee JD, Migeotte I, Anderson KV. 2010. Left–right patterning in the mouse requires Epb4.1l5-dependent morphogenesis of the node and midline. Dev Biol 346: 237–246. [DOI] [PMC free article] [PubMed] [Google Scholar]
- Leung AW, Wong SY, Chan D, Tam PP, Cheah KS. 2010. Loss of procollagen IIA from the anterior mesendoderm disrupts the development of mouse embryonic forebrain. Dev Dyn 239: 2319–2329. [DOI] [PubMed] [Google Scholar]
- Love PE, Warzecha C, Li L. 2014. Ldb1 complexes: the new master regulators of erythroid gene transcription. Trends Genet 30: 1–9. [DOI] [PMC free article] [PubMed] [Google Scholar]
- Lunter G, Goodson M. 2011. Stampy: a statistical algorithm for sensitive and fast mapping of Illumina sequence reads. Genome Res 21: 936–939. [DOI] [PMC free article] [PubMed] [Google Scholar]
- McKnight KD, Hou J, Hoodless PA. 2007. Dynamic expression of thyrotropin-releasing hormone in the mouse definitive endoderm. Dev Dyn 236: 2909–2917. [DOI] [PubMed] [Google Scholar]
- McLean CY, Bristor D, Hiller M, Clarke SL, Schaar BT, Lowe CB, Wenger AM, Bejerano G. 2010. GREAT improves functional interpretation of cis-regulatory regions. Nat Biotechnol 28: 495–501. [DOI] [PMC free article] [PubMed] [Google Scholar]
- Morrison GM, Oikonomopoulou I, Migueles RP, Soneji S, Livigni A, Enver T, Brickman JM. 2008. Anterior definitive endoderm from ESCs reveals a role for FGF signaling. Cell Stem Cell 3: 402–415. [DOI] [PubMed] [Google Scholar]
- Morsut L, Yan KP, Enzo E, Aragona M, Soligo SM, Wendling O, Mark M, Khetchoumian K, Bressan G, Chambon P, et al. 2010. Negative control of Smad activity by ectodermin/Tif1γ patterns the mammalian embryo. Development 137: 2571–2578. [DOI] [PubMed] [Google Scholar]
- Mould A, Morgan MA, Li L, Bikoff EK, Robertson EJ. 2012. Blimp1/Prdm1 governs terminal differentiation of endovascular trophoblast giant cells and defines multipotent progenitors in the developing placenta. Genes Dev 26: 2063–2074. [DOI] [PMC free article] [PubMed] [Google Scholar]
- Mukhopadhyay M, Shtrom S, Rodriguez-Esteban C, Chen L, Tsukui T, Gomer L, Dorward DW, Glinka A, Grinberg A, Huang SP, et al. 2001. Dickkopf1 is required for embryonic head induction and limb morphogenesis in the mouse. Dev Cell 1: 423–434. [DOI] [PubMed] [Google Scholar]
- Mukhopadhyay M, Teufel A, Yamashita T, Agulnick AD, Chen L, Downs KM, Schindler A, Grinberg A, Huang SP, Dorward D, et al. 2003. Functional ablation of the mouse Ldb1 gene results in severe patterning defects during gastrulation. Development 130: 495–505. [DOI] [PubMed] [Google Scholar]
- Nakano T, Murata T, Matsuo I, Aizawa S. 2000. OTX2 directly interacts with LIM1 and HNF-3β. Biochem Biophys Res Commun 267: 64–70. [DOI] [PubMed] [Google Scholar]
- Nishioka N, Nagano S, Nakayama R, Kiyonari H, Ijiri T, Taniguchi K, Shawlot W, Hayashizaki Y, Westphal H, Behringer RR, et al. 2005. Ssdp1 regulates head morphogenesis of mouse embryos by activating the Lim1–Ldb1 complex. Development 132: 2535–2546. [DOI] [PubMed] [Google Scholar]
- Norris DP, Robertson EJ. 1999. Asymmetric and node-specific nodal expression patterns are controlled by two distinct cis-acting regulatory elements. Genes Dev 13: 1575–1588. [DOI] [PMC free article] [PubMed] [Google Scholar]
- Nowotschin S, Costello I, Piliszek A, Kwon GS, Mao CA, Klein WH, Robertson EJ, Hadjantonakis AK. 2013. The T-box transcription factor Eomesodermin is essential for AVE induction in the mouse embryo. Genes Dev 27: 997–1002. [DOI] [PMC free article] [PubMed] [Google Scholar]
- Oka C, Nakano T, Wakeham A, de la Pompa JL, Mori C, Sakai T, Okazaki S, Kawaichi M, Shiota K, Mak TW, et al. 1995. Disruption of the mouse RBP-Jκ gene results in early embryonic death. Development 121: 3291–3301. [DOI] [PubMed] [Google Scholar]
- Pavesi G, Mereghetti P, Mauri G, Pesole G. 2004. Weeder Web: discovery of transcription factor binding sites in a set of sequences from co-regulated genes. Nucleic Acids Res 32: W199–W203. [DOI] [PMC free article] [PubMed] [Google Scholar]
- Perea-Gomez A, Shawlot W, Sasaki H, Behringer RR, Ang S. 1999. HNF3β and Lim1 interact in the visceral endoderm to regulate primitive streak formation and anterior–posterior polarity in the mouse embryo. Development 126: 4499–4511. [DOI] [PubMed] [Google Scholar]
- Przemeck GK, Heinzmann U, Beckers J, Hrabe de Angelis M. 2003. Node and midline defects are associated with left–right development in Delta1 mutant embryos. Development 130: 3–13. [DOI] [PubMed] [Google Scholar]
- Raya A, Kawakami Y, Rodriguez-Esteban C, Buscher D, Koth CM, Itoh T, Morita M, Raya RM, Dubova I, Bessa JG, et al. 2003. Notch activity induces Nodal expression and mediates the establishment of left–right asymmetry in vertebrate embryos. Genes Dev 17: 1213–1218. [DOI] [PMC free article] [PubMed] [Google Scholar]
- Sasaki H, Hogan BL. 1993. Differential expression of multiple fork head related genes during gastrulation and axial pattern formation in the mouse embryo. Development 118: 47–59. [DOI] [PubMed] [Google Scholar]
- Sasaki H, Hogan BL. 1996. Enhancer analysis of the mouse HNF-3 β gene: regulatory elements for node/notochord and floor plate are independent and consist of multiple sub-elements. Genes Cells 1: 59–72. [DOI] [PubMed] [Google Scholar]
- Shawlot W, Behringer RR. 1995. Requirement for Lim1 in head-organizer function. Nature 374: 425–430. [DOI] [PubMed] [Google Scholar]
- Shawlot W, Wakamiya M, Kwan KM, Kania A, Jessell TM, Behringer RR. 1999. Lim1 is required in both primitive streak-derived tissues and visceral endoderm for head formation in the mouse. Development 126: 4925–4932. [DOI] [PubMed] [Google Scholar]
- Shimono A, Behringer RR. 1999. Isolation of novel cDNAs by subtractions between the anterior mesendoderm of single mouse gastrula stage embryos. Dev Biol 209: 369–380. [DOI] [PubMed] [Google Scholar]
- Soriano P. 1999. Generalized lacZ expression with the ROSA26 Cre reporter strain. Nat Genet 21: 70–71. [DOI] [PubMed] [Google Scholar]
- Sousa-Nunes R, Rana AA, Kettleborough R, Brickman JM, Clements M, Forrest A, Grimmond S, Avner P, Smith JC, Dunwoodie SL, et al. 2003. Characterizing embryonic gene expression patterns in the mouse using nonredundant sequence-based selection. Genome Res 13: 2609–2620. [DOI] [PMC free article] [PubMed] [Google Scholar]
- Srinivas S, Watanabe T, Lin CS, William CM, Tanabe Y, Jessell TM, Costantini F. 2001. Cre reporter strains produced by targeted insertion of EYFP and ECFP into the ROSA26 locus. BMC Dev Biol 1: 4. [DOI] [PMC free article] [PubMed] [Google Scholar]
- Takahashi M, Fujita M, Furukawa Y, Hamamoto R, Shimokawa T, Miwa N, Ogawa M, Nakamura Y. 2002. Isolation of a novel human gene, APCDD1, as a direct target of the β-catenin/T-cell factor 4 complex with probable involvement in colorectal carcinogenesis. Cancer Res 62: 5651–5656. [PubMed] [Google Scholar]
- Tam PP, Loebel DA. 2007. Gene function in mouse embryogenesis: get set for gastrulation. Nat Rev Genet 8: 368–381. [DOI] [PubMed] [Google Scholar]
- Tamplin OJ, Kinzel D, Cox BJ, Bell CE, Rossant J, Lickert H. 2008. Microarray analysis of Foxa2 mutant mouse embryos reveals novel gene expression and inductive roles for the gastrula organizer and its derivatives. BMC Genomics 9: 511. [DOI] [PMC free article] [PubMed] [Google Scholar]
- Tamplin OJ, Cox BJ, Rossant J. 2011. Integrated microarray and ChIP analysis identifies multiple Foxa2 dependent target genes in the notochord. Dev Biol 360: 415–425. [DOI] [PubMed] [Google Scholar]
- Tanaka SS, Yamaguchi YL, Steiner KA, Nakano T, Nishinakamura R, Kwan KM, Behringer RR, Tam PP. 2010. Loss of Lhx1 activity impacts on the localization of primordial germ cells in the mouse. Dev Dyn 239: 2851–2859. [DOI] [PubMed] [Google Scholar]
- Teo AK, Arnold SJ, Trotter MW, Brown S, Ang LT, Chng Z, Robertson EJ, Dunn NR, Vallier L. 2011. Pluripotency factors regulate definitive endoderm specification through eomesodermin. Genes Dev 25: 238–250. [DOI] [PMC free article] [PubMed] [Google Scholar]
- Trudgian DC, Thomas B, McGowan SJ, Kessler BM, Salek M, Acuto O. 2010. CPFP: a central proteomics facilities pipeline. Bioinformatics 26: 1131–1132. [DOI] [PubMed] [Google Scholar]
- Trudgian DC, Ridlova G, Fischer R, Mackeen MM, Ternette N, Acuto O, Kessler BM, Thomas B. 2011. Comparative evaluation of label-free SINQ normalized spectral index quantitation in the central proteomics facilities pipeline. Proteomics 11: 2790–2797. [DOI] [PubMed] [Google Scholar]
- Vincent SD, Dunn NR, Hayashi S, Norris DP, Robertson EJ. 2003. Cell fate decisions within the mouse organizer are governed by graded Nodal signals. Genes Dev 17: 1646–1662. [DOI] [PMC free article] [PubMed] [Google Scholar]
- Viotti M, Niu L, Shi SH, Hadjantonakis AK. 2012. Role of the gut endoderm in relaying left–right patterning in mice. PLoS Biol 10: e1001276. [DOI] [PMC free article] [PubMed] [Google Scholar]
- Viotti M, Nowotschin S, Hadjantonakis AK. 2014. SOX17 links gut endoderm morphogenesis and germ layer segregation. Nat Cell Biol 16: 1146–1156. [DOI] [PMC free article] [PubMed] [Google Scholar]
- Wederell ED, Bilenky M, Cullum R, Thiessen N, Dagpinar M, Delaney A, Varhol R, Zhao Y, Zeng T, Bernier B, et al. 2008. Global analysis of in vivo Foxa2-binding sites in mouse adult liver using massively parallel sequencing. Nucleic Acids Res 36: 4549–4564. [DOI] [PMC free article] [PubMed] [Google Scholar]
- Xu Z, Meng X, Cai Y, Liang H, Nagarajan L, Brandt SJ. 2007. Single-stranded DNA-binding proteins regulate the abundance of LIM domain and LIM domain-binding proteins. Genes Dev 21: 942–955. [DOI] [PMC free article] [PubMed] [Google Scholar]
- Xu C, Lu X, Chen EZ, He Z, Uyunbilig B, Li G, Ma Y, Hui L, Xie B, Gao Y, et al. 2012. Genome-wide roles of Foxa2 in directing liver specification. J Mol Cell Biol 4: 420–422. [DOI] [PMC free article] [PubMed] [Google Scholar]
- Yamanaka Y, Tamplin OJ, Beckers A, Gossler A, Rossant J. 2007. Live imaging and genetic analysis of mouse notochord formation reveals regional morphogenetic mechanisms. Dev Cell 13: 884–896. [DOI] [PubMed] [Google Scholar]
- Yang SH, Kalkan T, Morissroe C, Marks H, Stunnenberg H, Smith A, Sharrocks AD. 2014. Otx2 and Oct4 drive early enhancer activation during embryonic stem cell transition from naive pluripotency. Cell Rep 7: 1968–1981. [DOI] [PMC free article] [PubMed] [Google Scholar]
- Zhang Y, Liu T, Meyer CA, Eeckhoute J, Johnson DS, Bernstein BE, Nusbaum C, Myers RM, Brown M, Li W, et al. 2008. Model-based analysis of ChIP-Seq (MACS). Genome Biol 9: R137. [DOI] [PMC free article] [PubMed] [Google Scholar]
Associated Data
This section collects any data citations, data availability statements, or supplementary materials included in this article.