

Summary
Somatic PTPN11 mutations cause juvenile myelomonocytic leukemia (JMML). Germ-line PTPN11 defects cause Noonan syndrome (NS), and specific inherited mutations cause NS/JMML. Here, we report that hematopoietic cells differentiated from human induced pluripotent stem cells (hiPSCs) harboring NS/JMML-causing PTPN11 mutations recapitulated JMML features. hiPSC-derived NS/JMML myeloid cells exhibited increased signaling through STAT5 and up-regulation of miR-223 and miR-15a. Similarly, miR-223 and miR-15a were up-regulated in 11/19 JMML bone marrow mononuclear cells harboring PTPN11 mutations but not those without PTPN11 defects. Reducing miR-223’s function in NS/JMML hiPSCs normalized myelogenesis. Micro-RNA target gene expression levels were reduced in hiPSC-derived myeloid cells as well as in JMML cells with PTPN11 mutations. Thus, studying an inherited human cancer syndrome with hiPSCs illuminated early oncogenesis prior to the accumulation of secondary genomic alterations, enabling us to discover micro-RNA dysregulation, establishing a genotype-phenotype association for JMML and providing novel therapeutic targets.
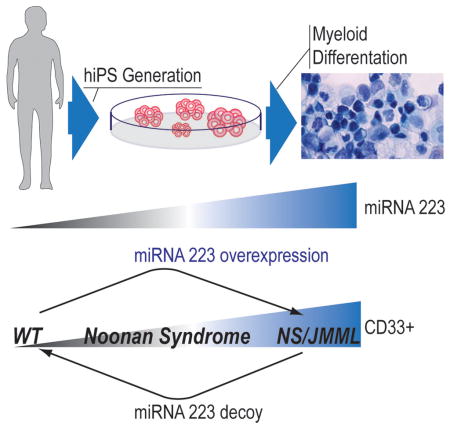
Graphical abstract
Introduction
Juvenile myelomonocytic leukemia (JMML), an aggressive, difficult-to-treat myelodysplastic and myeloproliferative neoplasm of early childhood, is characterized by excessive proliferation of monocytic and granulocytic cells along with dysplastic features. Most JMML cases are associated with somatic gain-of-function (GOF) mutations in components of the RAS/MAPK signal transduction pathway (Yoshida et al., 2012). A minority of cases arises in young children with Noonan syndrome (NS; OMIM163950), a genetic disorder with increased RAS/MAPK signaling (Tartaglia and Gelb, 2008). Fifty percent of NS patients and 35% of JMML cases carry gain-of-function (GOF) PTPN11 mutations altering SHP-2. However, the molecular mechanisms through which PTPN11 mutations result in deranged myelopoiesis are not well understood.
SHP-2 is a member of the tyrosine phosphatase family and regulates several biological processes, particularly embryogenesis and hematopoietic cell development (Tartaglia and Gelb, 2008). For NS, particular germ-line mutations in PTPN11 underlie JMML, which has clinical features similar to those in children with JMML arising from somatic mutations in PTPN11, although with generally better outcomes. Mutations in PTPN11, RAS genes, NF1 and CBL are mutually exclusive in JMML, suggesting that one hit in this pathway is sufficient for leukemogenesis (Tartaglia and Gelb, 2008; Perez et al., 2010; Yoshida et al., 2012).
The ability to induce hiPSCs from terminally differentiated cells such as skin fibroblasts (Takahashi et al., 2007) provides an opportunity to study disease pathogenesis. For hereditary disorders associated with cancer such as NS/JMML, hiPSCs derived from non-cancerous cells permit investigation of the role of the inherited mutations per se, free of secondary or additional genomic alterations that frequently occur during cancer evolution and which might obscure studies performed with hiPSCs derived from the cancer cells (Kotini et al., 2015). Here, we report our findings from modeling JMML using hiPSCs derived from subjects with NS/JMML and NS without leukemia harboring PTPN11 mutations.
Results
Generation of hiPSC lines and clinical manifestations in NS/JMML-derived hematopoietic cells
Using somatic cell reprogramming (Takahashi et al., 2007), we obtained hiPSC lines from skin fibroblasts harboring mutations in PTPN11 from two subjects with NS/JMML. As controls, we used five hiPSC lines derived from skin fibroblasts of unrelated healthy individuals and two subjects with NS, the latter to clarify which perturbations were attributable to the PTPN11 gain-of-function mutations generally versus those specific to JMML pathogenesis (Tables S1 and S2). All PTPN11 mutations resided in the N-SH2 domain, destabilizing SHP-2’s inactive conformation. Pluripotency was established based on in vitro characteristics (Figures S1A–B), and in vivo teratoma formation (Figure S1C). All hiPSC lines had a normal karyotype (Figure S1C). NS and NS/JMML hiPSCs retained heterozygosity for their PTPN11 mutation (Figure S1F). Transgenes were integrated at 1–4 sites and were silenced (Figure S1D–E). After EGF stimulation, ERK activation was increased and sustained in the NS and NS/JMML hiPSC lines (Figure S1G), consistent with PTPN11 mutation GOF effects.
Following an established protocol using a cocktail of cytokines (IGF-1, VEGF, EPO, IL-11, IL-3, IL-6, bFGF, SCF, and TPO) (Grigoriadis et al., 2010; Kennedy et al., 2007) (Figures S1H, S2A and Supplemental Experimental Procedure), hiPSC lines were differentiated into hematopoietic progenitor lineages, showing typical morphology for the various cell types (Figure S1H). Flow cytometry analysis showed that the differentiating lines expressed the pan-hematopoietic marker CD45 at least until Day 28 (Figure S2B). Neither the B-lymphocyte antigen CD19 nor the T-cell surface glycoprotein CD3 gamma chain (CD3G) was detected at Day 14 (Figure S2C–D). Thus, we were able to obtain hematopoietic cells without lymphocyte lineages.
To analyze seminal features of JMML, we used differentiating cells at Day 14 after embryoid body (EB) formation. GM-CSF hypersensitivity was observed in the number of colonies formed from NS/JMML hematopoietic cells relative to controls (Figure 1A). Exposure of NS/JMML hematopoietic cells in semi-solid media to low concentrations of GM-CSF (0.01 or 0.1 ng/mL) produced larger colonies compared to controls or NS (Figure 1B). Fluorescence in situ hybridization with a dual probe showed an absence of the BCR-ABL fusion (Figure S3A).
Figure 1. Clinical Features of NS/JMML hiPSC-Derived Hematopoietic Cells.

(A) Hematopoietic growth factor dose-response curves to GM-CSF. Values are the mean ± standard error of the mean for three independent experiments. At 0.01 ng/ml GM-CSF, ** is p ≤ 0.01 in NS/JMML Patient #4 vs. CTRL. At 0.1 ng/ml GM-CSF, ** is p ≤ 0.01 in NS/JMML Patients #3 and #4 vs. CTRL. (B) Representative pictures of CFU-GM from study of hypersensitivity to GM-CSF. Scale bars represent 200 μm. (C) Colony forming capacity. Bar graphs represent mean ± standard error of the mean of three independent experiments. The CTRL group consisted of iPSC lines, each derived from different healthy individuals. (D) Representative images of CFU-GM and BFU-E colonies and Wright-Giemsa staining after cytospin. Scale bars represent 200 μm for colonies and 20 μm for cytospin analysis. (E) Flow cytometry of hematopoietic cells shown as percentage of positive cells for myeloid surface markers. CTRL group represents four healthy individuals. NS group represents the two Noonan syndrome patients and NS/JMML group represents the two NS/JMML subjects. Box-and-whisker plots show the median to the first and third quartiles and the minimum and maximum values. Values represent four independent experiments. See also Figure S3.
Next, we performed colony-forming unit (CFU) assays in methylcellulose and a cocktail of cytokines to determine the proliferative capacity of the different hematopoietic progenitors. We observed a ten-fold increase in the total number of colonies forming from 1.5×10⁴ NS/JMML cells compared to those from comparable numbers of control or NS cells, which were attributable to increases among the CFU-erythroid (CFU-E), burst-forming unit-erythroid (BFU-E) and CFU-granulocyte/macrophage (CFU-GM) subtypes (Figure 1C). Moreover the NS/JMML granulocyte-macrophage colonies were notably larger (Figure 1D). Cytospin analysis confirmed the granulocyte/monocyte and erythroid cell morphology in the CFU-GM and BFU-E colonies, respectively (Figure 1D).
To characterize the types of myeloid cells differentiating from hiPSC lines, cell populations were analyzed using flow cytometry. We observed a significantly greater number of CD33+ myeloid cells at Day 14 in NS/JMML lines compared to the control and NS lines (Figure 1E), a difference that persisted (Figure S3B). We observed increased numbers of all leukocytes (CD33+/CD45+), monocytes/granulocytes (CD11B+ and CD14+), and erythroid cells (CD71+/CD235a+) (Figure 1E) among the NS/JMML-derived cultures compared to controls and NS groups. The NS/JMML megakaryocyte population was similar to the control and NS samples (Figure 1E).
Taken as a whole, hematopoietic progenitor cells derived from NS/JMML hiPSC lines recapitulated the principal features of JMML, including GM-CSF hypersensitivity and a myeloid population that was increased and hyper-proliferative.
NS/JMML-derived CD33+ myeloid cells show dysregulation in major biological processes
We compared the transcriptome profiles among hiPSC and sorted CD33+ myeloid cells from control and patient samples. Hierarchical clustering and principal component analysis (16,380 genes significantly different between hiPSCs and CD33+ myeloid cells) revealed comparable patterns among the control, NS and NS/JMML hiPSC lines (Figure 2A). The transcriptome profiles of CD33+ myeloid cells, which were highly reproducible and differed from those of the hiPSCs (Figure 2A–D), revealed consistently decreased pluripotency gene expression and up-regulation of genes related to myeloid regulation (Figure 2C and D), further evidence of successful myelopoiesis.
Figure 2. Profiling Analyses in CD33+ Myeloid Cells and Specific Dysregulated Pathways and Proliferation in NS/JMML CD33+ Myeloid Cells.

(A–B) Principal component analysis and unsupervised hierarchical clustering of genome-wide expression profile of hiPSCs and hiPSC-derived CD33+ myeloid cells. (C–D) Heat maps of 67 myeloid differentiation genes and 13 pluripotent genes in hiPSC lines and CD33+ myeloid cells (orange, up-regulated; blue, down-regulated). (E) GO analysis of up-regulated genes altered in CD33+ myeloid patients vs. controls. (F) GSEA curves in CD33+ myeloid NS/JMML cells vs. controls. JAK-STAT and MAPK signaling pathways, chronic myelocytic leukemia, acute myelocytic leukemia and cell cycle (red, up-regulated; blue, down-regulated). (G and H) Representative immunoblots show increased pSTAT5 and total STAT5 (G), and pERK (H) protein expression levels in NS/JMML CD33+ myeloid cells. Lanes were run on the same gel but were noncontiguous. (I) CDKN1A and MYC expression levels in CD33+ myeloid cells. Bar graphs represent mean ± standard error of the mean. (J) Annexin V and (K) Ki-67 staining of CD33+ myeloid cells show apoptosis and proliferation, respectively. Bar graphs represent mean ± standard error of the mean. The CTRL group consisted of iPSC lines, each derived from different healthy individuals. Data represent a composite of three separate experiments. See also Figure S4.
Genotype-specific dysregulation of genes related to biological processes such as metabolism, development, and proliferation was observed in CD33+ myeloid cells using Gene Ontology (GO) classification (Figure 2E). Gene Set Enrichment Analysis (GSEA) comparing control and NS/JMML CD33+ myeloid cells also revealed significant differences among gene lists related to receptor tyrosine kinase signaling pathways, cell cycle and myeloid leukemias (Figure 2F). NS and NS/JMML samples differed for gene lists relevant for cell cycle and myeloid leukemia (Figure S4). At the protein level, we found that total and activated (phosphorylated) STAT5, a critical component of the JAK-STAT signaling pathway implicated in JMML pathogenesis (Kotecha et al., 2008), were vastly increased in the NS/JMML CD33+ myeloid cells as compared to control CD33+ myeloid cells (Figure 2G); STAT5 activation in NS myeloid cells was intermediate. ERK activation was increased basally and after GM-CSF stimulation in the PTPN11-mutant CD33+ myeloid cells, being the highest in NS/JMML CD33+ myeloid cells (Figure 2H). GSEA also revealed up-regulation of CDKN1A (p21) and MYC in NS/JMML CD33+ myeloid cells. Although, their levels (Figure 2I) were comparable between NS and NS/JMML, contributions from others cell cycle regulators were suggested (Figure S4).
We assessed apoptosis and proliferation rates in the CD33+ myeloid cells using Annexin V and Ki67 staining, respectively. As compared to controls, NS/JMML CD33+ myeloid cells showed similar early-stage apoptosis but approximately eight-fold increased proliferation (Figures 2J–K). Proliferation of NS CD33+ myeloid cells was increased but not to the level observed in NS/JMML.
miR-223 and miR-15a are dysregulated in PTPN11-mutant JMML myeloid cells
We assessed expression levels of mature miRNAs relevant to hematopoiesis and cancer in the hiPSC-derived CD33+ myeloid cells (Chen et al., 2004; Ramkissoon et al., 2006; Vasilatou et al., 2010). While the levels of several miRNAs were not different, miR-223 and -15a expression levels were increased in NS/JMML fifty- and ten-fold, respectively (Figures 3A–B). This miRNA up-regulation was cell-type specific as levels of those two miRNAs were at most subtly increased in the parental hiPSC lines (Figure 3C).
Figure 3. Increased Expression Levels of miR-223, miR-15a in NS/JMML CD33+ Cells.

(A) Expression level of miR-181, miR-128a, miR-17, miR-20a and miR-106 in CD33+ myeloid cells derived from hiPSCs. (B) Expression level of miR-223 and miR-15a in CD33+ myeloid cells derived from hiPSCs. (C) RT-qPCR analysis of miR-223 and miR-25a in hiPSC lines. Expression levels were normalized to U6 and relative to CTRL sample. Bar graphs represent mean ± standard error of the mean. Data represent a composite of 3 separate experiments. In panels A–C, the CTRL group consisted of iPSC lines, each derived from different healthy individuals. (D) Quantitative RT-PCR showed the up-regulated expression pattern of miR-223 and mirR-15a in bone marrow cells from six controls and twenty-six JMML patients harboring PTPN11, KRAS, NRAS or CBL mutations, with or without NS (Table S3). The red squares represent JMML patients harboring PTPN11 mutations with NS and black squares represent JMML harboring PTPN11 mutations patients without NS. Dot plots represent mean ± standard error of the mean.
To confirm the relevance of our in vitro findings for JMML in vivo, miR-223 and miR-15a expression levels were measured in mononuclear cells isolated from the bone marrow of children with JMML harboring PTPN11, KRAS, NRAS or CBL mutations, with or without NS, as well as from controls (children in remission from acute leukemia)(Table S3). miR-223 and miR-15a levels were significantly increased among patients with germ-line or somatic PTPN11 mutations compared to controls (Figure 3D). Eleven of 19 JMML bone marrow mononuclear cells with PTPN11 mutations (~58%) showed increased expression of miR-223 and/or -15a, eight being increased for both. In contrast, miR-223 and miR-15a levels were not increased in the bone marrow mononuclear cells from patients with JMML with other RAS pathway somatic mutations.
Up-regulation of miR-223 is necessary and sufficient for JMML-associated abnormal myelopoiesis
To determine if up-regulation of miR-223 and -15a were necessary for the abnormal myelopoiesis observed in NS/JMML, we reduced their function using molecular decoys (Mullokandov et al., 2012). hiPSCs infected with decoy lentivirus expressing GFP retained pluripotency (Figure 4A). The majority of cells after hematopoietic differentiation continued to express GFP (Figure 4A, bottom row), indicating the presence of the decoy. In the miR-223 decoy-treated cells, the percentage of CD33+/GFP+ myeloid cells was significantly decreased in NS/JMML, achieving a level comparable to that observed with decoy-untreated control hiPSCs (Figure 4B). miR-15a decoy treatment did not alter the production of CD33+ cells (Figure 4C).
Figure 4. Functional Analyses for miR-223 and miR-15a Using Decoys and Over-Expression.

(A) GFP and immunofluorescence for OCT3/4 in infected hiPSCs with lentivirus containing a decoy construct for miR-223 or miR-15a. Bottom row shows GFP fluorescence in differentiated EBs containing a decoy construct for miR-223 or miR-15a. Scale bars represent 400 μm. (B–C) Flow cytometry analysis for CD33+ in GFP+ knocked-down cells (p <0.05 for all). Box-and-whisker plots show the median to the first and third quartiles and the minimum and maximum values. The CTRL group consisted of iPSC lines, each derived from different healthy individuals. (D) Number of CFU-GM colonies treated with 0.01 ng/ml GM-CSF in hiPSCs untreated and treated-decoy miR-223 (p <0.05 for all). (E) Decreased colony formation capacity in hematopoietic progenitors derived from NS/JMML hiPSCs containing a decoy construct for miR-223 (p <0.05 for all). (F) Representative immunofluorescence for NGFR and OCT3/4 in hiPSCs infected with a lentiviral construct over-expressing miR-223 (up-miR-223=over-expression miR-223). Scale bars represent 400 μm. (G) Flow cytometry analysis for CD33+/NGFR+ over-expressed miR-223 cells or without miR-223 (EMPTY=without miR-223) (p <0.05 for all). Box-and-whisker plots show the median to the first and third quartiles and the minimum and maximum values. Data represent a composite of three separate experiments. (H) Number of CFU-GM colonies treated with 0.01 ng/ml GM-CSF in hiPSC expressing miR-223 or not (p <0.05 for all). (I) Increased colony formation capacity in hematopoietic progenitors derived from NS/JMML hiPSCs containing a miR-223 over-expression construct. Bar graphs represent mean ± standard error of the mean (p <0.05 for all). Data represent a composite of three separate experiments.
Next, we sought to determine whether reduction of miR-223 rescued the GM-CSF hypersensitivity and hyper-proliferation of the NS/JMML myeloid progenitors. Using a low concentration of GM-CSF (0.01ng/mL), we observed a significant decrease in the number of colonies arising from the miR-223 decoy-treated NS/JMML cells as compared to untreated ones (Figure 4D). Compared to the control hiPSC-derived cells, the rescue of the GM-CSF hypersensitivity was partial. Using colony formation assays, we observed a decrease of the CFU-GM colony subtype in miR-223 decoy-treated NS/JMML cells (Figure 4E).
To determine whether up-regulation of miR-223 was sufficient to perturb myelopoiesis, control hiPSCs were infected with lentivirus expressing miR-223 (Baccarini et al., 2011). This vector expresses a pri-miR-223 transcript within an intron, which is upstream of a reporter encoding a truncated nerve growth factor receptor (NGFR). Pluripotency of the successfully infected hiPSCs was confirmed (Figure 4F). Over-expression of miR-223 in control and NS hiPSCs resulted in a 10–12% increase of the CD33+/NGFR+ population compare to those cells infected with the same lentiviral construct without miR-223 (Figure 4G). Moreover, we observed increased GM-CSF sensitivity and increased numbers of CFU-GM colonies in control hematopoietic cells over-expressing miR-223 (Figure 4H and I). Since over-expression of miR-223 alone up-regulated myelopoiesis in control hiPSCs, we concluded that PTPN11 mutation-driven up-regulation of miR-223 is sufficient to drive this aspect of JMML.
Effects of miR-223 and miR-15a up-regulation on mRNA levels in JMML
One of the major mechanisms by which miRNAs’ reduce protein expression is targeted degradation of mRNAs. To determine relevant targets of miR-223 and miR-15a in JMML, we performed an integrated analysis to look for reduced steady-state expression levels among genes predicted to be their targets in hiPSC-derived CD33+ myeloid cells (Figure S5A). Comparisons of expression among control and NS/JMML CD33+ myeloid cells revealed a significant number of potential miR-223 and miR-15a mRNA targets with reduced expression levels (Figure S5B). Permutation testing revealed that the number of putative miR-15a mRNA targets with reduced expression level was significantly greater than expected by chance (Figure S5C). Reduced levels of putative miR-223 targets were also observed but did not reach statistical significance. The set of genes predicted to be targets for both miRNAs was the most strikingly enriched.
To choose genes with the highest probability of being true targets of one or both of these miRNAs, calculations of thermodynamic accessibility and gene function were combined (Table S4). The lower steady-state levels of six putative target genes, two each from the miR-223 only, miR-15a only and miR-223/miR-15 groups, were confirmed using RT-PCR (Figure 5A). To establish genes that were bona fide targets of miR-223, we leveraged an in vitro system using HEK293 cells stably expressing miR-223 constitutively (called HEK293-miR223 hereafter) (Baccarini et al., 2011). Of note, native HEK 293 cells do not express miR-223. We generated constructs containing the 3′ UTR of miR-223 putative targets, RAB12 and FOXO3, including their putative miRNA target and mutated sites, inserted downstream of the firefly luciferase gene (Table S5). Expression of miR-223 with these 3′UTRs reduced luciferase expression approximately 50%, which was statistically significant (Figure 5B) and comparable to that observed in a previous study that established LMO2 and CEBP-β as miR-223 targets involved in myeloid cell development (Sun et al., 2010). We also confirmed that LMO2 and CEBP-β steady-state mRNA levels were reduced in NS/JMML CD33+ cells (Figure S5D). Mutations in the miR223-binding sites resulted in significantly less degradation of the 3′ UTR gene targets and sequence-specific suppression (Figure 5B). Taken as a whole, these results indicated that RAB12, and FOXO3 are true targets of miR-223.
Figure 5. miR-223 and miR-15a Target Genes: Validation in hiPSC-Derived CD33+ Cells and Expression levels in Bone Marrow Cells from JMML Patients.

(A) Confirmation of the expression level of selected miR-223 and miR-15a target genes in CD33+ cells using RT-qPCR. Bar graphs represent mean ± standard error of the mean (p <0.05 for all). (B) Luciferase activity of HEK293T cells or HEK293T cells over-expressing miR-223 transfected with a plasmid encoding luciferase without any 3′UTR sequence (pMIR.Report.Vector), and luciferase upstream of the RAB12 and FOXO3 3′ UTR normal and mutated sequences (p<0.05 for all)(Table S5). Bar graphs represent mean ± standard error of the mean. (C) Gene expression levels of targets for miR-223, miR-15a and both miRNAs in bone marrow mononuclear cells from JMML patients harboring PTPN11, KRAS, NRAS and CBL mutations (p<0.05 for all). Red and black squares represent JMML samples with or without NS, respectively. Dot plots represent mean ± standard error of the mean. See also Figure S5.
We leveraged the identification of bona fide targets of miR-223 to document the functional effects of the miR-223 decoy. Reduction of miR-223 function with the decoy would be predicted to increase the steady-state mRNA levels of miR-223 target genes, which is what was observed for RAB12 and FOXO3 in NS/JMML CD33+ myeloid cells (Figure S5E).
Finally, we examined the steady-state expression levels of thirteen putative and proven miR-223 and miR-15 target genes in PTPN11 and non-PTPN11-mutant JMML and control bone marrow mononuclear cells. Among those, nine (FOXO3, SPTB, NPM1, WHSC1K1, DICER1, MTL5, RAB12, SMAP1 and SHROOM4) were significantly reduced in PTPN11-mutant JMML (Figures 5C and S5F). Of note, these results suggest that the dysregulation of these genes are specific to PTPN11-associated JMML. Moreover, gene expression was similarly reduced among samples from patients with inherited and somatic PTPN11 mutations, suggesting similar JMML pathogenesis.
Discussion
In general, JMML remains a lethal disorder, and progress in treatment has been hindered by the lack of a robust model with which to study it. Taking this into account, our study represents an important advance in our understanding of JMML pathophysiology, providing a valuable model in the context of RASopathies, for several reasons. First, we used hiPSC technology as an alternative model for studying a myeloproliferative and myelodysplastic disorder, and our study had the key feature that it began with a non-hematopoietic cell type, skin fibroblasts. Although the hiPSCs used for our study harbored an activating RAS/MAPK pathway mutation, they should not have selected for secondary genomic alternations contributing to hematopoietic disease. A previous hiPSC study used circulating cancerous cells from two JMML patients (Gandre-Babbe et al., 2013). While valuable, this approach may not capture the earliest stages of JMML leukemogenesis. Here, we were able to establish hiPSC lines from NS and NS/JMML patients with germ-line mutations in specific residues of PTPN11 and then differentiate them into hematopoietic lineages to recapitulate seminal features of JMML. This study demonstrated that the pre-existing PTPN11 GOF mutations were sufficient to drive key features of this leukemogenesis. Moreover, NS- and JMML-associated PTPN11 missense mutations result in increased SHP-2 phosphatase activity, leading to increased ERK activation (Araki et al., 2004; Fragale et al., 2004). Similarly, ERK hyper-activation was present in our patient-derived hiPSCs as well as in the CD33+ myeloid cells differentiated from them. JMML-associated somatic PTPN11 mutations (E76K, D61V and D61Y) induce hematopoietic progenitor hypersensitivity to GM-CSF (Chan et al., 2005; Mohi et al., 2005). Similarly, our study showed that inherited PTPN11 NS/JMML-associated mutations (D61H and G503R) induced GM-CSF hypersensitivity. In contrast, the two PTPN11 mutations associated only with NS, Y63C and E76D, caused at most minimal GM-CSF hypersensitivity. In addition, the observation of STAT5 hyper-activation in the NS/JMML hiPSC-derived CD33+ myeloid cells suggested that increased STAT5 signaling may play a role in NS/JMML as it does in somatically acquired JMML (Kotecha et al., 2008). Our findings were also consistent with the observation that bone marrow cells from children with NS and transient myeloproliferative disorder are less responsive to STAT5 than similar cells from children with JMML (Kotecha et al., 2008). Taken together, our results provide further evidence that there is biological specificity and a severity gradient for the hematological defects underlying NS/JMML, arising from the degree of SHP-2’s destabilization, its interactions with signaling partners or PTPase-independent roles of SHP-2 (Tartaglia and Gelb, 2008). From a clinical point of view, this finding would suggest that genetic differences in PTPN11 encoded in the germline may explain why only a small percentage of NS patients get JMML.
Secondly, this study elaborated on the roles of miR-223 and miR-15a and their targets in mediating the JMML phenotype. Over the past decade, the study of microRNAs in leukemias has established the importance of these regulators for diagnosis, as prognostic factors and as therapeutic targets (Mian and Zeleznik-Le, 2010). It is worth noting that the up-regulation of miR-223 and miR-15a in nearly 60% of the JMML patients harboring PTPN11 mutations may facilitate subclassification of this disorder. Moreover, JMML outcomes have previously been shown to be worse when somatic PTPN11 mutations were the RAS pathway drivers (Yoshida et al., 2009). Our work provides a specific molecular mechanism that might explain that clinical difference and creates opportunities for developing targeted therapies. Specifically, inhibitors and regulators of miR-223 could be used to treat JMML involving dysregulation of the RAS/MAPK pathway. In addition, miR-223 and/or miR-15a target genes, which were down-regulated in the NS/JMML CD33+ myeloid cells as well in bone marrow samples from JMML patients with PTPN11 mutations, could also be leveraged to develop new therapies.
In summary, our present study showed dysregulation in myeloid cells derived from NS/JMML hiPCS and elucidated a molecular mechanism underlying aspects of JMML in the context of NS, identifying up-regulation of two microRNAs as potential biomarkers in JMML bone marrow mononuclear cells. Their up-regulation distinguished JMML caused by PTPN11 mutations from others genetic forms of the disease.
Experimental Procedures
Generation of hiPCS lines and myeloid differentiation
Fibroblasts were reprogrammed based on a protocol using retroviruses expressing separately human c-MYC, OCT3/4, SOX2 and KLF4 (Figure S1 and Table S1) (Carvajal-Vergara et al., 2010). To induce differentiation, embryoid bodies (EBs) were generated in 6-well, ultra-low attachment plates in differentiation media consisting of a basic media with different cytokines as described previously (Figure S2)(Grigoriadis et al., 2010; Kennedy et al., 2007). See also Supplemental Experimental Procedures for more details.
Flow cytometric, cell sorting, apoptosis and proliferation assays
Flow cytometric analyses were performed at Day 14 of differentiation on hematopoietic cells harvested from dissociated EBs (Table S2). Cells were stained in phosphate-buffered saline and 2% FBS with primary antibodies against CD45, CD14, CD33, CD11b, CD71, CD235a and CD41 (BD Pharmingen), and analyzed on an LSR-II (BD Biosciences). Apoptosis and proliferation were quantified as CD33+ cells that were Annexin V+/Death dye- (PerCP-Cy; BD Pharmingen and Blue Pacific Invitrogen) and Ki67+ (BD Pharmingen), respectively. Data were analyzed using FlowJo software, Version 7.6.
CFU assay and cytospin
For cytokine sensitivity assays, hematopoietic cells (Table S2) were plated at 2×10⁴ in methylcellulose (MethoCult® H4531, Stem Cell Technologies) with escalating concentration of GM-CSF (0.01, 0.1, 1 and 10 ng/mL) (R&D) or 1.5×10⁴ in methylcellulose containing agar leukocyte conditioned medium (Agar-LCM), formulated to support the growth of granulocyte and macrophage progenitors. The hypersensitivity to GM-CSF was observed in a dose-response curve, represented as percentage of maximal colony formation and calculated by dividing the number of colonies at each GM-CSF concentration by the average number of colonies at GM-CSF 10 ng/mL (Table S2). For decoy and over-expression miR-223 assays, the treated hematopoietic cells were plated at 2×10⁴ with 0.01 ng/mL GM-CSF (Table S2). After 14 days at 37 °C in humidified 5% CO2, myeloid colonies were counted. For clonogenic myeloid progenitor assays, MethoCult® H4435 Enrich (Stem Cell Technologies) were used. Fourteen days after plating, myeloid and erythroid colonies were counted based on standard guidelines previously described (Nissen-Druey et al., 2005). Cell morphology was assessed using a Cytospin 3 cytocentrifuge (Thermo Fisher Scientific) and staining with Giemsa (Accustain, Sigma-Aldrich).
Treatment with GM-CSF and immunoblotting
Flow-sorted CD33+ cells were treated with GM-CSF (1 ng/mL) for 15 min at 37 °C (Table S2). The 937 cell line was used as a control for STAT5 phosphorylation assays (10 ng/mL of GM-CSF). Cells were lysed with RIPA buffer containing protease and phosphatase inhibitors. Blots were probed with antibodies to p-STAT5 (1:250, BD Pharmingen), STAT5 (1:1000, Cell Signaling), p-ERK1/2 T202/Y204 (1:2000, Cell Signaling), ERK1/2 (1:2500, Santa Cruz Biotechnology) and β-ACTIN (1:10000, Sigma-Aldrich) (loading control). To measure ERK levels in undifferentiated hiPSCs, the cells were treated with 10 ng/mL hEGF for 0, 5, 15 and 60 min at 37 °C.
MicroRNA RT-qPCR
MicroRNA expression levels were quantified in total RNA from sorted CD33+ cells isolated using Trizol and MiRNase kit (Qiagen)(Table S2). TaqMan human miRNA assays were used to quantify mature miRNA expression levels as previously described (Chen et al., 2005). U6 (Applied Biosystems) was used as the endogenous control. Reverse transcriptase reactions contained 10 ng of total RNA, 50 nM RT primer, 1x RT buffer, 0.25 mM each of dNTPs, 3.33 U/ml MultiScribe reverse transcriptase and 0.25 U/ml RNase inhibitor. The 7.5 μl reactions were incubated in an Applied Biosystems 9700 Thermocycler in a 96 well plate for 30 min at 16°C, 30 min at 42°C, 5 min at 85°C and then held at 4°C. All reverse transcriptase reactions were run in triplicate. Real-time PCR was performed using a standard TaqMan PCR kit protocol on an Applied Biosystems 9700 Thermocycler. The 10 μl PCR included 0.67 μl RT product, 1xTaqMan Universal PCR Master Mix, 0.2 mM TaqMan probe. The reactions were incubated in a 96-well plate at 95°C for 10 min, followed by 40 cycles of 95°C for 15s and 60°C for 1 min. All reactions were run in triplicate. All TaqMan miRNA assays are available through Applied Biosystems.
Decoys and over-expression assays for miR-223 and miR-15a
For the decoy assay, we used the ‘tough decoy’ (TuD) design previously described (Mullokandov et al., 2012). Briefly, AB.pCCLsin.PPT.U6.hPGK.GFP.wpre was used as a backbone vector with two target sites for miR-223 or -15a expressing EGFP to mark infected hiPSCs. Lentivirus production and titration were performed as previously described (Mullokandov et al., 2012). For the miR-223 over-expression, we used the third generation self-inactivating lentiviral vector platform. The lentiviral vector (LV) encoded hsa-miR-223 and a truncated nerve growth factor receptor (NGFR) as previously described (Baccarini et al., 2011). hiPSCs were infected for 24 h and sorted three days later for GFP+ and NGFR-PE+ expression for the decoy and over-expression functional assays, respectively. These cells were cultured using the same conditions as the original hiPSCs. The infected cells were differentiated, and flow cytometry, GM-CSF sensitivity and colony formation assays were performed and analyzed as described above. In sorted CD33+ treated with decoys, RNA was isolated and RT-PCR was performed for target genes as previously described in the Reverse Transcription Quantitative and Conventional PCR Analysis section.
Luciferase assay in HEK293-miR-223 cells
To analyze the regulation of the putative target FOXO3 and RAB12 by miR-223, we generated constructs using pMIR-Report-Vector. These vectors express Firefly luciferase and the 3′ UTR sequences of FOXO3 and RAB12 by miR-223 (see sequence details in Table S5). We used the same vector without a 3′ UTR as a negative control. The mutated binding site was generated by directed mutagenesis as indicated the manufacture’s provider (Invitrogen). 1.5 × 10⁵ HEK293T cells or HEK293T expressing constitutively miR-223 were transfected with these constructs with Lipofectamine 2000 (Invitrogen). For normalization, a plasmid encoding Renilla luciferase was included in the transfection in each condition. Luciferase activity was detected with a Dual Luciferase Reporter kit (Promega) 48 h after transfection.
Statistical analysis
For overlapping gene sets and correlation patterns between miRNAS and their targets genes, p-values were calculated from different permutation and statistical approaches (n>=10,000) to assess the overlap significance between different gene sets. Additional statistical analyses were performed with Prism 5.0 (Graph Pad Software) using ANOVA and T-test. p values <0.05 were considered statistically significant. The number of stars indicates the significance level *<0.05, **<0.01, ***<0.001 and ****<0.0001.
Supplementary Material
Acknowledgments
We would like to thank Dr. Deepak Srivastava (Gladstone Institute, University of California, San Francisco) for providing CTRL3 and CTRL4 hiPSC lines and Dr. Xonia Carvajal-Vergara for providing CTRL5 hiPSC line. We would like to thank Dr. Yves Bertrand (IHOP, Lyon, France) and Dr. Maryline Poirée (CHR Nice, France) for providing samples from their patients and Marie-Laurence Menot (St. Louis Hospital, Paris, France) for technical help.
Footnotes
The authors have no conflicting or competing financial interests.
Author contributions
S.M-N. hiPSC lines establishment and characterization, design and performed the experiments and preparation of manuscript; A.S. microarray analysis and miRNAs expression; A.C.R. microarray analysis and microRNA targets prediction; G.Y. microarray analysis; D-F.L. GSEA analysis and Southern blotting; J.S. Southern blotting; S.P. hiPSC lines establishment and partial characterization; S.D’S. technical support and CTRL2 hiPSC line establishment and characterization; I.R., K.A.M., C.Y.P., S.Y. and D.P. technical support; N.C. karyotype and BCR-ABL analyses; L.E. and S.B. karyotype analysis; C.S. teratomas; A.B and B.D.B technical support for functional analysis of miRNAs; N.R. directed mutagenesis assay P.R, E.F. and M.T. obtaining of fibroblast samples from patients; H.C., A.C. and M.S. obtaining of fibroblast and bone marrow samples from patients; I.R.L. and B.D.G. design and supervision of this research work and preparation of manuscript. This work was supported by grants from NYSTEM (C024407 to B.D.G), NIH (HL071207 to B.D.G.), AIRC (13360 and 17583 to M.T.) and Telethon (GGP13107 to M.T.).
Publisher's Disclaimer: This is a PDF file of an unedited manuscript that has been accepted for publication. As a service to our customers we are providing this early version of the manuscript. The manuscript will undergo copyediting, typesetting, and review of the resulting proof before it is published in its final citable form. Please note that during the production process errors may be discovered which could affect the content, and all legal disclaimers that apply to the journal pertain.
References
- Araki T, Mohi MG, Ismat FA, Bronson RT, Williams IR, Kutok JL, Yang W, Pao LI, Gilliland DG, Epstein JA, et al. Mouse model of Noonan syndrome reveals cell type- and gene dosage-dependent effects of Ptpn11 mutation. Nature Med. 2004;10:849–857. doi: 10.1038/nm1084. [DOI] [PubMed] [Google Scholar]
- Baccarini A, Chauhan H, Gardner TJ, Jayaprakash AD, Sachidanandam R, Brown BD. Kinetic analysis reveals the fate of a microRNA following target regulation in mammalian cells. Curr Biol. 2011;21:369–376. doi: 10.1016/j.cub.2011.01.067. [DOI] [PMC free article] [PubMed] [Google Scholar]
- Carvajal-Vergara X, Sevilla A, D’Souza SL, Ang YS, Schaniel C, Lee DF, Yang L, Kaplan AD, Adler ED, Rozov R, et al. Patient-specific induced pluripotent stem-cell-derived models of LEOPARD syndrome. Nature. 2010;465:808–812. doi: 10.1038/nature09005. [DOI] [PMC free article] [PubMed] [Google Scholar]
- Chan RJ, Leedy MB, Munugalavadla V, Voorhorst CS, Li Y, Yu M, Kapur R. Human somatic PTPN11 mutations induce hematopoietic-cell hypersensitivity to granulocyte-macrophage colony-stimulating factor. Blood. 2005;105:3737–3742. doi: 10.1182/blood-2004-10-4002. [DOI] [PMC free article] [PubMed] [Google Scholar]
- Chen C, Ridzon DA, Broomer AJ, Zhou Z, Lee DH, Nguyen JT, Barbisin M, Xu NL, Mahuvakar VR, Andersen MR, et al. Real-time quantification of microRNAs by stem-loop RT-PCR. Nucl Acids Res. 2005;33:e179. doi: 10.1093/nar/gni178. [DOI] [PMC free article] [PubMed] [Google Scholar]
- Chen CZ, Li L, Lodish HF, Bartel DP. MicroRNAs modulate hematopoietic lineage differentiation. Science. 2004;303:83–86. doi: 10.1126/science.1091903. [DOI] [PubMed] [Google Scholar]
- Fragale A, Tartaglia M, Wu J, Gelb BD. Noonan syndrome-associated SHP2/PTPN11 mutants cause EGF-dependent prolonged GAB1 binding and sustained ERK2/MAPK1 activation. Hum Mut. 2004;23:267–277. doi: 10.1002/humu.20005. [DOI] [PubMed] [Google Scholar]
- Gandre-Babbe S, Paluru P, Aribeana C, Chou ST, Bresolin S, Lu L, Sullivan SK, Tasian SK, Weng J, Favre H, et al. Patient-derived induced pluripotent stem cells recapitulate hematopoietic abnormalities of juvenile myelomonocytic leukemia. Blood. 2013;121:4925–4929. doi: 10.1182/blood-2013-01-478412. [DOI] [PMC free article] [PubMed] [Google Scholar]
- Grigoriadis AE, Kennedy M, Bozec A, Brunton F, Stenbeck G, Park IH, Wagner EF, Keller GM. Directed differentiation of hematopoietic precursors and functional osteoclasts from human ES and iPS cells. Blood. 2010;115:2769–2776. doi: 10.1182/blood-2009-07-234690. [DOI] [PMC free article] [PubMed] [Google Scholar]
- Kennedy M, D’Souza SL, Lynch-Kattman M, Schwantz S, Keller G. Development of the hemangioblast defines the onset of hematopoiesis in human ES cell differentiation cultures. Blood. 2007;109:2679–2687. doi: 10.1182/blood-2006-09-047704. [DOI] [PMC free article] [PubMed] [Google Scholar]
- Kotecha N, Flores NJ, Irish JM, Simonds EF, Sakai DS, Archambeault S, Diaz-Flores E, Coram M, Shannon KM, Nolan GP, et al. Single-cell profiling identifies aberrant STAT5 activation in myeloid malignancies with specific clinical and biologic correlates. Cancer Cell. 2008;14:335–343. doi: 10.1016/j.ccr.2008.08.014. [DOI] [PMC free article] [PubMed] [Google Scholar]
- Kotini AG, Chang CJ, Boussaad I, Delrow JJ, Dolezal EK, Nagulapally AB, Perna F, Fishbein GA, Klimek VM, Hawkins RD, et al. Functional analysis of a chromosomal deletion associated with myelodysplastic syndromes using isogenic human induced pluripotent stem cells. Nature Biotechnol. 2015;33:646–655. doi: 10.1038/nbt.3178. [DOI] [PMC free article] [PubMed] [Google Scholar]
- Mian YA, Zeleznik-Le NJ. MicroRNAs in leukemias: emerging diagnostic tools and therapeutic targets. Curr Drug targets. 2010;11:801–811. doi: 10.2174/138945010791320872. [DOI] [PMC free article] [PubMed] [Google Scholar]
- Mohi MG, Williams IR, Dearolf CR, Chan G, Kutok JL, Cohen S, Morgan K, Boulton C, Shigematsu H, Keilhack H, et al. Prognostic, therapeutic, and mechanistic implications of a mouse model of leukemia evoked by Shp2 (PTPN11) mutations. Cancer Cell. 2005;7:179–191. doi: 10.1016/j.ccr.2005.01.010. [DOI] [PubMed] [Google Scholar]
- Mullokandov G, Baccarini A, Ruzo A, Jayaprakash AD, Tung N, Israelow B, Evans MJ, Sachidanandam R, Brown BD. High-throughput assessment of microRNA activity and function using microRNA sensor and decoy libraries. Nature Methods. 2012;9:840–846. doi: 10.1038/nmeth.2078. [DOI] [PMC free article] [PubMed] [Google Scholar]
- Nissen-Druey C, Tichelli A, Meyer-Monard S. Human hematopoietic colonies in health and disease. Acta Haematol. 2005;113:5–96. doi: 10.1159/000081987. [DOI] [PubMed] [Google Scholar]
- Perez B, Mechinaud F, Galambrun C, Ben Romdhane N, Isidor B, Philip N, Derain-Court J, Cassinat B, Lachenaud J, Kaltenbach S, et al. Germline mutations of the CBL gene define a new genetic syndrome with predisposition to juvenile myelomonocytic leukaemia. J Med Genet. 2010;47:686–691. doi: 10.1136/jmg.2010.076836. [DOI] [PubMed] [Google Scholar]
- Ramkissoon SH, Mainwaring LA, Ogasawara Y, Keyvanfar K, McCoy JP, Jr, Sloand EM, Kajigaya S, Young NS. Hematopoietic-specific microRNA expression in human cells. Leuk Res. 2006;30:643–647. doi: 10.1016/j.leukres.2005.09.001. [DOI] [PubMed] [Google Scholar]
- Sun W, Shen W, Yang S, Hu F, Li H, Zhu TH. miR-223 and miR-142 attenuate hematopoietic cell proliferation, and miR-223 positively regulates miR-142 through LMO2 isoforms and CEBP-beta. Cell Res. 2010;20:1158–1169. doi: 10.1038/cr.2010.134. [DOI] [PubMed] [Google Scholar]
- Takahashi K, Tanabe K, Ohnuki M, Narita M, Ichisaka T, Tomoda K, Yamanaka S. Induction of pluripotent stem cells from adult human fibroblasts by defined factors. Cell. 2007;131:861–872. doi: 10.1016/j.cell.2007.11.019. [DOI] [PubMed] [Google Scholar]
- Tartaglia M, Gelb BG. RAS signaling defects and Noonan syndrome. In: Epstein CJ, Erickson RP, Wynshaw-Boris AJ, editors. Inborn Errors of Development: The Molecular Basis of Clinical Disorders of Morphogenesis. New York: Oxford University Press; 2008. pp. 620–631. [Google Scholar]
- Vasilatou D, Papageorgiou S, Pappa V, Papageorgiou E, Dervenoulas J. The role of microRNAs in normal and malignant hematopoiesis. Eur J Haematol. 2010;84:1–16. doi: 10.1111/j.1600-0609.2009.01348.x. [DOI] [PubMed] [Google Scholar]
- Yoshida N, Doisaki S, Kojima S. Current management of juvenile myelomonocytic leukemia and the impact of RAS mutations. Paediatr Drugs. 2012;14:157–163. doi: 10.2165/11631360-000000000-00000. [DOI] [PubMed] [Google Scholar]
- Yoshida N, Yagasaki H, Xu Y, Matsuda K, Yoshimi A, Takahashi Y, Hama A, Nishio N, Muramatsu H, Watanabe N, et al. Correlation of clinical features with the mutational status of GM-CSF signaling pathway-related genes in juvenile myelomonocytic leukemia. Pediatr Res. 2009;65:334–340. doi: 10.1203/PDR.0b013e3181961d2a. [DOI] [PubMed] [Google Scholar]
Associated Data
This section collects any data citations, data availability statements, or supplementary materials included in this article.