Abstract
Fanconi anemia (FA) patients develop bone marrow (BM) failure or leukemia. One standard care for these devastating complications is hematopoietic stem cell transplantation. We identified a group of mesenchymal stromal cells (MSCs)-derived metabolites, glycerophospholipids and their endogenous inhibitor, 5-(Tetradecyloxy)-2-furoic acid (TOFA), as regulators of donor hematopoietic stem and progenitor cells (HSPCs). We provided two pieces of evidence that TOFA could improve hematopoiesis-supporting function of FA MSCs: (1) limiting-dilution CAFC assay revealed that TOFA significantly increased cobblestone colonies in Fanca−/− or Fancd2−/− co-cultures compared to untreated co-cultures. (2) Competitive repopulating assay using output cells collected from co-cultures showed that TOFA greatly alleviated the abnormal expansion of the donor myeloid (CD45.2+Gr1+Mac1+) compartment in both peripheral blood and BM of recipient mice transplanted with cells from Fanca−/− or Fancd2−/− co-cultures. Further, mechanistic studies identified Tlr4 signaling as the responsible pathway mediating the effect of glycerophospholipids. Thus, targeting Glycerophospholipid biosynthesis in FA MSCs could be a therapeutic strategy to improve hematopoiesis and stem cell transplantation.
Introduction
Fanconi anemia (FA) is an inherited disorder associated with hematopoietic aplasia and cancer predisposition.1–3 FA is genetically heterogeneous and the clinical phenotypes associated with FA are the result of deficiency of any of the sixteen FA genes (FANCA-Q).4–7 Although physical signs appear from birth and early childhood, bone marrow (BM) failure is typically seen between ages 5 to 15 and in later ages leading to myeodysplatic syndrome and acute myeloid leukemia.8–10 One standard care for these devastating complications is hematopoietic stem cell transplantation (HSCT). However, little is known about the interaction between healthy donor HSCs and FA BM microenvironment (niche). Recent HSC-BM niche interaction studies have demonstrated that nestin-expressing mesenchymal stromal cells (MSCs) constitute an essential HSC niche component.11,12 Adipocytes, one of the niche compartments act as predominantly negative regulators of HSCs13; while osteoblasts and chrondroblasts are known to support HSCs.14 Although the role of majority of these cellular constituents forming the niche in the BM is becoming clear, the metabolism of these cell types in the context of hematopoietic support during disease state is still unclear.
To address this question, we employed an untargeted metabolomics approach that provides a comprehensive platform to identify metabolites whose levels are altered between wild-type (WT) and FA MSCs. Metabolomics has become a powerful technique for understanding the small-molecule basis of biological processes either in physiological or pathological conditions.15 We show here that a group of MSCs-derived metabolites, glycerophospholipids and their endogenous inhibitor, 5-(Tetradecyloxy)-2-furoic acid (TOFA), are aberrantly produced by FA MSCs. To investigate the effect of these metabolites on hematopoietic-supporting function, we have modeled FA HSCT by employing ex vivo co-culture followed by cobblestone area-forming cell (CAFC) and BM transplantation (BMT) assays and demonstrated that suppression of glycerophospholipid biosynthesis by TOFA or Lipin1 knockdown rescued differentiation skew of donor HSC and progenitor cells (HSPCs).
Methods
Mice
Fanca+/− and Fancd2+/− mice (C57BL/6: B6, CD45.2+) were provided by Dr. Madeleine Carreau (Laval University) and Dr. Markus Grompe (Oregon Health & Sciences University), respectively.16,17 Tlr2−/−, Tlr4−/−18, and MyD88−/−19 mice on C57BL/6 background were kindly provided by Drs. Senad Divanovi, Khurana Hershey, and Kasper Hoebe, respectively at CCHMC with the permission of Shizuo Akira at Osaka University, Osaka, Japan. All the animals including BoyJ (C57BL/6: B6, CD45.1+,) recipient mice were maintained in the animal barrier facility at Cincinnati Children’s Hospital Medical Center. Mice used for the experiments were 8–12 week-old. All experimental procedures conducted in this study were approved by the Institutional Animal Care and Use Committee of Cincinnati Children’s Hospital Medical Center.
Mesenchymal stromal cell (MSC) culture and treatment
Bone marrow (BM) cells isolated from wild-type (WT), Fanca+/− and Fancd2+/− mice were gently flushed out of tibias and femurs using DPBS + 10% FBS. RBCs were lysed using red blood cell lysis buffer. Cells obtained from two tibias and two femurs were plated in 100mm culture dish (BD Falcon) in 10 ml of MSCs media. MSCs media was prepared with Iscove’s Modified Dulbecco’s Medium (IMDM, Invitrogen # 12440-053), 20% Bovine Calf Serum (BCS, Hyclone # SH30072.03), Epidermal growth factor (rmEGF - 10ng/ml; R&D Systems # 2028-EG-200), Platelet-Derived Growth Factor (rhPDGF -200ng/ul; R&D Systems # 220-BB-010), 1% Penicillin-Streptomycin (Life Tech # 15140-122), 10−4mol/L 2-mercaptoethanol (Life Tech # 21985-023). Plastic adherent cells were passaged 3 times and were analyzed for MSCs purity using flow cytometry with cell surface markers positive for CD90 and negative for CD45 and CD34. Cells were further stained with antibodies Osteopontin, Fabp4, and Collagen II to identify osteoblasts, adipocytes, chondroblasts respectively20, using the Mouse MSC Functional Identification Kit (R&D Systems # SC010). At least 98% MSC purity was obtained with this culture method.
MSCs at passages three were plated to obtain 95% confluence. Cells were pre-treated with 2mM 5-(Tetradecyloxy)-2-furoic acid (TOFA) (Sigma # T6575) for 48 hrs, followed by coculture in fresh media with WT LSK cells. For experiments with PE (1,2-Dipalmitoyl-sn-glycero-3-phosphoethanolamine), WT LSK cells were treated with 0.5mM PE (Sigma # P1348) for 24hrs.
Cobble stone Area Forming Cell assay (CAFC)
Confluent WT, Fanca−/− and Fancd2−/− MSCs in 35mm culture dish (BD Falcon) were overlaid with WT BMMCs to allow the precursor cells forming hematopoietic clones under the stromal layers. The cells were cocultured at 37°C, 5% CO2 and were fed weekly by changing half of the medium. Phase-dark hematopoietic clone was imaged under phase contrast images were taken at 20× objective and the area was analyzed with image J software.
Limited dilution assay
Limiting dilution assay (LDA) of a LSK cells included the use of five dilutions (0, 10, 30, 90, 270, and 810) differing with a factor of 3, and 10 wells per cell concentration. Three different LDA experiments were performed with independently derived MSCs from WT, Fanca−/−, and Fancd2−/− mice. A well was scored as “positive” if contained one or more cobblestone areas and “negative” if contained no cobblestone areas. Cobblestone area is at least 6 cells (in proximity of each other) growing underneath the stroma. Although cobblestone-like cells appear as phase dark, these cells appear as nonrefractile in 96-well plates because of the deflection of light. Only dilutions with both negative and positive wells are informative for frequency analysis.
Bone Marrow Transplantation
In the competitive repopulation study, 1×10⁵ output cells (CD45.2) collected from cocultures were mixed with 3×10⁵ competitor cells (CD45.1), and injected into lethally irradiated (split dose of 700Rad + 475Rad with 3hrs apart) Boy J mice (CD45.1). After 16 weeks, the recipient mice were sacrificed, and nucleated cells from peripheral blood and the BM were analyzed were stained with CD45.2 and CD45.1 for chimeras and Gr1, Mac1, B220, and CD3e for lineage.
Metabolome profiling
Metabolites were extracted from three independently derived, ≥ 98% pure Fanca−/−, Fancd2−/−, and WT MSCs. MSCs were washed with ice cold DPBS twice to remove any culture media. Cells were collected into 300μl LC/MS-grade H2O containing 1mM HEPES and 1mM EDTA (pH 7.2). Samples were vortexed for 30 seconds, and incubated 1–2 minutes in boiling water and subsequently in LN2 for 1 min. Samples were then thawed on ice and normalized based on the protein content. 2ml of −20°C metabolite extraction solution containing Methanol, Acetonitrile and H2O at a ratio of 2:2:1 was added to each sample and vortexed for 1min. Samples were then incubated at 4°C for 30mins. Samples were centrifuged at 1500×g for 10mints. The supernatants (~2mL total) were pooled in an HPLC vial (Sigma# 27115-U) and dried under forced N2 at room temp before reconstituted for LC-Q-TOF-MS analysis. All pure standards were purchased from Sigma Aldrich. Samples were resuspended in 50 μL of 50:50 water/acetonitrile solutions for mass spectrometry analysis. Untargeted metabolomics was performed on the MSCs extract to identify metabolites whose levels are altered in Fanca−/− and Fancd2−/− compared to WT. Samples were analyzed at Scripps Center for Metabolomics and Mass Spectrometry, La Jolla, California. By using liquid chromatography quadrupole time-of-flight mass spectrometry (LC-Q-TOF-MS), hundreds of peaks with a unique m/z ratio and retention time were detected in Fanca−/−, Fancd2−/− and WT MSCs. Each peak, termed a metabolomic feature, is characterized on the basis of its accurate mass, retention time and tandem mass spectral fragmentation pattern by using the METLIN metabolite database. The data was then analyzed with the bioinformatics program XCMS Online,21 widely used XCMS software that is freely available at https://xcmsonline.scripps.edu.
Results
FA MSCs impairs WT HSPC self-renewal and induces myeloid expansion
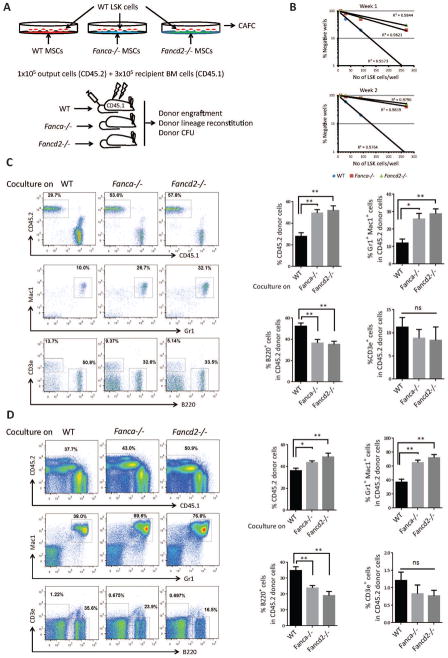
We first established an ex vivo co-culture to examine the effect of Fanca−/− or Fancd2−/− MSCs on wild-type (WT) HSPCs (Figure 1A). Limiting-dilution cobblestone area-forming cell (CAFC) assay22 with graded numbers of flow sorted WT LSK (Lin-Sca1+cKit+) cells shows that the frequency of CAFC, both at week 1 and week 2, was significantly reduced in co-cultures on Fanca−/− or Fancd2−/− MSCs compared to those on WT MSCs (Figures 1B and supplemental Figure 1A,B), indicating that Fanca−/− and Fancd2−/− MSCs compromise HSPC self-renewal capacity. To evaluate the repopulating ability of the co-cultured HSPCs in vivo, we performed competitive repopulation assay using 1×10⁵ output cells that had been co-cultured for one week on WT, Fanca−/−, or Fancd2−/− MSCs, along with 3×10⁵ fresh BM competitor cells. At 16 weeks post-transplantation, the frequency of donor-derived cells, presumably the progenies of the output HSPCs, in the peripheral blood (PB) of mice that received cells co-cultured on Fanca−/− or Fancd2−/− MSCs was significantly increased compared with mice that received cells co-cultured on WT MSCs (p=0.0003 for Fanca−/− vs WT and for p=0.0001 Fancd2−/− vs WT; Figure 1C). Remarkably, we observed a dramatic expansion of donor myeloid lineage in PB of mice transplanted with cells co-cultured on Fanca−/− or Fancd2−/− MSCs compared to WT controls (25.88%, 28.83% and 11.93% for Fanca−/−, Fancd2−/− and WT, respectively; Figure 1C). Similar increase in both total donor engraftment (49.4%, 51.88% and 27.8% for Fanca−/−, Fancd2−/− and WT, respectively) and myeloid expansion (65.18%, 72.15% and 37.05% for Fanca−/−, Fancd2−/− and WT, respectively) was also observed in the BM of recipients transplanted with cells co-cultured on Fanca−/− or Fancd2−/− MSCs compared with mice that received cells co-cultured on WT MSCs (Figure 1D). Consistently, Colony-forming unit assay using donor-derived (CD45.2+) BM cells from 16-week post-transplant mice revealed a marked expansion of myeloid progenitor populations in mice transplanted with cells co-cultured on Fanca−/− or Fancd2−/− MSCs (supplemental Figure1C). Collectively, these results indicate that Fanca−/− and Fancd2−/− MSCs exert a dramatic effect on the self-renewal and differentiation of ex vivo co-cultured WT HSPCs.
Figure 1. Fanca−/− and Fancd2−/− MSCs impairs WT HSPC self-renewal and induces myeloid expansion.
(A) Schematic representation of the ex vivo coculture experiments. WT LSK (Lin-Sca1+c-kit+) cells isolated by FACS were cultured on confluent stromal layers of WT, Fanca−/− or Fancd2−/− MSCs followed by in CAFC or BM transplantation (BMT). (B) Limited dilution analysis of CAFC assay. Assay was conducted in a flat bottom 96 well plate with confluent MSCs before plating the sorted LSK cells. Cultures were maintained in 40% methyl cellulose medium for two weeks and the colonies were counted on week 1 and 2. Group of at least 6 phase dim cells were counted as one colony. (C) Abnormal myeloid expansion of WT HSPCs cocultured on Fanca−/− or Fancd2−/− MSCs in peripheral blood of irradiated recipient mice. 1×10⁵ WT output cells (CD45.2+) collected after coculturing on WT, Fanca−/− or Fancd2−/− MSCs for five days, along with 3×10⁵ recipient BM cells (CD45.1+), were injected into each lethally irradiated recipient mouse. Donor chimerism and lineage reconstitution in peripheral blood of the recipients were examined at 4 months post transplantation. Representative flow plots (Left) and quantifications (Right) are shown. Results are means plus or minus SD of 3 independent experiments (n=9 per group). (D) Abnormal myeloid expansion of WT HSPCs cocultured on Fanca−/− or Fancd2−/− MSCs in the BM of irradiated recipient mice. Flow analysis of donor chimerism and lineage reconstitution in the BM of the recipients, described in (C), at 4 months post-BMT. Representative flow plots (Left) and quantifications (Right) are shown. Results are means plus or minus SD of 3 independent experiments (n=9 per group). *P<0.05, **P<0.01, ***P<0.001, ns: not significant. Error bars represent mean ± SD.
Metabolome profile reveals abnormal glycerophospholipid biosynthesis in Fanca−/− and Fancd2−/− MSCs
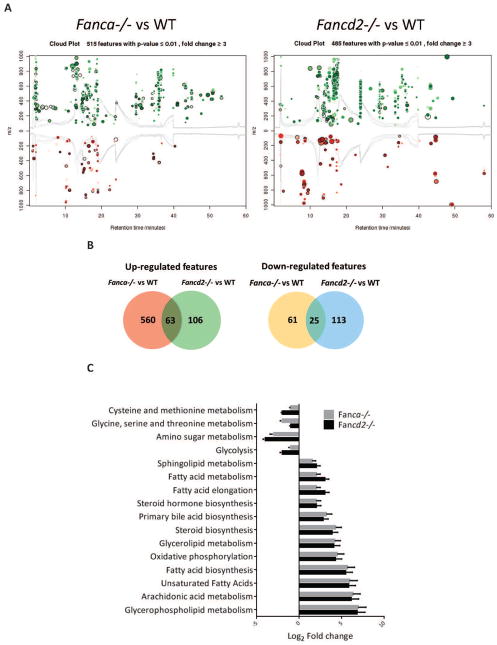
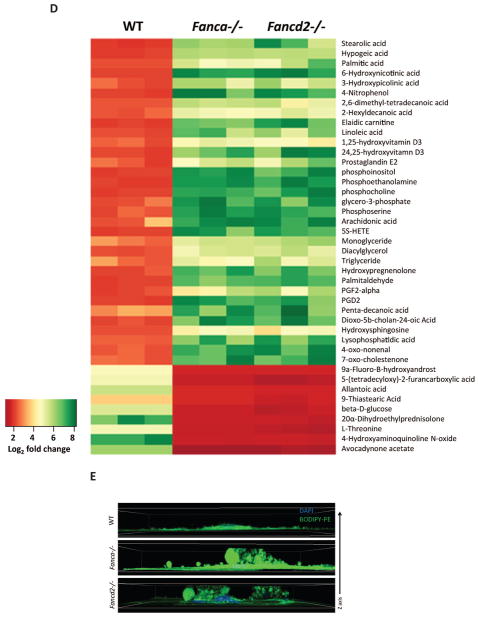
Since metabolites produced by MSCs in the BM niche are vital to HSC function, we performed untargeted metabolic profile to screen the entire metabolome of MSCs by liquid chromatography quadrupole time-of-flight mass spectrometry (LC-Q-TOF-MS).15 This global metabolic platform identified 200–600 metabolites upregulated and 60–150 metabolites downregulated in Fanca−/− or Fancd2−/− MSCs compared to WT MSCs (Figures 2A,B). Significantly, metabolites in the glycerophospholipid pathway showed the highest upregulated fold change (150-fold in Fanca−/− and 120-fold in Fancd2−/− MSCs) (Figures 2C,D). Furthermore, immunofluorescence staining of MSCs showed elevated level of PE (1,2-Dipalmitoyl-sn-glycero-3-phosphoethanolamine), one of the major metabolites in the glycerophospholipid pathway in Fanca−/− or Fancd2−/− MSCs compared to WT MSCs (Figures 2E). Very little is known about the effect of this group of phospholipids on hematopoiesis23; however, a recent report demonstrates that Lysophosphatidic acid, a pleiotropic phospholipid induces myeloid but not lymphoid differentiation in CD34+ human hematopoietic progenitors.24
Figure 2. Metabolome profile of Fanca−/− and Fancd2−/− MSCs reveals abnormal glycerophospholipid biosynthesis.
(A) Cloud plot presentation of metabolite features of Fanca−/− MSCs vs WT MSCs and Fancd2−/− MSCs vs WT MSCs with fold change ≥ 3 and pValue≤0.01. The statistical significance of the fold change was calculated by a Welch t test with unequal variances. Up-regulated features (features that have a positive fold change) are graphed above the x-axis in green while down-regulated features (features that have a negative fold change) are graphed below the x-axis in red. The x-axis represents retention time. The y-axis represents mass-to-charge (m/z) ratio. Features with higher fold change have larger radii. Features with lower p-value have higher color intensity. (B) Venn diagram demonstrating the separate and overlapping metabolite features in Fanca−/− and Fancd2−/− MSCs compared to WT MSCs showing both up and down regulated with fold change≥3 and pValue≤0.01. (C) Summary plot for metabolite set enrichment analysis (MSEA) where metabolic pathways are ranked according to Log2 fold change with the cut off p-value ≤0.01. (D) Heat map of significantly altered metabolite features up and down regulated in both Fanca−/− and Fancd2−/− MSCs plotted against Log2 fold change (Metabolite extraction for the metabolome profile was done from independently derived MSCs). (E) Immunofluorescence of MSCs. WT, Fanca−/−, and Fancd2−/− MSCs were stained with BODIPY-PE and DAPI. The images were the Z-stack images captured with Nikon C2+ confocal microscope.
TOFA suppresses lipid biosynthesis in Fanca−/− and Fancd2−/− MSCs
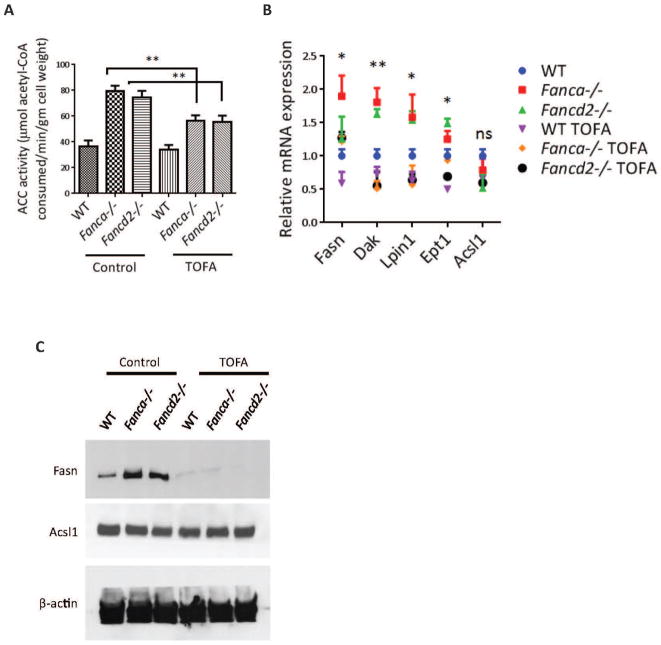
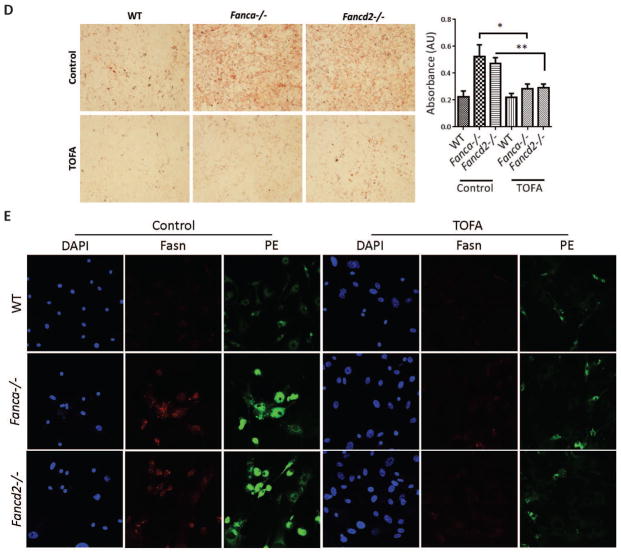
To examine the effect of the elevated glycerophospholipids on HSC function, we hypothesized that targeted reduction of these lipids might improve hematopoietic-supporting function of FA MSCs. In searching for utility to reduce glycerophospholipids in FA MSCs, we identified TOFA, one of downregulated metabolites in both Fanca−/− and Fancd2−/− MSCs (12-fold in Fanca−/− and 10-fold in Fancd2−/− MSCs) (Figure 2D). TOFA inhibits the activity of acetyl-CoA carboxylase,25,26 a rate-limiting enzyme in lipid synthesis that catalyzes the conversion of acetyl-CoA to malony-CoA. We performed five independent assays to confirm the effectiveness of TOFA in suppressing lipid biosynthesis in Fanca−/− and Fancd2−/− MSCs: (1) TOFA suppressed Acetyl-CoA carboxylase (ACC) activity by enzyme assay (Figure 3A); (2) TOFA inhibited the expression of genes involved in glycerophospholipid biosynthesis by q-PCR (Figure 3B); (3) TOFA reduced the levels of Fasn but not Acsl1, Fasn is the major enzyme involved in glycerophospholipid biosynthesis by Western blot (Figure 3C); (4) TOFA repressed the biosynthesis of total lipids by Oil Red O staining (Figure 3D); and (5) TOFA decreased the levels of Fasn and PE by immunofluorescence staining (Figure 3E).
Figure 3. TOFA suppresses lipid biosynthesis in Fanca−/− and Fancd2−/− MSCs.
(A) TOFA suppresses Acetyl-CoA carboxylase (ACC) activity in MSCs. Independently derived WT, Fanca−/−, and Fancd2−/− MSCs were treated with or without 8μM TOFA for 48 hrs before measuring the ACC enzyme activity. The levels of acetyl-CoA remaining in each sample were determined using a citrate synthase assay, in which the formation of the yellow compound dithiobisnitrobenzoic acidthiophenolate was measured spectrophotometrically at 412 nm. ACC Activity was expressed as μM acetyl-CoA consumed/min/gm dry cell weight. (B) Relative gene expression of genes involved in glycerophospholipid biosynthesis. Total mRNA was collected from MSCs either treated with or without 8μM TOFA for 48 hrs. mRNA expression levels of the enzymes involved in the glycerophospholipid synthesis pathway were measured. Significance is seen between TOFA treated and untreated Fanca−/− or Fancd2−/− MSCs. (C) Western blot of MSCs. Protein lysates were collected from MSCs treated with or without 8μM TOFA for 48 hrs. Lysate was then subjected to 8% Protein gel separation and blotted for Fasn, Acsl1 antibodies, while β-actin was probed as loading control. (D) Oil Red O staining of MSCs. 48hrs after TOFA treatment, MSCs were stained with Oil Red O stain to image the total lipids synthesized in the cells. Representative images (Left; 100× magnification) and quantifications (Right) are shown. Absorbance of Oil Red O stain collected from the stained cells by dissolving in 100% isopropanol was measured at 500nm and blanked to 100% isopropanol. (E) Immunofluorescence of MSCs. MSCs treated with or without 8μM TOFA were stained for Fasn antibody, BODIPY-PE, and DAPI. The images were captured with Nikon C2+ confocal microscope (600× magnification). *P<0.05, **P<0.01, ns: not significant. Error bars represent mean ± SD.
TOFA partially corrects the effects of FA MSC cells on self-renewal and differentiation
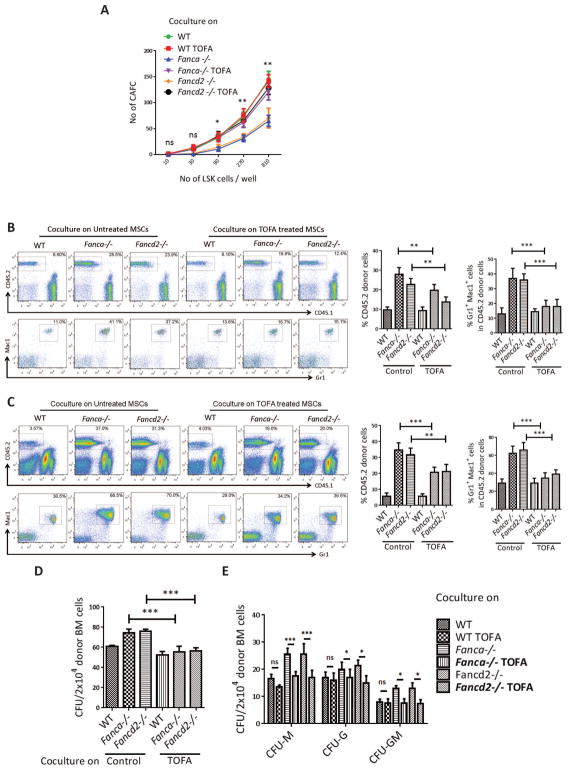
We next determined whether TOFA could restore or improve the hematopoiesis-supporting function of FA MSCs. We conducted two sets of experiments to examine the effect of TOFA on MSC-dependent HSC function. First, we used limiting-dilution CAFC assay to evaluate the self-renewal capacity of the co-cultured LSK cells on WT, Fanca−/−, or Fancd2−/− MSCs that had been treated with or without TOFA for 48 hrs. TOFA increased the number of cobblestone colonies in Fanca−/− and Fancd2−/− co-cultures to WT levels (Figure 4A). Second, we performed competitive repopulating assay using using approximately 1×10⁵ output cells collected from co-cultures treated with or without TOFA. Four months later, we analyzed donor engraftment in both peripheral blood and the BM. The cells from Fanca−/− and Fancd2−/− co-cultures produced about 2–3-fold more donor chimerism in peripheral blood compared to WT co-cultures, and pre-treatment of the Fanca−/− and Fancd2−/− MSCs with TOFA resulted in 30–50% reduction of donor chimerism (Figure 4B,C). Therefore, reduction of donor chimerism by TOFA was likely due to its inhibitory effect on the expansion of the myeloid cells rather than on self-renewal capacity of the donor HSCs. Moreover, TOFA greatly alleviated the abnormal expansion of the donor myeloid (Gr1+Mac1+) compartment in both the peripheral blood and BM of recipient mice transplanted with cells from Fanca−/− and Fancd2−/− co-cultures (Figure 4B,C). Consistently, TOFA significantly inhibited the proliferation of donor-derived (CD45.2) total (Figure 4D) and myeloid (Figure 4E) progenitors isolated from the BM of recipient mice. These data show that the endogenous acetyl-CoA carboxylase inhibitor TOFA corrects the defect of the Fanca−/− and Fancd2−/− MSCs and support the notion that the aberrant myeloid explosion is resulted from elevated levels of lipid metabolites, including PE, in FA MSCs.
Figure 4. TOFA suppresses abnormal differentiation of HSCs into myeloid cells.
(A) TOFA rescues stemness of cocultured WT HSPCs. Confluent WT, Fanca−/− or Fancd2−/− MSCs were pretreated with TOFA (8μM) for 48 hrs, and graded numbers of flow sorted WT LSK were plated on confluent stromal layers of WT, Fanca−/− or Fancd2−/− MSCs. Scoring of Cobblestone area as endpoint was determined after 7 days. (B) TOFA prevents abnormal expansion of donor myeloid cells in peripheral blood of irradiated recipient mice. Confluent WT, Fanca−/− or Fancd2−/− MSCs were pre-treated with TOFA (8μM) for 48 hrs, and flow sorted WT LSK were added to the cultures. Five days later, 1×10⁵ WT output cells (CD45.2+) were collected and, along with 3×10⁵ recipient BM cells (CD45.1+), injected into each lethally irradiated recipient mouse. Donor chimerism and lineage reconstitution in peripheral blood of the recipients were examined at 4 months post transplantation. Representative flow plots (Left) and quantifications (Right) are shown. Results are means plus or minus SD of 3 independent experiments (n=9 per group). (C) TOFA prevents abnormal expansion of donor myeloid cells in the BM of irradiated recipient mice. Flow analysis of donor chimerism and lineage reconstitution in the BM of the recipients, described in (A), at 4 months post-BMT. Representative flow plots (Left) and quantifications (Right) are shown. Results are means plus or minus SD of 3 independent experiments (n=9 per group). (D) CFU of donor-derived (CD45.2+) bone marrow cells. 2×10⁴ BMMCs isolated from transplant recipients, described in (A), at 4 months post-BMT were plated in triplicates (n=3–5 recipient mice). CFU is the total count of BFU-E, CFU-M, CFU-G, CFU-GM, CFU-GEMM, and Pre-B colonies. (E) CFU of progenitor lineages having significant difference. *P<0.05, **P<0.01, ***P<0.001, ns: not significant. Error bars represent mean ± SD.
To determine whether overexpression of glycerophopsholipids in normal MSCs could cause similar defect in hematopoiesis as with FA MSCs, we performed experiments in which WT MSCs were treated with or without adipogenic supplement to induce Fabp (Fatty acid binding protein), which is known to activate PPARγ leading to increased fatty acid metabolism and over-production of glycerophpholipids 27–29 (Supplemental Fig 2). The expression levels of Fabp in adipogenic supplement-treated WT MSCs were compared to those in Fanca−/− and Fancd2−/− MSCs without treatment by immunostaining using an antibody against the Fabp protein. The immunofluorescence levels of Fabp show that adipogenic supplement effectively induced Fabp expression in WT MSCs to a level that was comparable to untreated FA MSCs (Supplemental Fig 3A). Induction of Fabp in treated WT MSCs led to elevated production of glycerophospholipids, as determined by BODIPY-PE immunofluorescence staining (Supplemental Fig 3B), and decreased frequency of cobblestone area-forming cells (CAFC) of co-cultured LSK cells, as analyzed by the CAFC assay (Supplemental Fig 3C). These results indicate that over-production of glycerophospholipids impairs hematopoiesis-supporting function of WT MSCs, mimic of the phenotype observed in Fanca−/− or Fancd2−/− MSCs.
Lipin 1 knockdown prevents myeloid expansion by correcting the defects of FA MSCs
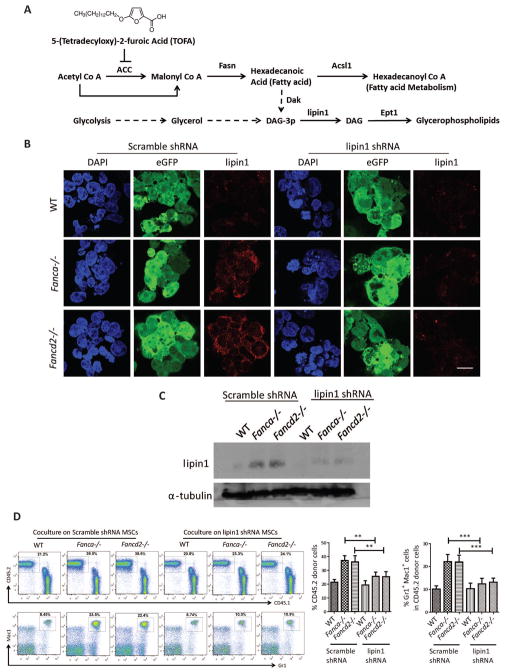
To genetically demonstrate the role of glycerophospholipids in MSC function, we depleted Lipin1, a proximal enzyme that converts Diacyl glycerol to PE and other Glycerophosholipids30 (Figure 5A), using lentiviral shRNA. Baseline Lipin1 was higher in both Fanca−/− and Fancd2−/− MSCs, and the Lipin1 shRNA effectively reduced the levels of Lipin1 proteins, as analyzed by immunofluorescence (Figure 5B) and western blotting (Figure 5C). Like TOFA treatment, Lipin1 knockdown in Fanca−/− and Fancd2−/− MSCs also reduced PE biosynthesis to WT levels (data not shown). We next determined whether Lipin1 knockdown was capable of recapitulating the effect of TOFA on co-cultured HSPCs. Indeed, Lipin1 knockdown effectively prevented myeloid expansion in transplant recipients of Fanca−/− or Fancd2−/− MSC-supporting cells (Figures 5D). These genetic data thus corroborate the notion that elevated lipid biosynthesis in Fanca−/− and Fancd2−/− MSCs is associated with myeloid expansion observed in co-cultured cells.
Figure 5. Lipin1 shRNA knockdown in Fanca−/− or Fancd2−/− MSCs supresses myeloid proliferation of cocultured LSK cells.
(A) Schematic presentation of de novo synthesis of glycerophospholipids. TOFA inhibits the activity of ACC by blocking the conversion of Acetyl-CoA to Malonyl-CoA, a major substrate for glycerophospholipid biosynthesis. (B) Immunofluorescence of MSCs infected with lentiviruses. MSCs were transduced with lentivirus encoding a non-targeting shRNA (Scramble) or shRNAs targeting lipin1 (lipin1). Nucleus was stained with DAPI. Lentivirus expression was shown as eGFP. Lipin1 was shown as red. The images were captured with Nikon C2+ confocal micrscope. The scale bar represents 20μM. (C) Western blot analysis of MSCs infected with lentiviruses. Protein lysates were collected from MSCs infected with scramble shRNA and lipin1 shRNA lentiviruses. Lysate was then subjected to 8% Protein gel separation and blotted for lipin1, while α-tubulin was probed as loading control. (D) Flow analysis of peripheral blood for chimera and cell lineage after 16week post-BMT. Competitive repopulating assay was done with 1×10⁵ WT output cells (CD45.2+) collected from cocultures on transduced WT, Fanca−/− or Fancd2−/−MSCs for five days, along with 3×10⁵ recipient BM cells (CD45.1), were injected into each lethally irradiated recipient mouse. Donor chimerism and lineage reconstitution in peripheral blood of the recipients were examined at 4 months post transplantation. Representative flow plots (Left) and quantifications (Right) are shown. Results are means plus or minus SD of 3 independent experiments (n= 6 – 9 mice per condition). *P<0.05, **P<0.01, ***P<0.001, ns: not significant. Error bars represent mean ± SD.
Tlr4 signaling mediates the effect of glycerophospholipids on HSPC function
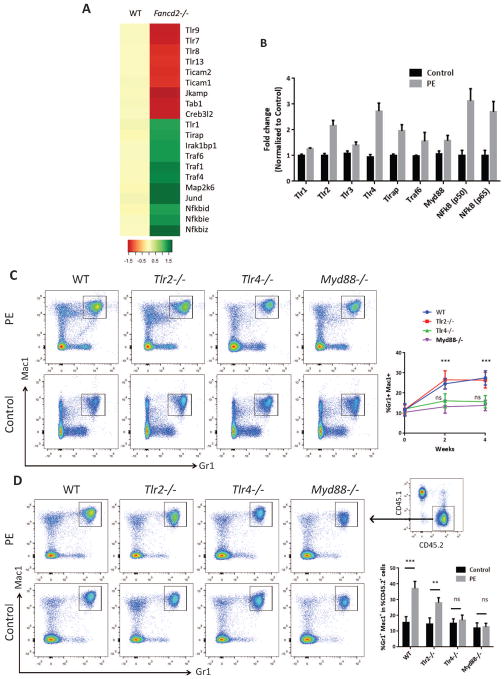
To understand the mechanism involved in myeloid skewing of HSCs induced by MSC-derived glycerophospholipids, we analyzed our microarray data obtained with freshly isolated phenotypic HSC (CD150+CD48−LSK; SLAM) cells from WT and Fancd2−/− mice (accession number GSE64215 at http://www.ncbi.nlm.nih.gov/geo/). We employed Significance Analysis of Microarrays with the criteria of at least a 1.5 fold change in expression to identify genes as being up or down regulated in Fancd2−/− SLAM population. Gene set enrichment analysis identified significant enhancement of Toll-like receptor (TLR) signaling in Fancd2−/− SLAM cells compared with WT cells (Figure 6A). To evaluate the effect of glycerophospholipids on HSPC function, we focused on one of glycerophospholipids, PE, because it was one of the highly produced metabolites in FA MSCs (Figure 2D,E). We first treated sorted LSK cells with or without 1mM PE for 24hrs and performed qRT-PCR for major genes in the TLR signaling pathway. Enhancement of Tlr4 signaling and its downstream targets was evident in HSCs after PE treatment (Figure 6B). In addition, Tlr2 and MyD88 were also upregulated in HSCs upon PE treatment. To genetically validate the involvement of TLR signaling pathway, we treated mice deficient for Tlr2, Tlr4 or MyD88 with PE. Peripheral blood was collected for analysis at two and four weeks post-injection. PE treatment induced a greater production of Gr1+and Mac1+ cells in the blood of Tlr2−/− and wild-type mice compared to Tlr4−/− and MyD88−/− mice (Figure 6C). To assess the effect of glycerophospholipids on HSC differentiating activity, we performed competitive repopulation assays using whole bone marrow from WT, Tlr2−/−, Tlr4−/−, and Myd88−/− mice (CD45.2) either treated or untreated with 1mM PE for 24hrs. Equal numbers of CD45.2 and untreated bone marrow cells from Boy J mice (CD45.1) were mixed and transplanted into lethally irradiated Boy J mice. Analysis of lineage reconstitution at 8 weeks post-transplant showed that PE phenocopied the effect of Fanca−/− and Fancd2−/− MSCs on wild-type and Tlr2−/− donor cells but not on Tlr4−/− or MyD88−/− cells. That is, PE significantly increased myeloid lineage repopulation in recipient mice transplanted with wild-type and Tlr2−/− donor cells compared to those transplanted with Tlr4−/− or MyD88−/− cells (Figure 6D). These data indicate that Tlr4 signaling contributes to the glycerophospholipid-mediated myeloid skew of HSC differentiation (Figure 7).
Figure 6. Glycerophospholipids alters HSC differentiation through Tlr4 signaling.
(A) Heat map presentation of the toll like receptor signaling pathway from microarray analysis of LSK – SLAM cells from WT and Fancd2−/− mice (accession number GSE64215 at http://www.ncbi.nlm.nih.gov/geo/). (B) Relative gene expression of genes involved in response to PE treatment. Total mRNA was collected from WT LSKs either treated with or without 1mM PE for 24 hrs. mRNA expression levels of the genes involved in the response to PE as ligand were normalized to the housekeeping gene GAPDH. (C) Peripheral blood analysis from WT, Tlr2−/−, Tlr4−/−, Myd88−/− mice intrafemorally injected with either 1mM PE or phosphate-buffered saline (PBS) alone and analyzed for Gr1+ and Mac1+ cells by flow cytometry at 2 and 4 weeks post injections. Representative flow plots (Left) and quantifications (Right) are shown. Results are means plus or minus SD of 3 independent experiments (n= 9 per group). (D) Abnormal myeloid expansion of WT and Tlr2−/− but not Tlr4−/−, and Myd88−/− HSPCs treated with 1mM PE in peripheral blood of irradiated recipient mice. 1×10⁵ WT, Tlr2−/−, Tlr4−/−, and Myd88−/− (CD45.2) LSK cells pre-treated with or without (Control) 1,2-Dipalmitoyl-sn-glycero-3-phosphoethanolamine (PE; 1mM) for 24hrs, along with 3×10⁵ recipient BM cells (CD45.1), were injected into each lethally irradiated recipient mouse. Donor chimerism and lineage reconstitution in peripheral blood of the recipients were examined at 8 weeks post transplantation after stable hematopoietic reconstitution was established. Representative flow plots (Left) and quantifications (Right) are shown. Gr1+Mac1+ cells were analyzed from CD45.2 donor derived cells as shown in the insert. Results are means plus or minus SD of 3 independent experiments (n=9 per group). *P<0.05, **P<0.01, ***P<0.001. Error bars represent mean ± SD.
Figure 7. Model of glycerophosholipids-activated Tlr4-MyD88 signaling in HSC differentiation.
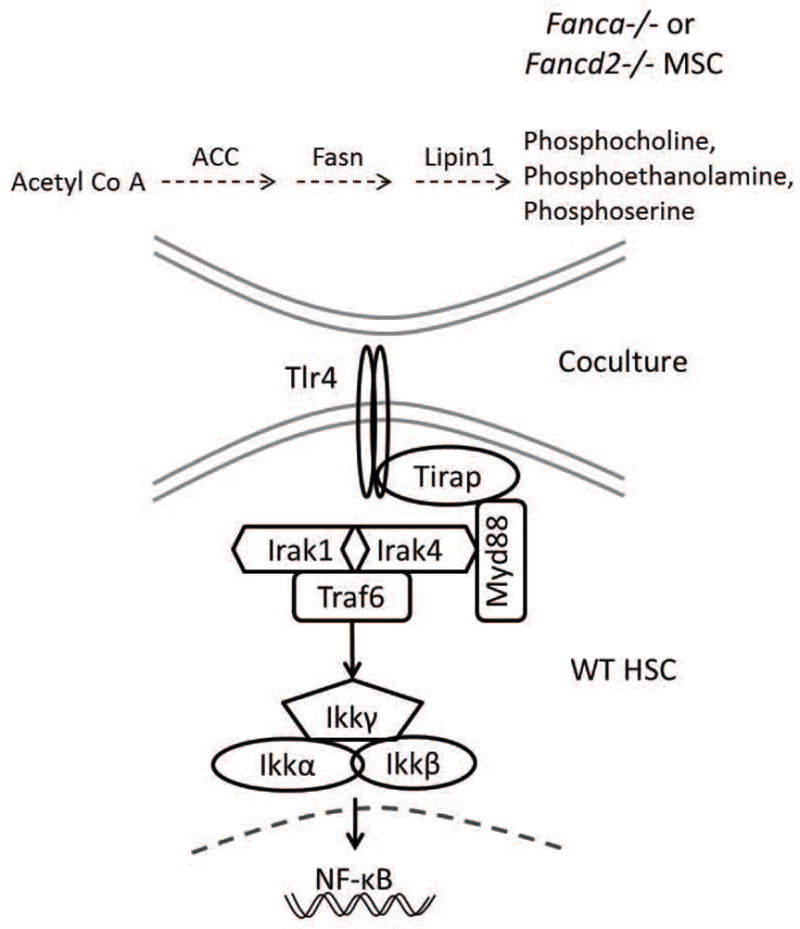
Overproduced glycerophosholipids, including phosphocholine (PC), phosphoethanolamine (PE) and phosposerine (PS), in Fanca−/− and Fancd2−/− MSCs may act as ligands to activate Tlr4 receptor in co-cultured WT HSC. Tlr4 in turn signals through MyD88 to activate an NF-kB transcriptional program that leads to upregulation of myeloid-specific gene expression and consequently abnormal myeloid differentiation.
Discussion
In this study, we used integrated metobolome, genetic and functional approaches to identify and a group of FA MSCs-derived metabolites, glycerophospholipids and their endogenous inhibitor as regulators of donor HSPCs in an experimental transplant model. FA is a major inherited BM failure syndrome with extremely high risk of developing acute myeloid leukemia. The only curable treatment for this devastating disease is stem cell and gene therapies through HSCT. However, the effects of metabolic alterations of transplant recipient BM niche on donor HSCs have been underappreciated, and it remains unclear whether the metabolites released by the recipient niche into the BM are responsible for signaling directly to the mechanisms driving donor HSCs into abnormal differentiation and/or leukemia initiation. Our current study aimed at identifying critical donor HSC-niche interaction regulators in a significant health-care setting, and thus would lead to an improved mechanistic understanding of donor HSC maintenance in the context of HSCT.
It has been shown in several studies that the stromal feeder layer can be used to support HSC expansion and maintain quiescence both in vivo and in vitro.31–33 To understand the hematopoiesis-supporting role of FA stromal cells, we modeled FA HSCT by employing ex vivo co-culture followed by CAFC and BM transplantation assays. Although it is speculated that the environment beneath and/or niche atmosphere created by healthy MSC layer can keep HSCs in an immature state, it was demonstrated that human CD34+CD38- HSCs prefer to migrate through the MSC layer.33 We hypothesized that the HSC-MSC interaction in the ex vivo co-culture model has an impact on HSC differentiation. Indeed, the true cobble stone formation (phase-dim cells) was reduced by MSCs derived from the Fanca−/− or Fancd2−/− BM, indicating the loss of the stemness of the WT HSCs when co-cultured with the FA niche. Further, transplantation of the WT HSCs co-cultured on FA MSCs into lethally irradiated WT recipient mice showed skew differentiation of these co-cultured HSCs towards myeloid lineage, suggesting potential myeloid transformation induced by the FA niche. Significantly, with TOFA treatment and lipin1 knockdown in FA niche this myeloid-skewing phenotype was reversed, indicating a crucial role of phospholipids produced by FA MSCs in affecting the function of healthy HSCs. Although phospholipids have been traditionally considered as membrane lipids and their roles in cell signaling are yet to be discovered, our findings and emerging data24 implicate a role of phospholipids in hematologic malignancies making the glycerophosholipid biosynthesis pathway potentially a novel therapeutic target in blood cancer that can be manipulated. In addition, we showed that genetic knockdown of Lipin1 could also ameliorate the myeloid-skewing phenotype induced by elevated glycerophosholipids. Lipin1 is a key enzyme having dual role in glycerophosholipid biosynthesis and adipocyte maturation and maintenance by modulating the C/EBPα (CCAAT/enhancer-binding protein α) and PPARγ (peroxisome-proliferator-activated receptor γ) network.34,35
Our mechanistic study suggests the involvement of Toll-like receptor signaling in mediating the effect of FA MSC-derived glycerophosholipids on HSC differentiation. It has been reported that although the activation of Tlr signaling pathway did not affect the overall health of the mice, HSCs from the BM were unable to maintain quiescence and myeloid skewed upon BM transplantation.36 TLR2 and TLR4 utilize TIRAP and MyD88 as adaptor proteins to engage in transducing the signal to downstream molecules and activate the NF-κB pathway.37,38 Genome-wide chromatin immunoprecipitation (CHIP)-Seq analysis of H3K4me3 in BM CD34+ cells derived from MDS patients identified a large majority of pathogenic genes involved in TLR-mediated innate immunity signaling and NF-kB activation.39 Expression of many of TLRs (TLR1, 2, 6, 7, 9, 10, RP105) in B cells have been identified that mediate proliferation, plasma cell differentiation and antiapoptotic effects in B cells but only TLR4 and 8 was noted as a possibility.40 TLR4-mediated signaling has been implicated in a variety of cancers responsible for tumor cell invasion, survival, and metastasis. Studies involving loss of TLR4 suggest several beneficial roles that could inhibit proliferation and survival of breast cancer cells41, play a protective role in radiation-induced thymic lymphoma42, and reduce the risk of acute GVHD.43 TLR4 and TLR7/8 induced overproduction of p38 mitogen-activated protein kinase (MAPK)-dependent tumor necrosis factor α (TNFα) was also linked to certain extent to BM failure in FA.44,45 We postulate that FA MSCs overproduce a group of glycerophosholipids including phosphocholine (PC), phosphoethanolamine (PE) and phosposerine (PS), which activates Tlr4 in HSCs. Tlr4 in turn signals through MyD88 to activate an NF-kB transcriptional program that leads to upregulation of myeloid-specific gene expression (Figure 7). In support of this notion, 52 of 76 AML cases from different studies have shown constitutive activation of NF-kB associated with permanent activation of the IkB kinase complex.46 Further, a combination of TLR4 and 7/8 agonists were used for the production of dendritic cells, which were derived from AML cells in order to use in the immunotherapy of AML patients.47 Several studies were devoted in transforming inhibition of NF-kB as to model the strategy of clinical trials.48–51 Whether this constitutive activation of Tlr4 in HSCs is caused by a direct binding or by indirect effect of the FA MSC-derived glycerophosholipids requires further investigation.
In summary, our results show that the endogenous acetyl-CoA carboxylase inhibitor TOFA partially corrects the defects of FA MSCs and indicate that elevated levels of lipid metabolites produced by FA MSCs, including Glycerophosholipids, are associated with aberrant myeloid expansion. Our studies suggest that targeting Glycerophospholipid biosynthesis either by TOFA or modulating Lipin1 in FA MSCs could be a therapeutic strategy to improve hematopoiesis and stem cell transplantation for FA patients.
Supplementary Material
Key Points.
Elevated levels of Glycerophospholipids impairs hematopoietic supporting function of FA MSCs
Inhibition of glycerophospholipid biosynthesis in FA MSCs by TOFA treatment or Lipin1 knockdown suppresses myeloid expansion
Glycerophospholipids regulate HSC differentiation through Tlr4 signaling
Significance Statement.
Elevated levels of Glycerophospholipids impairs hematopoietic supporting function of Fanconi Anemia Mesenchymal Stromal Cells. Inhibition of glycerophospholipid biosynthesis in Fanconi Anemia Mesenchymal Stromal Cells by 5-(Tetradecyloxy)-2-furoic acid treatment or Lipin1 knockdown suppresses myeloid expansion. Glycerophospholipids regulate Hematopoietic Stem Cell differentiation through Toll-like receptor 4 signaling.
Acknowledgments
We thank Dr. Madeleine Carreau (Laval University) for Fanca+/− mice, Dr. Markus Grompe (Oregon Health & Sciences University) for Fancd2+/− mice, the Comprehensive Mouse and Cancer Core of the Cincinnati Children’s Research Foundation (Cincinnati Children’s Hospital Medical Center) for BM transplantation service, and the Vector Core of the Cincinnati Children’s Research Foundation (Cincinnati Children’s Hospital Medical Center) for the preparation of lentiviruses. We also thank Bill Webb from Scripps Center for Metabolomics and Mass Spectrometry in La Jolla, CA for performing metabolome profiling. This investigation was supported by NIH grants R01 HL076712, R01 CA157537 and T32 HL091805. Q.P. is supported by a Leukemia and Lymphoma Scholar award.
Footnotes
Conflict-of-interest disclosure: The authors declare no competing financial interests.
Contribution: S. A. designed and performed research, analyzed data, and wrote the paper; M. S. performed research and analyzed data; A. W. performed research and analyzed data; and X. L. performed research and analyzed data; Q. P. designed research, contributed vital new reagents, analyzed data, and wrote the paper.
References
- 1.Bagby GC., Jr Genetic basis of Fanconi anemia. Curr Opin Hematol. 2003;10(1):68–76. doi: 10.1097/00062752-200301000-00011. [DOI] [PubMed] [Google Scholar]
- 2.Shimamura A, Alter BP. Pathophysiology and management of inherited bone marrow failure syndromes. Blood Rev. 2010;24(3):101–122. doi: 10.1016/j.blre.2010.03.002. [DOI] [PMC free article] [PubMed] [Google Scholar]
- 3.Kee Y, D’Andrea AD. Molecular pathogenesis and clinical management of Fanconi anemia. J Clin Invest. 2012;122(11):3799–3806. doi: 10.1172/JCI58321. [DOI] [PMC free article] [PubMed] [Google Scholar]
- 4.Deans AJ, West SC. DNA interstrand crosslink repair and cancer. Nat Rev Cancer. 2011;11(7):467–480. doi: 10.1038/nrc3088. [DOI] [PMC free article] [PubMed] [Google Scholar]
- 5.Kottemann MC, Smogorzewska A. Fanconi anaemia and the repair of Watson and Crick DNA crosslinks. Nature. 2013;493(7432):356–363. doi: 10.1038/nature11863. [DOI] [PMC free article] [PubMed] [Google Scholar]
- 6.Walden H, Deans AJ. The Fanconi anemia DNA repair pathway: structural and functional insights into a complex disorder. Annu Rev Biophys. 2014;43:257–278. doi: 10.1146/annurev-biophys-051013-022737. [DOI] [PubMed] [Google Scholar]
- 7.Du W, Erden O, Pang Q. TNF-alpha signaling in Fanconi anemia. Blood Cells Mol Dis. 2014;52(1):2–11. doi: 10.1016/j.bcmd.2013.06.005. [DOI] [PMC free article] [PubMed] [Google Scholar]
- 8.Bagby GC, Alter BP. Fanconi anemia. Semin Hematol. 2006;43(3):147–156. doi: 10.1053/j.seminhematol.2006.04.005. [DOI] [PubMed] [Google Scholar]
- 9.Soulier J. Fanconi anemia. Hematology Am Soc Hematol Educ Program. 2011;2011:492–497. doi: 10.1182/asheducation-2011.1.492. [DOI] [PubMed] [Google Scholar]
- 10.Wilson DB, Link DC, Mason PJ, Bessler M. Inherited bone marrow failure syndromes in adolescents and young adults. Ann Med. 2014;46(6):353–363. doi: 10.3109/07853890.2014.915579. [DOI] [PMC free article] [PubMed] [Google Scholar]
- 11.Mendez-Ferrer S, Michurina TV, Ferraro F, et al. Mesenchymal and haematopoietic stem cells form a unique bone marrow niche. Nature. 2010;466(7308):829–834. doi: 10.1038/nature09262. [DOI] [PMC free article] [PubMed] [Google Scholar]
- 12.Voog J, Jones DL. Stem cells and the niche: a dynamic duo. Cell Stem Cell. 2010;6(2):103–115. doi: 10.1016/j.stem.2010.01.011. [DOI] [PMC free article] [PubMed] [Google Scholar]
- 13.Naveiras O, Nardi V, Wenzel PL, Hauschka PV, Fahey F, Daley GQ. Bone-marrow adipocytes as negative regulators of the haematopoietic microenvironment. Nature. 2009;460(7252):259–263. doi: 10.1038/nature08099. [DOI] [PMC free article] [PubMed] [Google Scholar]
- 14.Morrison SJ, Scadden DT. The bone marrow niche for haematopoietic stem cells. Nature. 2014;505(7483):327–334. doi: 10.1038/nature12984. [DOI] [PMC free article] [PubMed] [Google Scholar]
- 15.Schultz AW, Wang J, Zhu Z-J, Johnson CH, Patti GJ, Siuzdak G. Liquid Chromatography Quadrupole Time-of-Flight Characterization of Metabolites Guided by the METLIN Database. Nature protocols. 2013;8(3):451–460. doi: 10.1038/nprot.2013.004. [DOI] [PMC free article] [PubMed] [Google Scholar]
- 16.Wong JC, Alon N, McKerlie C, Huang JR, Meyn MS, Buchwald M. Targeted disruption of exons 1 to 6 of the Fanconi Anemia group A gene leads to growth retardation, strain-specific microphthalmia, meiotic defects and primordial germ cell hypoplasia. Hum Mol Genet. 2003;12(16):2063–2076. doi: 10.1093/hmg/ddg219. [DOI] [PubMed] [Google Scholar]
- 17.Houghtaling S, Timmers C, Noll M, et al. Epithelial cancer in Fanconi anemia complementation group D2 (Fancd2) knockout mice. Genes Dev. 2003;17(16):2021–2035. doi: 10.1101/gad.1103403. [DOI] [PMC free article] [PubMed] [Google Scholar]
- 18.Takeuchi O, Hoshino K, Kawai T, et al. Differential Roles of TLR2 and TLR4 in Recognition of Gram-Negative and Gram-Positive Bacterial Cell Wall Components. Immunity. 1999;11(4):443–451. doi: 10.1016/s1074-7613(00)80119-3. [DOI] [PubMed] [Google Scholar]
- 19.Adachi O, Kawai T, Takeda K, et al. Targeted Disruption of the MyD88 Gene Results in Loss of IL-1- and IL-18-Mediated Function. Immunity. 1998;9(1):143–150. doi: 10.1016/s1074-7613(00)80596-8. [DOI] [PubMed] [Google Scholar]
- 20.Dominici M, Le Blanc K, Mueller I, et al. Minimal criteria for defining multipotent mesenchymal stromal cells. The International Society for Cellular Therapy position statement. Cytotherapy. 2006;8(4):315–317. doi: 10.1080/14653240600855905. [DOI] [PubMed] [Google Scholar]
- 21.Patti GJ, Tautenhahn R, Rinehart D, et al. A view from above: cloud plots to visualize global metabolomic data. Anal Chem. 2013;85(2):798–804. doi: 10.1021/ac3029745. [DOI] [PMC free article] [PubMed] [Google Scholar]
- 22.de Haan G, Ploemacher R. The Cobblestone-Area-Forming Cell Assay. In: Klug C, Jordan C, editors. Hematopoietic Stem Cell Protocols. Vol. 63. Humana Press; 2002. pp. 143–151. [DOI] [PubMed] [Google Scholar]
- 23.Vance JE, Tasseva G. Formation and function of phosphatidylserine and phosphatidylethanolamine in mammalian cells. Biochimica et Biophysica Acta (BBA) - Molecular and Cell Biology of Lipids. 2013;1831(3):543–554. doi: 10.1016/j.bbalip.2012.08.016. [DOI] [PubMed] [Google Scholar]
- 24.Evseenko D, Latour B, Richardson W, et al. Lysophosphatidic acid mediates myeloid differentiation within the human bone marrow microenvironment. PLoS One. 2013;8(5):e63718. doi: 10.1371/journal.pone.0063718. [DOI] [PMC free article] [PubMed] [Google Scholar]
- 25.Guseva NV, Rokhlin OW, Glover RA, Cohen MB. TOFA (5-tetradecyl-oxy-2-furoic acid) reduces fatty acid synthesis, inhibits expression of AR, neuropilin-1 and Mcl-1 and kills prostate cancer cells independent of p53 status. Cancer Biol Ther. 2011;12(1):80–85. doi: 10.4161/cbt.12.1.15721. [DOI] [PubMed] [Google Scholar]
- 26.Wang C, Xu C, Sun M, Luo D, Liao DF, Cao D. Acetyl-CoA carboxylase-alpha inhibitor TOFA induces human cancer cell apoptosis. Biochem Biophys Res Commun. 2009;385(3):302–306. doi: 10.1016/j.bbrc.2009.05.045. [DOI] [PMC free article] [PubMed] [Google Scholar]
- 27.Murphy EJ, Prows DR, Jefferson JR, Schroeder F. Liver fatty acid-binding protein expression in transfected fibroblasts stimulates fatty acid uptake and metabolism. Biochimica et Biophysica Acta (BBA) - Lipids and Lipid Metabolism. 1996;1301(3):191–198. doi: 10.1016/0005-2760(96)00024-0. [DOI] [PubMed] [Google Scholar]
- 28.Murphy EJ, Prows DR, Stiles T, Schroeder F. Liver and intestinal fatty acid-binding protein expression increases phospholipid content and alters phospholipid fatty acid composition in L-cell fibroblasts. Lipids. 2000;35(7):729–738. doi: 10.1007/s11745-000-0579-x. [DOI] [PubMed] [Google Scholar]
- 29.Murphy EJ, Barcelo-Coblijn G, Binas B, Glatz JFC. Heart Fatty Acid Uptake Is Decreased in Heart Fatty Acid-binding Protein Gene-ablated Mice. Journal of Biological Chemistry. 2004;279(33):34481–34488. doi: 10.1074/jbc.M314263200. [DOI] [PubMed] [Google Scholar]
- 30.Zhang P, Takeuchi K, Csaki LS, Reue K. Lipin-1 phosphatidic phosphatase activity modulates phosphatidate levels to promote peroxisome proliferator-activated receptor gamma (PPARgamma) gene expression during adipogenesis. J Biol Chem. 2012;287(5):3485–3494. doi: 10.1074/jbc.M111.296681. [DOI] [PMC free article] [PubMed] [Google Scholar]
- 31.Alakel N, Jing D, Muller K, Bornhauser M, Ehninger G, Ordemann R. Direct contact with mesenchymal stromal cells affects migratory behavior and gene expression profile of CD133+ hematopoietic stem cells during ex vivo expansion. Exp Hematol. 2009;37(4):504–513. doi: 10.1016/j.exphem.2008.12.005. [DOI] [PubMed] [Google Scholar]
- 32.Khoury M, Drake A, Chen Q, et al. Mesenchymal stem cells secreting angiopoietin-like-5 support efficient expansion of human hematopoietic stem cells without compromising their repopulating potential. Stem Cells Dev. 2011;20(8):1371–1381. doi: 10.1089/scd.2010.0456. [DOI] [PMC free article] [PubMed] [Google Scholar]
- 33.Jing D, Fonseca A-V, Alakel N, et al. Hematopoietic stem cells in co-culture with mesenchymal stromal cells - modeling the niche compartments in vitro. Haematologica. 2010;95(4):542–550. doi: 10.3324/haematol.2009.010736. [DOI] [PMC free article] [PubMed] [Google Scholar]
- 34.Kim HE, Bae E, Jeong DY, et al. Lipin1 regulates PPARgamma transcriptional activity. Biochem J. 2013;453(1):49–60. doi: 10.1042/BJ20121598. [DOI] [PMC free article] [PubMed] [Google Scholar]
- 35.Reue K, Zhang P. The lipin protein family: Dual roles in lipid biosynthesis and gene expression. FEBS Letters. 2008;582(1):90–96. doi: 10.1016/j.febslet.2007.11.014. [DOI] [PMC free article] [PubMed] [Google Scholar]
- 36.Esplin BL, Shimazu T, Welner RS, et al. Chronic exposure to a TLR ligand injures hematopoietic stem cells. J Immunol. 2011;186(9):5367–5375. doi: 10.4049/jimmunol.1003438. [DOI] [PMC free article] [PubMed] [Google Scholar]
- 37.Arancibia SA, Beltran CJ, Aguirre IM, et al. Toll-like receptors are key participants in innate immune responses. Biol Res. 2007;40(2):97–112. doi: 10.4067/s0716-97602007000200001. [DOI] [PubMed] [Google Scholar]
- 38.Yamamoto M, Sato S, Hemmi H, et al. Essential role for TIRAP in activation of the signalling cascade shared by TLR2 and TLR4. Nature. 2002;420(6913):324–329. doi: 10.1038/nature01182. [DOI] [PubMed] [Google Scholar]
- 39.Wei Y, Chen R, Dimicoli S, et al. Global H3K4me3 genome mapping reveals alterations of innate immunity signaling and overexpression of JMJD3 in human myelodysplastic syndrome CD34+ cells. Leukemia. 2013;27(11):2177–2186. doi: 10.1038/leu.2013.91. [DOI] [PMC free article] [PubMed] [Google Scholar]
- 40.Hornung V, Rothenfusser S, Britsch S, et al. Quantitative expression of toll-like receptor 1–10 mRNA in cellular subsets of human peripheral blood mononuclear cells and sensitivity to CpG oligodeoxynucleotides. J Immunol. 2002;168(9):4531–4537. doi: 10.4049/jimmunol.168.9.4531. [DOI] [PubMed] [Google Scholar]
- 41.Yang H, Zhou H, Feng P, et al. Reduced expression of Toll-like receptor 4 inhibits human breast cancer cells proliferation and inflammatory cytokines secretion. J Exp Clin Cancer Res. 2010;29:92. doi: 10.1186/1756-9966-29-92. [DOI] [PMC free article] [PubMed] [Google Scholar]
- 42.Liu C, Gao F, Li B, et al. TLR4 knockout protects mice from radiation-induced thymic lymphoma by downregulation of IL6 and miR-21. Leukemia. 2011;25(9):1516–1519. doi: 10.1038/leu.2011.113. [DOI] [PubMed] [Google Scholar]
- 43.Lorenz E, Schwartz DA, Martin PJ, et al. Association of TLR4 mutations and the risk for acute GVHD after HLA-matched-sibling hematopoietic stem cell transplantation. Biol Blood Marrow Transplant. 2001;7(7):384–387. doi: 10.1053/bbmt.2001.v7.pm11529488. [DOI] [PubMed] [Google Scholar]
- 44.Anur P, Yates J, Garbati MR, et al. p38 MAPK inhibition suppresses the TLR-hypersensitive phenotype in FANCC- and FANCA-deficient mononuclear phagocytes. Blood. 2012;119(9):1992–2002. doi: 10.1182/blood-2011-06-354647. [DOI] [PMC free article] [PubMed] [Google Scholar]
- 45.Svahn J, Lanza T, Rathbun K, et al. p38 mitogen-activated protein kinase inhibition enhances in vitro erythropoiesis of Fanconi anemia, complementation group A–deficient bone marrow cells. Experimental Hematology. 43(4):295–299. doi: 10.1016/j.exphem.2014.11.010. [DOI] [PubMed] [Google Scholar]
- 46.Guzman ML, Neering SJ, Upchurch D, et al. Nuclear factor-κB is constitutively activated in primitive human acute myelogenous leukemia cells. 2001;98 doi: 10.1182/blood.v98.8.2301. [DOI] [PubMed] [Google Scholar]
- 47.Nourizadeh M, Masoumi F, Memarian A, Alimoghaddam K, Moazzeni SM, Hadjati J. Synergistic effect of Toll-like receptor 4 and 7/8 agonists is necessary to generate potent blast-derived dendritic cells in Acute Myeloid Leukemia. Leukemia Research. 2012;36(9):1193–1199. doi: 10.1016/j.leukres.2012.04.007. [DOI] [PubMed] [Google Scholar]
- 48.Gilmore TD, Herscovitch M. Inhibitors of NF-[kappa]B signaling: 785 and counting. Oncogene. 25(51):6887–6899. doi: 10.1038/sj.onc.1209982. [DOI] [PubMed] [Google Scholar]
- 49.Kagoya Y, Yoshimi A, Kataoka K, et al. Positive feedback between NF-kappaB and TNF-alpha promotes leukemia-initiating cell capacity. J Clin Invest. 2014;124(2):528–542. doi: 10.1172/JCI68101. [DOI] [PMC free article] [PubMed] [Google Scholar]
- 50.Volk A, Li J, Xin J, et al. Co-inhibition of NF-kappaB and JNK is synergistic in TNF-expressing human AML. J Exp Med. 2014;211(6):1093–1108. doi: 10.1084/jem.20130990. [DOI] [PMC free article] [PubMed] [Google Scholar]
- 51.Dai Y, Guzman ML, Chen S, et al. The NF (Nuclear factor)-kappaB inhibitor parthenolide interacts with histone deacetylase inhibitors to induce MKK7/JNK1-dependent apoptosis in human acute myeloid leukaemia cells. Br J Haematol. 2010;151(1):70–83. doi: 10.1111/j.1365-2141.2010.08319.x. [DOI] [PMC free article] [PubMed] [Google Scholar]
Associated Data
This section collects any data citations, data availability statements, or supplementary materials included in this article.


