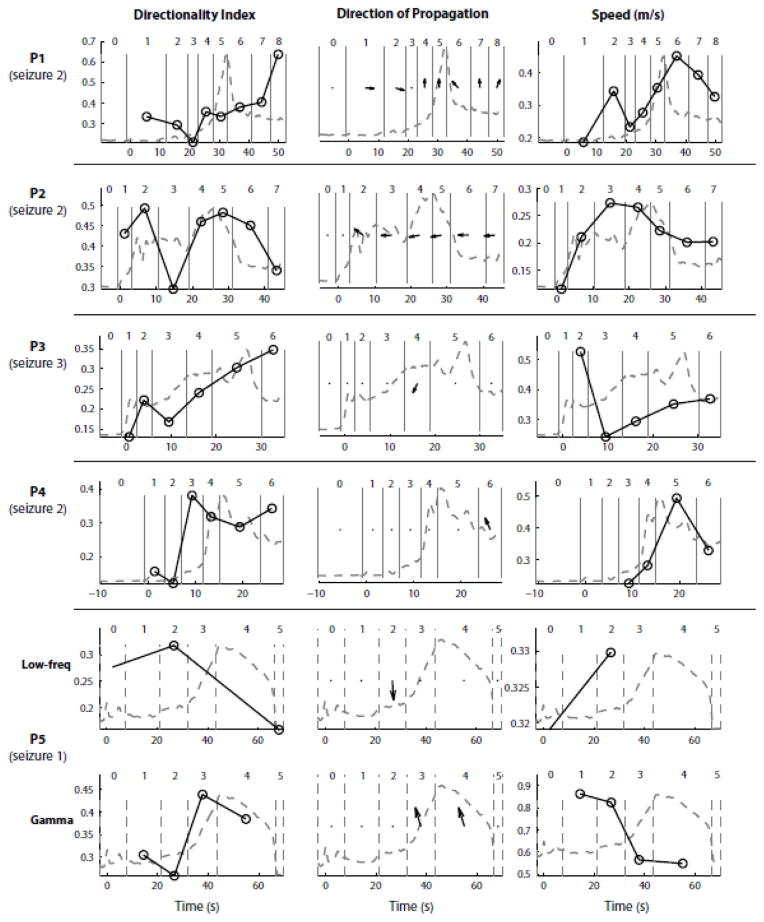
Figure 10. Propagation characteristics of LFP discharges and gamma oscillations do not reveal a strong association with MUA rate peak events.
This figure summarizes across all patients the analyses of propagation already illustrated in Figs. 8 and 9. Each row corresponds to one selected seizure in each patient. Columns 1, 2 and 3 represent respectively the evolution over time of the LFPs directionality index, direction of propagation and speed (black circles and solid line). Each circle corresponds to the average directionality index, average direction of propagation or average speed during a specific stage of the seizure (stage boundaries indicated by vertical gray lines and numbered as before). The directionality index was averaged across all LFP discharges or gamma oscillations. The direction of propagation and speed were averaged only across discharges/gamma oscillations with a directionality index above 0.2 (Material and Methods). A dot indicates that the average directionality vector had a norm below 0.2 or that the total number of discharges/gamma oscillations used to compute the average was smaller than 3, meaning that the average direction of propagation was unclear. The dashed grey line represents the population MUA rate, obtained by averaging the MUA rate (in 1-s bins) across electrodes and represented in arbitrary units. This trace shows the temporal location/profile of the MUA rate peak. Overall, we observe no clear relationship between the characteristics of propagation and MUA rate peak events (“ictal wavefront”).

