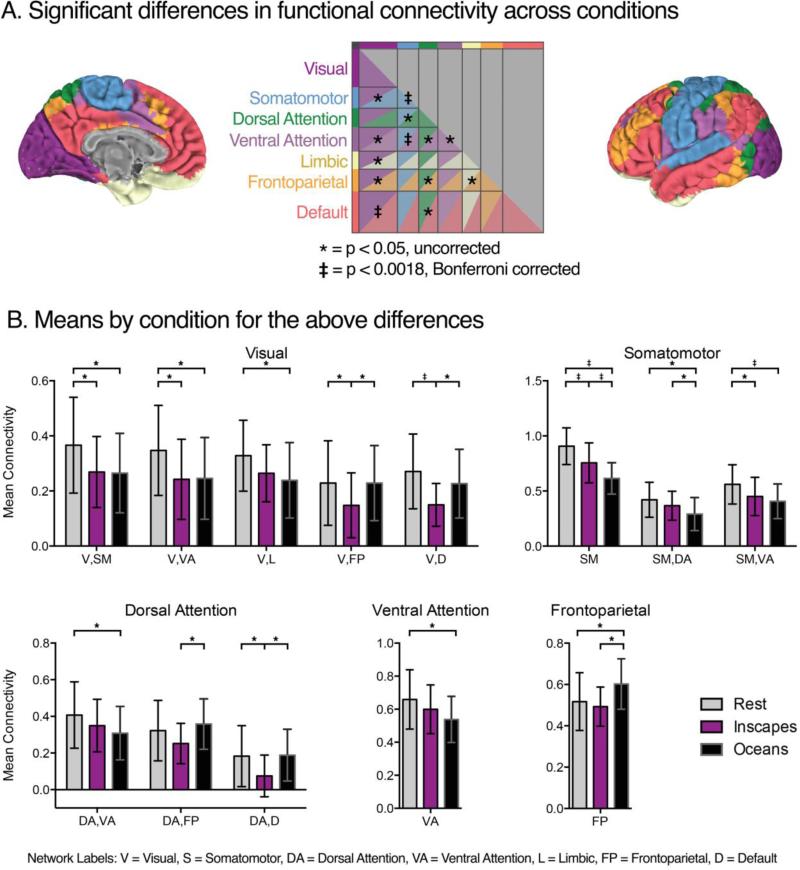
Figure 7. Differences in mean functional connectivity (FC) across conditions, healthy adults, n = 22.
Starting with the 200×200 functional parcellation connectivity matrices (Row A, Figure 6), we performed a series of 28 repeated-measures ANOVAs that tested the effect of condition (Inscapes, Oceans, Rest) on the subject-level mean Fischer z-transformed r-values quantifying intra- and inter-network FC. Results of the ANOVAs are summarized in Panel A. Post hoc t-tests were performed where a significant main effect of condition was obtained, the results of which are depicted in Panel B (p < 0.05), along with the group-level means for each condition. Although there were multiple differences among conditions at an uncorrected threshold, only three main effects of condition survived Bonferroni correction (p < 0.0018): intra-network FC of the somatomotor network; inter-network FC of somatomotor-ventral attention networks; and inter-network FC of default-visual networks.

