

Highlights
-
•
Protein–protein interactions of sulfurtransferases (Strs) with thioredoxins (Trxs) have been shown.
-
•
We used bimolecular fluorescence complementation (BiFC) to analyze Trx–Str interactions from Arabidopsis thaliana.
-
•
Compartment- and partner-specific interactions could be observed in transformed protoplasts.
-
•
Replacement of cysteine residues in the redox-active site of Trxs abolished the interaction signal.
-
•
Biochemical assays support a specific interaction among Strs and certain Trxs.
Abbreviations: Str(s), sulfurtransferase(s); Trx(s), thioredoxin(s); YFP, yellow fluorescent protein
Keywords: Arabidopsis thaliana, Bimolecular fluorescence complementation, Protein interaction, Thioredoxin
Abstract
Sulfurtransferases (Strs) and thioredoxins (Trxs) are members of large protein families. Trxs are disulfide reductases and play an important role in redox-related cellular processes. They interact with a broad range of proteins. Strs catalyze the transfer of a sulfur atom from a suitable sulfur donor to nucleophilic sulfur acceptors in vitro, but the physiological roles of these enzymes are not well defined. Several studies in different organisms demonstrate protein–protein interactions of Strs with members of the Trx family. We are interested in investigating the specificity of the interaction between Str and Trx isoforms. In order to use the bimolecular fluorescence complementation (BiFC), several Str and Trx sequences from Arabidopsis thaliana were cloned into the pUC-SPYNE and pUC-SPYCE split-YFP vectors, respectively. Each couple of plasmids containing the sequences for the putative interaction partners were transformed into Arabidopsis protoplasts and screened using a confocal laser scanning microscope. Compartment- and partner-specific interactions could be observed in transformed protoplasts. Replacement of cysteine residues in the redox-active site of Trxs abolished the interaction signal. Therefore, the redox site is not only involved in the redox reaction but also responsible for the interaction with partner proteins. Biochemical assays support a specific interaction among Strs and certain Trxs. Based on the results obtained, the interaction of Strs and Trxs indicates a role of Strs in the maintenance of the cellular redox homeostasis.
1. Introduction
Rhodanese activity, the transfer of a reduced sulfur from thiosulfate to cyanide, was found in many organisms. The main physiological function of these rhodanese/sulfurtransferase (Str) proteins was described to be cyanide detoxification [43]. Later bioinformatic analysis demonstrated that proteins containing a Str/rhodanese domain are present in all three domains of life [8]. In addition, in most organisms protein families with a large number of members have been identified. This high abundance of Str sequences makes the sole function as cyanide detoxification enzymes questionable. The protein family of Strs in Arabidopsis thaliana consists of 20 proteins containing one or two rhodanese domains, and they are located in different cellular compartments [31]. For some of the recombinant Str proteins from Arabidopsis (AtStr) an in vitro substrate specificity could be shown, either for thiosulfate (TS) or for 3-mercaptopyruvate (3-MP). However, the function of most Strs in plants remains unresolved so far. In recent years, the results of several independent research approaches indicate that Strs interact specifically with different proteins [13,1], but mainly with thioredoxins (Trxs), regulatory proteins involved in cysteine-thiol disulfide exchange [27,26,37]. All together more than 40 Trxs and Trx-like proteins were identified in Arabidopsis containing a five amino acid redox site with two cysteine residues (WCXXC) and being also located in the different compartments of the cell. Unlike animal and yeast counterparts, the function of Trxs in plant mitochondria is largely unknown [22]. There are two major questions: (1) why are there so many Trxs and Trx-like proteins in plants in comparison to other taxa, and (2) what is the biochemical basis for their target-protein specificity [19]. Therefore, more information about the redox interactome is needed.
First results indicating a Str/Trx interaction came from enzyme activity measurements in different species. Bacterial and mammalian Strs from mitochondria catalyze the direct oxidation of reduced Trx demonstrating that Trxs could be a physiological substrate for Strs [27,33]. In animals, at least one Str/rhodanese isoform could serve in the detoxification of intra-mitochondrial oxygen free radicals [28]. The redox state regulates 3-MP-dependent Str activity from rat at the enzymatic level and 3-MP Str was shown to maintain the cellular redox homeostasis [25]. This hypothesis was supported by a proteomic affinity approach demonstrating an interaction of Trx with 50 mitochondrial proteins, among them AtStr1 [2]. In the background of published results one can speculate that Str might act as a Trx peroxidase with the formation of a sulfenate at the active-site cysteine. Cysteine-sulfenate is very stable and has even a more negative redox potential than glutathione [25,26].
To postulate a functioning redox cycle of Str and Trx, the latter has to be first reduced and then oxidized again by a Trx reductase as indicated in the scheme shown in Fig. 1. There exists a family of six NADP-Trx reductases in Arabidopsis [22]. In the plastids three out of four proteins are ferredoxin-dependent Trx reductases, in the cytoplasm and the mitochondria the proteins are NADP-dependent Trx reductases [18].
Fig. 1.
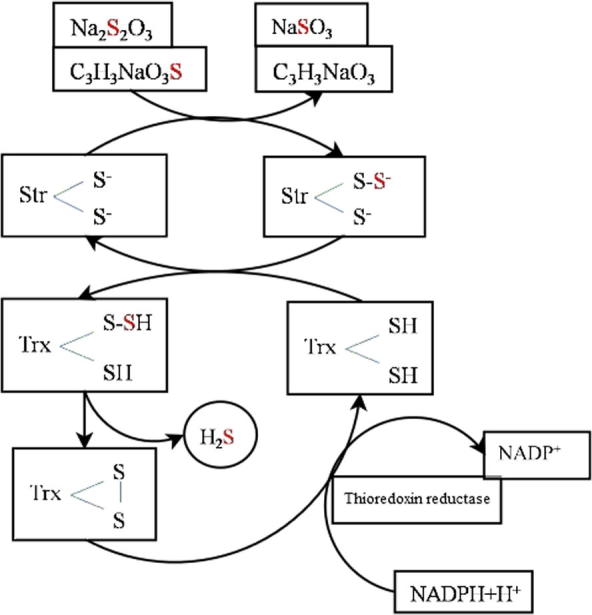
Schematic reaction cycle of Str, Trx, and NADP-dependent Trx reductase (modified after [28].
The goal of this study is to analyze whether there are interactions among Str and Trx proteins, to explore the specificity of the interactions, and to frame the molecular basis thereof. We concentrated on the analysis of a selection of Str that had been previously localized by GFP fusions [5]. With respect to the Trxs representative members have been chosen that are present in different compartments of the cell. Several fundamentally different methods were applied to clarify this postulated interaction. These methods are based on close physical proximity as a prerequisite in bimolecular fluorescence complementation (BiFC) as discussed in Bracha-Drori et al. [10] and Walter et al. [42]. In the biochemical tests the interaction could either be a protein–protein interaction or a weaker, transient substrate-channeling interaction. Results indicate a compartment- and partner-specific protein–protein interaction for some Str/Trx pairs and will help to elucidate the in vivo functions of Str proteins in plants.
2. Results
2.1. Sulfurtransferase interacts with thioredoxin as demonstrated by bimolecular fluorescence studies
Different combinations of pUC-SPYNE and pUC-SPYCE vectors carrying mitochondrial (AtStr1, Trxo1), cytoplasmic (AtStr2, AtStr18, Trxh1, Trxh3), or plastidic (AtStr14, AtStr15, AtStr16, Trxy1, Trxm1, Trxm4, Trxf1, Lil5) Str and Trx and mutated variants thereof were transiently transformed into protoplasts isolated from Arabidopsis leaves (Table 1). Proteins that are postulated to interact were fused to unfolded complementary fragments of the yellow fluorescent reporter protein and expressed in living cells. Interaction of these proteins will bring the YFP fragments within proximity, allowing the reporter protein to reform in its native three-dimensional structure and emit its fluorescent signal [16]. The co-transformed protoplasts were analyzed using a CLSM. Bright field images, YFP emission and overlayed autofluorescence of chlorophyll and YFP emission were taken (Fig. 2). As control for the experimental set up two parts of the tobacco 14-3-3 transcription factor protein T14-3c coupled to YFP were used [42] and a clear signal in the nucleus was visible (Fig. S1). Control experiments using each protein for co-transformation with an empty vector did not reveal any fluorescence (Fig. S2; data not shown). All results of protein pairs tested by BiFC are summarized in Table 2.
Table 1.
The table includes the names of the proteins, AGI numbers, and primer sequences. The underlined bases were the exchanged ones for the mutagenesis. Number of base pairs amplified by PCR and the predicted molecular masses of the encoded proteins including the 6×-His tag are given. TP, targeting peptide.
| Protein name | AGI No. | Primer sequence | Bp | Mr (kDa) |
|---|---|---|---|---|
| AtStr1 | At1g79230 | TCTAGAATGGCCTCGACCCTT | 950 | 41.90 |
| CTCGAGTGAAGAAGATTCAAC | ||||
| AtStr2 | At1g16460 | TCTAGAATGGCTTCTTCTGGA | 950 | 34.71 |
| CTCGAGTGAAGAAGAACCCAC | ||||
| AtStr14 | At4g27700 | TCTAGAATGGCTTCACTTACT | 700 | 2487 |
| CTCGAGGTCTTCTTCAATTGT | ||||
| AtStr15 | At4g35770 | TCTAGAATGGAAACCACTGCT | 549 | 20.04 |
| CTCGAGCTCTTCTACCGGCAG | ||||
| AtStr16 | At5g66040 | GGATCCATGGCGGAGGAGAGCAGA | 423 | 12.68 |
| CTCGAGAGCCTTTGTAGGAAG | ||||
| AtStr18 | At5g66170 | TCTAGAATGTCTCAATCAATC | 411 | 14.71 |
| CTCGAGATTAGCAGATGGCTC | ||||
| Trxy1 | At1g76760 | TCTAGAATGGCGTCAATTTCT | 516 | 19.25 |
| CTCGAGTGGCTTCACTTTTAG | ||||
| Trxy1_C93S | TCTAGAATGGCGTCAATTTCT | 516 | 19.23 | |
| CTCGAGTGGCTTCACTTTTAG | ||||
| GCAACCTGGTCTGGTCCTTGC | ||||
| GCAAGGACCAGACCAGGTTGC | ||||
| Trxy1_C96S | TCTAGAATGGCGTCAATTTCT | 516 | 19.23 | |
| CTCGAGTGGCTTCACTTTTAG | ||||
| TGTGGTCCTAGCCAGTTCATG | ||||
| CATGAACTGGCTAGGACCACA | ||||
| Trxy1_C93S_C96S | TCTAGAATGGCGTCAATTTCT | 516 | 19.22 | |
| CTCGAGTGGCTTCACTTTTAG | ||||
| ACCTGGTCTGGTCCTAGCCAG | ||||
| CTGGCTAGGACCAGACCAGGT | ||||
| Trxy1_C93S_C96S without TP | TCTAGAATTGAAGCCAAGAAGCAG | 330 | 12.55 | |
| CTCGAGTGGCTTCACTTTTAG | ||||
| TPTrxy1 | TCTAGAATGGCGTCAATTTCT | 186 | 6.67 | |
| TTCTTCCGAAGCACGTCGAGGAGT | ||||
| Trxm1 | At1g03680 | CCGCTCGAGCAAGAATTTGTTGATGCTGGTTGC | 537 | 19.67 |
| GCTCTAGAATGGCTGCTTACACGTGTACTTC | ||||
| Trxm4 | At3g15360 | CCGCTCGAGCTCGACCAAGAATCTTTCTATAG | 579 | 21.17 |
| GCTCTAGAATGGCGTCGTTACTCGATTCC | ||||
| Trxf1 | At3g02730 | GCTCTAGAATGGCTGGAGTTGTGCGAT | 534 | 19.33 |
| CCGCTCGAGACTTGATGCAGCTGGTTTG | ||||
| Lilium5 | At4g26160 | GCTCTAGAATGGCTGGAGTTGTGCGAT | 663 | 24.35 |
| CCGCTCGAGACTTGATGCAGCTGGTTTG | ||||
| Trxo1 | At2g35010 | TCTAGAAAGGGAAATTGGTCG | 585 | 21.19 |
| CTCGAGTCACTTGTAGAGCTG | ||||
| GGATCCAAGGGAAATTGGTCG | ||||
| AAGCTTCTTGTAGAGCTGTTC | ||||
| Trxo1_C118S | TCTAGAAAGGGAAATTGGTCG | 585 | 21.17 | |
| CTCGAGTCACTTGTAGAGCTG | ||||
| CGCCTGGTCTGGACCATGCAG | ||||
| CTGCATGGTCCAGACCAGGCG | ||||
| Trxo1_C121S | TCTAGAAAGGGAAATTGGTCG | 585 | 21.17 | |
| CTCGAGTCACTTGTAGAGCTG | ||||
| GTGTGGACCATCCAGGTTTATCTC | ||||
| GAGATAAACCTGGATGGTCCACAC | ||||
| Trxo1_C118S_C121S | TCTAGAAAGGGAAATTGGTCG | 585 | 21.16 | |
| CTCGAGTCACTTGTAGAGCTG | ||||
| GCCTGGTCTGGACCATCCAGGTTT | ||||
| AAACCTGGATGGTCCAGACCAGGC | ||||
| Trxh1 | At3g51030 | TCTAGAGCTTCGGAAGAAGGA | 342 | 12.67 |
| CTCGAGTTAAGCCAAGTGTTT | ||||
| GGAATTCCATATGGCTTCGGAAGAAGGACAAGTG | ||||
| CGGGATCCTTAAGCCAAGTGTTTGGCAATG | ||||
| Trxh1_C40S | TCTAGAGCTTCGGAAGAAGGA | 342 | 12.66 | |
| CTCGAGTTAAGCCAAGTGTTT | ||||
| GCTTCTTGGTCTGGACCATGTC | ||||
| GACATGGTCCAGACCAAGAAGC | ||||
| Trxh1_C43S | TCTAGAGCTTCGGAAGAAGGA | 342 | 12.66 | |
| CTCGAGTTAAGCCAAGTGTTT | ||||
| TGTGGACCATCTCGTTTCATC | ||||
| GATGAAACGAGATGGTCCACAC | ||||
| Trxh1_C40S_C43S | TCTAGAGCTTCGGAAGAAGGA | 342 | 12.64 | |
| CTCGAGTTAAGCCAAGTGTTT | ||||
| CTTGGTCTGGACCATCTCGTTTC | ||||
| GAAACGAGATGGTCCAGACCAAG | ||||
| Trxh1withTPTrxy1 | TCTAGAATGGCGTCAATTTCT | 528 | 19.34 | |
| CTCGAGTTAAGCCAAGTGTTT | ||||
| Trxh3 | At5g42980 | GGAATTCCATATGGCCGCAGAAGGAGAAGTTAT | 354 | 13.11 |
| CGGGATCCTCAAGCAGCAGCAACAACTG | ||||
Fig. 2.

Exemplary results of positive BiFC interaction. (A) AtStr1/Trxo1, (B) AtStr2/Trxh1, (C) AtStr14/Trxf1, (D) AtStr15/Trxm1, (E) AtStr15/Trxy1, and (F) AtStr16/Trxy1. Left: Bright field image; middle: YFP emission; right: overlay of autofluorescence and YFP emission. Each pair was tested between four and six times with the same interaction results.
Table 2.
Summary of the results of BiFC analysis. + interaction observed, − no interaction observed. If there is no sign the interaction has not been investigated. Mit, mitochondrium; Cyt, cytoplasm; Pl, plastid.
| Localization | AtStr1 | AtStr2 | AtStr18 | AtStr14 | AtStr15 | AtStr16 | |
|---|---|---|---|---|---|---|---|
| Mit | Cyt | Cyt | Pl | Pl | Pl | ||
| Trxo1 | Mit | + | − | − | |||
| Trxo1_C118S | Mit | − | |||||
| Trxo1_C121S | Mit | − | |||||
| Trxo1_C118S_C121S | Mit | − | |||||
| Trxh1 | Cyt | − | + | − | − | ||
| Trxh1_C40S | Cyt | − | |||||
| Trxh1_C43S | Cyt | − | |||||
| Trxh1_C40S_C43S | Cyt | − | |||||
| Trxh3 | Cyt | − | + | − | |||
| Trxy1 | Pl | − | − | − | + | + | |
| Trxy1_C93S | Pl | − | |||||
| Trxy1_C96S | Pl | − | |||||
| Trxy1_C93S_C96S | Pl | − | |||||
| Trxh1withTPTrxy1 | Pl | − | − | ||||
| Trxm1 | Pl | − | + | − | |||
| Trxm4 | Pl | − | − | − | |||
| Trxf1 | Pl | + | + | − | |||
| Lilium5 | Pl | − | + | − |
All positive interaction pairs were localized in the same compartment as was previously shown or predicted for the single proteins [5,22]. The interaction of Str and Trx is compartment-specific. Each Str tested interacted with at least one Trx localized in the same compartment (mitochondrion: AtStr1/Trxo1; cytoplasm: AtStr2/Trxh1, AtStr18/Trxh3; plastid: AtStr14/Trxf1; AtStr16/Trxy1). The analysis of AtStr16/Trxy1 (Fig. 2C) is possibly representing a physical interaction, but precise localization of the Str16/y1 complex will need additional investigations. Only AtStr15 showed a positive signal with several Trx in the plastid (Trxy1, Trxm1, Trxf1, Lilium5). We are aware that interaction partners are transported into the respective compartments due to their target sequence (mitochondria, plastid) or remain in the cytoplasm. Therefore, the cytoplasmic Trxh1 was fused with the transit peptide of Trxy1 (TPTrxy1withTrxh1) but neither with the cytoplasmic AtStr2 nor with the plastidic AtStr15 a positive signal was obtained, although the cytoplasmic Trxh1 usually shows an interaction with AtStr2. Except Trxm4, all investigated Trx proteins interacted with at least one AtStr. Trxm4 did not show any interaction with the offered plastidic proteins AtStr14, AtStr15, and AtStr16. Including their transit peptides Trxm1 and Trxm4 share only 46% identity and 65% similarity. Their redox site is identical (WCGPC) but the features around the protein disulfides differ.
Biologically significant protein–protein interactions are characterized by the involvement of essential amino acid residues in the contact zones of both interaction partners. Mutant variants that are affected in these critical residues might support the biological significance of the interaction. We assumed that the cysteine residues in the redox site of Trx proteins mediate the contact among Str and Trx proteins. Therefore, each and both of the respective cysteine residues in the redox site of Trxo1, Trxh1, and Trxy1 (Table 3) were replaced by serine residues (WCGPC: WSGPC/WCGPS/WSGPS).
Table 3.
Motif of the redox site and substrate recognition site of Trxs used in this study. Amino acids different from Trxh1 are highlighted in bold because this motif sequence was used by Maeda et al. [20].
| Thioredoxin | Amino acid motif |
|---|---|
| Trxo1 | WCGPC-AVP-VGA |
| Trxh1 | WCGPC-AMP-VGA |
| Trxh3 | WCPPC-AMP-VGA |
| Trxy1 | WCGPC-ALP-EGA |
| Trxm1 | WCGPC-SIP-IGA |
| Trxm4 | WCGPC-SVP-IGA |
| Trxf1 | WCGPC-VVP-TGA |
| Lilium5 | WCGSC-VLP-CSL |
| E. coli Trx | WCGPC-GIP-VGA |
The single replacements of the first cysteine residue Trxo1_C118S, the second cysteine residue Trxo1_C121S or of both cysteine residues Trxo1_C118S_C121S prevent an interaction with AtStr1. The respective amino acid replacements in Trxh1, Trxh1_C40S, Trxh1_C43S, and Trxh1_C40S_C43S, abolished the interaction with AtStr2. And also the interaction of Trxy1 with AtStr15 was completely abolished in all three mutant variants. The results clearly demonstrate that each cysteine residue is essential for the interaction with Str proteins. However, the cysteine residues in the redox sites are not the only feature for the specificity of the interaction based on the negative results of several plastidic Trx with one of the three Str proteins.
2.2. Enzyme activity of recombinant proteins
Based on the reaction scheme shown in Fig. 1 the biochemical assays were designed to evaluate if interaction between specific AtStr and Trx pairs is functional in the generation of H2S. Functional intactness of the single AtStr and Thr recombinant proteins was verified by independent biochemical assays.
The activity of the recombinant Str proteins was measured by the formation of thiocyanate from 3-MP or TS in the presence of cyanide according to Papenbrock and Schmidt [29]. The Km values of both substrates are in the low millimolar range for all AtStrs used in this study [29,30,6]. However, it was found that the H2S releasing assay was not functioning at millimolar substrate concentrations and also when TS was used as substrate. Therefore, thiocyanate formation was determined at different 3-MP (5 μM, 50 μM, 500 μM, 5 mM) concentrations to find a compromise between optimal substrate concentration for Str activity (Fig. S1) and technical limitations of the H2S releasing assay (see below). Finally, the best working concentration was set to 500 μM substrate (Fig.3). Str activity of the two-domain Str proteins was higher with 3-MP, whereas the one-domain proteins showed higher activity with TS in agreement with published results [6] (Fig.3). Five AtStr proteins were expressed and purified as soluble proteins whereas several attempts and trials (expression, induction and purification conditions, different expression vector, purification under denaturing conditions and subsequent re-folding) to obtain active AtStr15 protein were not successful.
Fig. 3.
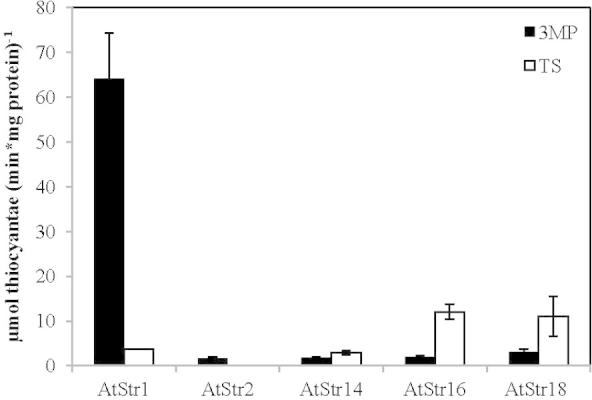
Sulfurtransferase activity of different recombinant Str proteins using 3-mercaptopyruvate (3-MP) (0.5 mM) and thiosulfate (TS) (0.5 mM) as substrates. The activity test was performed according to Papenbrock and Schmidt [29]. One hundred ng of the recombinant proteins were used for the Str activity test. The amount of rhodanide formed was quantified spectrophotometrically. Black bars show the Str activity with 3-MP as substrate and white bars show the activity with TS as substrate. The standard deviation of three independent measurements is shown by error bars.
Recombinant Trx proteins were analyzed by the insulin assay [15]. In short, in the presence of DTT Trx catalyzes the reduction of insulin disulfides. The rate of insulin reduction can be followed spectrophotometrically at 650 nm as turbidity formation from the precipitation of the free insulin B chain (Fig. 4). Four Arabidopsis Trx-isoforms were expressed and purified. The Escherichia coli Trx was included in the analysis to investigate the specificity of the reaction partners in the functional assay and because has been used in previous experiments [26,28]. All recombinant Trx proteins with the exception of TrxO1 were functioning (Fig. 4). In the insulin activation assay all proteins tested, Trxh3, Trxh1, Trxy1, and the E. coli Trx, showed similar activities as indicated by the same slopes of the curves (Fig.4) whereas Trxo1 was not active, also after several attempts to modify the expression conditions. In pre-tests the influence of the NADP-dependent NTR species origin was analyzed (data not shown). The origin and therefore sequence of the NTR, either from E. coli or from Triticum aestivum, did not influence the assay at all, although the E. coli enzyme is a selenocysteine protein with a molecular mass of 54.7 kDa and the T. aestivum protein has only 34.9 kDa [39].
Fig. 4.
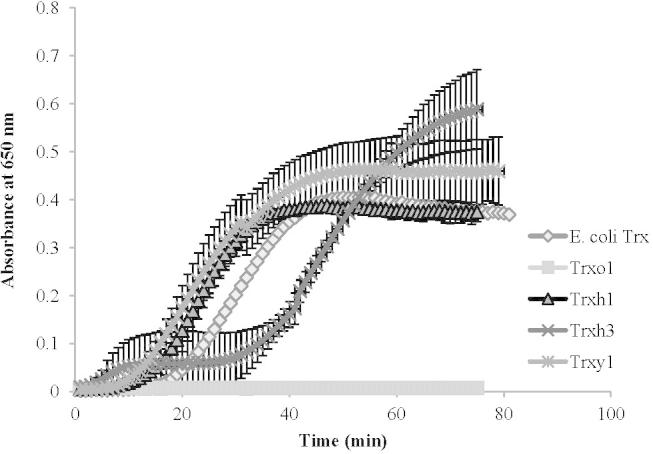
Activity assay of recombinant Trx proteins demonstrated by their activation of insulin. The incubation mixture (300 μl) contained 1.5 μM each Trx and 0.14 mM insulin in 0.05 M Tris/HCl, pH 8.0. The reaction was started by adding 0.67 mM DTT. Blank (DTT omission) was subtracted in the reported plots. The A. thaliana Trxs, Trxo1 (square), Trxh1 (triangle), Trxh3 (cross) and Trxy1 (star), and the E. coli Trx (rhomb) were tested. The error bars show the standard deviation of three independent measurements.
All active AtStr and Trx proteins were used in the H2S-releasing test according to the scheme shown in Fig. 1. The activity of Str in the H2S-releasing assay was tested at three different 3-MP concentrations: 10 μM (Fig. S2), 50 μM (Fig. S3), and 500 μM (Fig.5). As shown in Figs. S4 and S5 the assay is very sensitive to 3-MP and the non-enzymatic activity in the absence of Str or Trx protein is high, especially in the presence of TCEP (Fig. S5).
Fig. 5.

Combined enzyme assay using different recombinant Str and Trx proteins and 500 μM 3-MP as substrate. The H2S assay of E. coli Trx (A), Trxh1 (B), Trxh3 (C), Trxy1 (D) in the presence of different tested Strs. One μM of different recombinant Strs, except AtStr1 (0.025 μM only), 4 μM of different recombinant Trxs, and TCEP were incubated in 100 mM Tris/HCl, pH 8.0. After adding Trx reductase, NADPH, and 3-MP the formed H2S was quantified spectrophotometrically. The error bars show the standard deviation of three independent measurements.
In general, the H2S-releasing activity was highest in the presence of AtStr1 in comparison to the other AtStrs whereas the influence of the Trx proteins on the activity was small. E. coli Trx increased only the H2S-releasing activity of AtStr1 but not of the other AtStr proteins. Trxh1 showed high activities with AtStr1, AtStr18, and AtStr14. Plastidic Trxy1 enhanced the H2S-releasing activity of AtStr18. The mutant AtStr1_C339S shows a reduced Str activity [11] and it was speculated that this indicates a binding site of a larger peptide or protein as substrate instead of small molecules such as TS or 3-MP [4]. The mutant protein was used in the H2S-releasing assay with Trxh3 as interaction partner. The activity was even higher than the wild-type activity of AtStr1 (data not shown). The cysteine residue C339 of AtStr1 does not seem to play a role as binding partner of Trx.
2.3. In vitro interaction between AtStr and Trx
Crosslinking of proximate proteins [44,36] represents one of the most utilized methods in the investigation of protein–protein interactions being sensitive, easy and with short analysis time.
In the reaction mixtures, BS3 was applied as an uncleavable amine-to-amine crosslinker. Both AtStr16 and AtStr18 were incubated with Trxy1, Trxh1 or Trxh3. As shown in Fig. 6A, when incubations were carried out with AtStr16 and Trxy1, a band with Mr ∼30,000 was readily detected after 1 min of incubation. This Mr is consistent with the 1:1 protein stoichiometry in a covalent heterodimer complex AtStr16/Trxy1. In contrast, no additional incubation-dependent bands were observed in crosslinking experiments carried out in the presence of AtStr16 and Trxh1 or Trxh3 (Fig. 7A) validating the presence of interaction only between AtStr16 and Trxy1. When crosslinking experiments were performed using AtStr18 in the presence of Trxh3, a band with Mr ∼35,000 consistent with the complex AtStr18/Trxh3 was evident suggesting that a crosslinked heterodimer AtStr18/Trxh3 was formed (Fig. 6B). Band co-migrating with a crosslinked product was not detectable in the incubations containing AtStr18 and Trxh1, and was not clearly evident in the incubations containing AtStr18 and Trxy1 (Fig. 7B). Control experiments were carried out in the absence of the crosslinker reagent showing that no incubation-dependent band was observed (data not showed). Moreover, no incubation-dependent band was observed in crosslinking mixtures containing the single proteins, thus suggesting that none of the tested proteins is able to form crosslinked homomultimers (Fig. 8). All results obtained are summarized in Table 4. Taking together, the results of the crosslinking experiments showed that none of the analyzed AtStr and Trx are present as homodimers whereas AtStr16 forms heterodimeric complex preferentially with Trxy1, and AtStr18 with Trxh3, respectively.
Fig. 6.
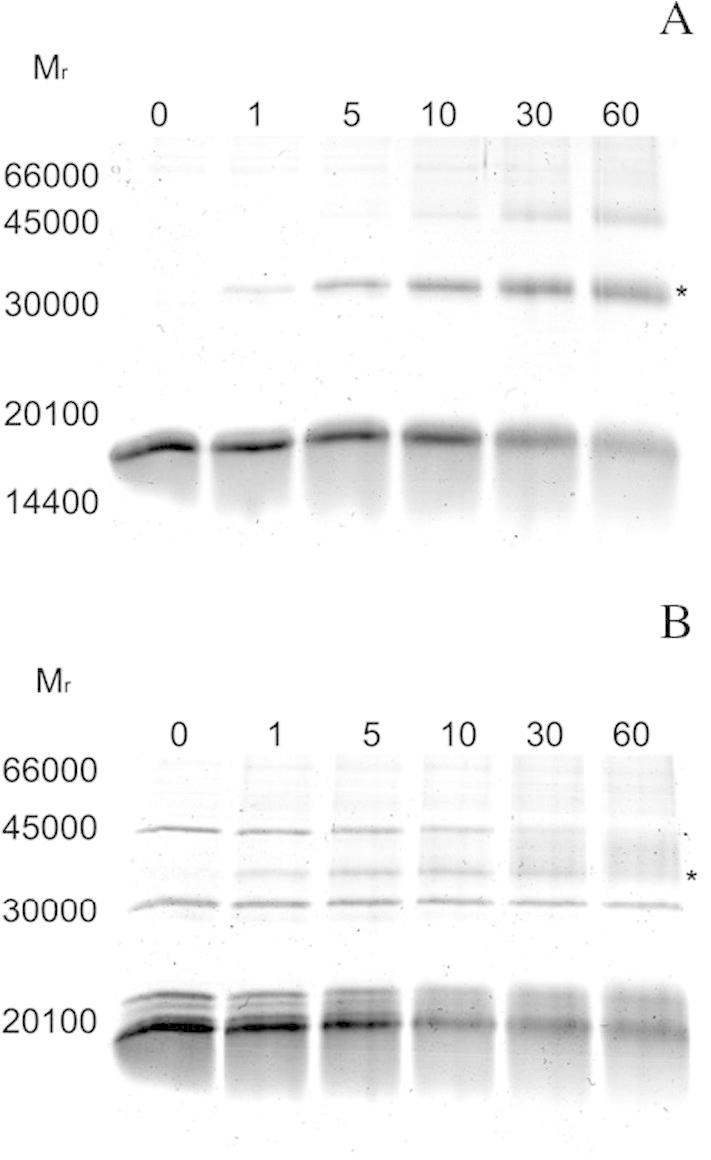
SDS–PAGE analysis of AtStr16/Trxy1 and AtStr18/Trxh3 interactions, respectively. AtStr16 and Trxy1 (A) and AtStr18 and Trxh3 (B) in 20 mM NaH2PO4, pH 7.0, were incubated in the presence of the crosslinker bis(sulfosuccinimidyl)suberate (BS3). The protein samples, obtained after different incubation times, were submitted to SDS–PAGE (15% polyacrylamide gel) under reducing conditions. Incubation times (min) are indicated above the respective gel lanes. *indicates the position of the band co-migrating with the AtStr/Trx heterodimer complexes.
Fig. 7.
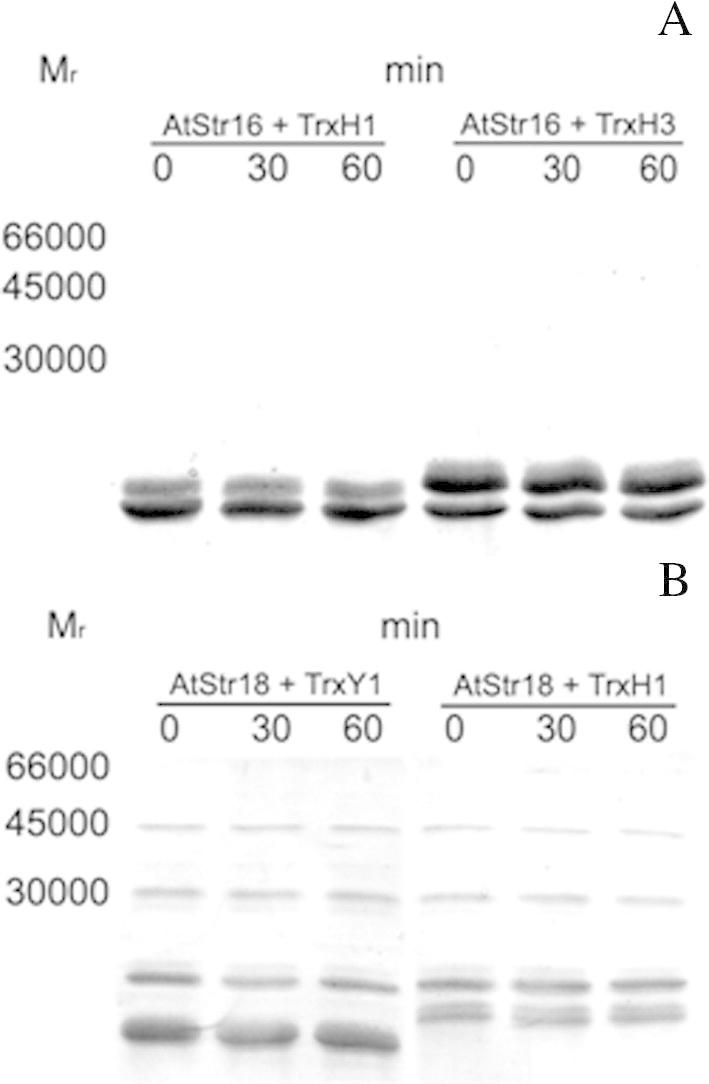
SDS–PAGE analysis displaying results of crosslinking reactions of AtStr16 with Trxh1 or Trxh3 (A), and AtStr18 with Trxy1 or Trxh1 (B). Reaction conditions are reported in the legend of Fig. 6. Incubation times are indicated above the respective gel lanes.
Fig. 8.
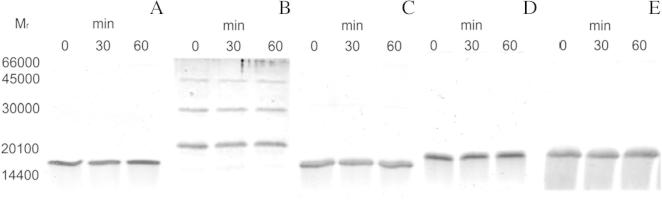
SDS–PAGE analysis reporting results of the crosslinking experiments in the presence of AtStr or Trx single proteins. AtStr16 (A), AtStr18 (B), Trxy1 (C), Trxh1 (D), and Trxh3 (E). Reaction conditions are reported in the legend of Fig. 6. Incubation times are indicated above the respective gel lanes.
Table 4.
Summary of protein crosslinking results. −, absence of incubation-dependent band; +, presence of crosslinking products; +/−, no clear-cut presence of crosslinking products. Cyt, cytoplasm; Pl, plastid.
| Localization | AtStr16 Pl |
AtStr18 Cyt |
|
|---|---|---|---|
| Trxh1 | Cyt | − | − |
| Trxh3 | Cyt | − | + |
| Trxy1 | Pl | + | +/− |
3. Discussion
3.1. Sulfurtransferase interacts with thioredoxin as shown by bimolecular fluorescence complementation studies
Several pairs of Str and Trx proteins from Arabidopsis showed interactions in split-YFP assays. BiFC significantly facilitate the visualization of the subcellular sites of protein interactions under conditions that closely reflect the normal physiological environment [42]. Localization results from previous GFP-coupled proteins [5] and the co-transformed proteins in this BiFC analysis reveal identical localization compartments and patterns. This confirmation underlines the significance of the BiFC interactions results. In addition, one could perform a transformation experiment using the two BiFC constructs and the complete protein bound to another fluorescent protein (triple transformation), e.g. RFP. After superimposing the images taken at different channels one would expect identical coverage. Another suggestion is to grow the plants at different conditions (control and stress) and compare whether stress influences protein localization.
We assume that negative complementation results are the consequence of missing interaction of the Str/Trx pairs based in following evidence: The transient transformations were repeated several times over a long experimental period in different conditions by different scientists, always with the same results. To further support our results opposite cloning orientation of each partner could be tested. In previous studies, differences in the expression of the two partners, demonstrated by YFP-antibody experiments, have been detected, mainly when protein partners had significantly different molecular masses [10,42]. Here the differences in molecular masses are relatively small, especially among the one-domain Strs and Trxs. In a comparative proteomic experiment based on different biochemical traits for the identification of interacting proteins using cytosolic Trxh3, none of the cytoplasmic Strs have been identified [21]. However, the complementarity and efficiency of the biochemical screening methods was low [21]. We also used the database STRING which records protein–protein interactions based on various parameters such as experimental, co-expression, genetic context (http://string-db.org/). However, neither for Strs nor for Trxs from Arabidopsis meaningful interaction partners were indicated. One could use yeast two hybrid assays?
3.2. Specificity of the interaction: The WCXXC redox site acts as a contact site
In the introduction we asked two questions of more general interest, (1) why is there such a high number of Trx proteins found in plants in comparison to other taxa, and (2) how is their target protein specificity determined. Both questions can be at least partially answered, mainly with the help of Trx mutants. The availability of several genomes of vascular and nonvascular plants allowed the establishment of a clear classification of the Trx genes and the chronology of their appearance during plant evolution [23]. Putative Trx target proteins are involved in all aspects of plant growth, including basal metabolism, iron/sulfur-cluster formation, development, adaptation to the environment, and stress responses [23]. During the evolution of green plants there was obviously a demand for many different, partially highly specific Trx proteins with many different or with only a few interacting partners, revealing the high plasticity of the redox systems in plants.
Another aspect of the high abundance of members of the Trx family in plants is the differential expression. It was shown that Trxf and Trxm in Pisum sativum reductively activate plastidial fructose-1,6-bisphosphatase (FBPase) and malate dehydrogenase (MDH), respectively. Both Trx proteins show a different spatial pattern, as shown by immunocytochemistry. Whilst PsTrxm was localized to vascular tissues of all the organs analyzed (leaves, stems, and roots), PsTrxf was localized to more specific cells next to xylem vessels and vascular cambium [41].
It is known that biologically significant protein–protein interactions are characterized by the involvement of essential amino acid residues in the contact zones of both interaction partners. Mutant variants that are affected in these critical residues and that result in loss of the interaction coincident with an altered plant phenotype are therefore suitable controls to verify the biological significance of a protein–protein interaction [7]. The mutant analysis of three Trx isoforms localized in different compartments fully supports the results obtained: Replacement of even one out of the two cysteine residues in the redox and putative contact site abolishes interaction. Maybe the cysteine residue fixes or stabilizes a “dynamic” interaction that is driven by factors other than the redox traits, for example the overall three-dimensional structure of the protein. One could speculate that even a disulfide bridge is formed between the Str and Trx proteins.
The redox sites of the Trx proteins used in this study consist of the amino acids WCGPC in the Trxf1, h1, m1, m4, o1, and y1, of WCGSC in the Trx Lilium5, and of WCPPC in Trxh3. We replaced only the cysteine residues in the redox site WCGPC but we assume that the replacement of the cysteine residues in the redox sites with slightly different sequences leads to identical results, abolishment of interaction. One could also speculate that cysteine residues outside of the redox site are involved in the interaction. All Trx proteins analyzed in this study contain more than two cysteine residues (plastidic: Trxy1, 4; Trxm1, 4; Trxm4, 3; Trxf1, 6; Lilium5, 6; mitochondrial: Trxo1, 3; cytosolic: Trxh1, 3; Trxh3, 3). However, the positions of the cysteine residues are not conserved and each single cysteine residue is distributed over the complete sequence as can be deduced from alignments of the respective protein sequences (data not shown).
Probably, amino acids in addition to the redox site are responsible for the specificity of the Trx-protein interaction. The structure of Trxh2 from barley (Hordeum vulgare) was elucidated in a reaction intermediate complex with a protein substrate, barley alpha-amylase/subtilisin inhibitor (BASI). HvTrxh2 has the typical fold of Trx with a five-stranded β-sheet surrounded by four α-helices in a βαβαβαββα topology. The overall fold of HvTrxh2 is representative for Trx proteins, as the Cα atoms can be superimposed on the crystal structures of oxidized Trxs from other species. The crystal structure of this mixed disulfide shows a conserved spatially defined motif (45WCGP48-87AMP89-104VGA106) in HvTrxh1 interacting with a sequence of residues from BASI through van der Waals-contacts and backbone-backbone hydrogen bonds. The observed structural complementarity suggests that the recognition of features around protein disulfides plays a major role in the specificity and protein disulfide reductase activity of HvTrxh1 [20]. We analyzed the hydrophobic motif, containing the redox site and the substrate recognition site motif, in AtTrxh1 in comparison to the other Trx proteins used in this study (Table 3). Two Trxs vary only in one amino acid residue in comparison to AtTrxh1, three Trxs in two amino acid residues, one Trx in three amino acid residues and one Trx in six amino acid residues. Therefore, the specificity seems to be based only on a small number of amino acid residues in the Trx redox site and substrate recognition site motif. The counterpart of the specificity criteria is based on the fold of the partner protein. BASI is recognized by HvTrxh1 primarily by a cysteine residue and two immediately preceding residues. This DWC motif is stabilized by the spatially defined motif, the substrate recognition motif, on the HvTrxh1 surface and three structural loops. In BASI a common right-handed disulfide bridge is formed between the cysteine residue and the cysteine residue in WCGP. Similar structures are probably found in Str proteins and other proteins interacting with Trx. Comparison with structurally related proteins shows that Trx shares a mechanism with glutaredoxin and glutathione transferase for correctly positioning substrate cysteine residues at the catalytic groups but possesses a unique structural element that allows recognition of protein disulfides [20]. Several non-Trx interaction partners of Strs have been suggested [35]. Probably other molecular mechanisms are responsible for the specificity. This has to be analyzed in the future in a similar elegant experimental set-up as used by Maeda et al. [20]. The reactivity of the proteins and substrates involved makes the analysis via classical enzyme assays very difficult. Maybe the analysis of the reaction partners by mass spectrometry helps to show the directly involved reaction intermediates and products.
The cytoplasmic Trxh1 was fused with the transit peptide of Trxy1 but neither with the cytoplasmic AtStr2 nor with the plastidic AtStr15 positive signals were obtained (Table 2). The result supports that there is a specificity of protein pair interactions: Although AtStr15 reacts with four different plastidic Trx proteins, it does not accept the newly designed cytoplasmic protein including the plastidic target peptide. One could assume that the overall three-dimensional structure of Trxh1 changes, when an unusual transit peptide is attached and the substrate recognition loop motif is not correctly structured any more. Spectroscopic studies using AtStr1 und mutants thereof suggest also a larger peptide or protein as substrate instead of small molecules such as TS or 3-MP [4].
3.3. Impact of the Trx–Str interaction on the putative function of Strs in redox homeostasis
There are several indications that Strs take part in the maintenance of the redox homeostasis in cells in an interplay with Trx [25]. Strs might act as a Trx (per)oxidase with the formation of a sulfenate at the active site cysteine [28]. Cysteine-sulfenate is very stable and has even a more negative redox potential than glutathione [25]. A cysteine residue of E. coli Trx reacted with two redox-active cysteine residues of rat 3-MP Str by forming an inter-subunit disulfide bond and a sulfenyl cysteine. A consecutively formed disulfide bond between Trx and 3-MP Str must be cleaved for the activation. The mutated E. coli Trx_C32S however, did not activate 3-MP Str. Reduced Trx turns on a redox switch for the enzymatic activation of 3-MP Str which contributes to the maintenance of cellular redox homeostasis in rat cells [26]. It was also shown that the rhodanese RhdA helps the nitrogen-fixating bacterium Azotobacter vinelandii in maintaining the cellular redox balance [34,35]. Our results from the BiFC analysis indicate that Strs in specific interaction with certain Trx proteins might play a role in the control of the redox homeostasis in each single subcellular compartment. Interestingly, regularly the deformation of protoplasts transformed with AtStr1 and Trxo1 was observed during the BiFC experiments. One could assume that the transformed mitochondria suffer oxidative stress. It was suggested that Trxs acts as a sensor and enables mitochondria to adjust key reactions in accord with the prevailing redox state. By sensing the redox state in chloroplasts and mitochondria, Trx enables the two organelles to communicate by means of a network of transportable metabolites [38]. In this way, light absorbed and processed by means of chlorophyll can be perceived and function in regulating fundamental mitochondrial processes akin to its mode of action in chloroplasts [2]. For the plastidic Trxf1 and Trxm1 it is well known that they mediate light regulation of carbon metabolism through the activation of Calvin-cycle enzymes. Recently, it was shown that both Trx proteins are regulated by the transcription factor CCA1, part of the circadian clock, on the transcriptional level [3], indicating circadian-controlled redox regulation.
Recently, it was demonstrated that 3-MP-specific Str produces H2S from 3-MP. Although a reducing substance is required for an intermediate persulfide at the active site of 3-MP Str to release H2S, the substance has not been identified. Trx and dihydrolipoic acid (DHLA) associate with 3-MP Str to release H2S [24]. Other reducing substances, such as NADPH, NADH, GSH, cysteine and CoA, did not have any effect on the reaction [24]. It was also shown that 3-MP Str produces H2S from TS. The study of Mikami et al. [24] provides a new insight into a mechanism for the production of H2S by 3-MP Str. Therefore, in addition to the cellular redox homeostasis the production of H2S after the formation of the Str/Trx pair as signal molecule and/or a toxic agent against microorganisms [32,14] can be postulated.
4. Outlook
The results of the BiFC show that there is a functional interaction between certain Trxs and Strs in the plant cell. Among the tested Trx and AtStr proteins, a preference in the interaction between specific Trxs and AtStrs was shown in the cell by BiFC. Based on the results obtained so far the interaction of Strs and Trxs indicates a role of Strs in the maintenance of the cellular redox homeostasis. Screening of trx/str Arabidopsis double mutants could be used to proof this hypothesis.
5. Materials and methods
5.1. Chemicals
All chemicals were obtained from Roth (Karlsruhe, Germany), Sigma (Taufkirchen, Germany) or Applichem (Darmstadt, Germany) if not otherwise stated.
5.2. Growth and harvest of plants
Seeds of A. thaliana (L.) Heynh., ecotype Columbia, were originally obtained from the Arabidopsis stock center at the Ohio State University. After two days of stratification seeds were sown on soil and grown for six weeks in a climate chamber under following conditions: Short-day photoperiod with a quantum rate of 120 μmol m−2 s−1 (sodium vapor lamp, SON-T Agro 400, Philips) and 21 °C during the day and 19 °C during night.
5.3. Isolation of protoplasts
The lower epidermis of about ten leaves of Arabidopsis plants was peeled off with a piece of glue strip [45]. With the peeled surface downwards, the leaves were put into a Petri dish with enzyme buffer I (0.4 M mannitol, 20 mM KCl, 20 mM MES, 10 mM CaCl2, 0.1% (w/v) bovine serum albumin, pH 5.7). Buffer I was removed with a Pasteur pipette and buffer II [1.5% (w/v) cellulase Onozuka R-10 (Serva, Heidelberg, Germany) and 0.4% macerozyme R-10 (Serva) dissolved in buffer I] was added. The leaves were incubated for 40 min at 25 °C and slow orbital shaking (30 rpm). The protoplast suspension without the leaves was centrifuged at 100×g for 3 min. The pellet was washed carefully with W5 buffer (154 mM NaCl, 125 mM CaCl2, 5 mM KCl, 2 mM MES (pH 5.7), 5 mM glucose). After removal of the buffer the pellet was resuspended in 6 ml W5 buffer. Incubation for 30 min on ice followed by a centrifugation for 1 min at 4 °C at 100×g. The supernatant was discarded and the pellet resuspended in MMG buffer (0.4 M mannitol, 15 mM MgCl2, 4 mM MES, pH 5.7) and incubated on ice for 20 min.
5.4. Transformation of protoplasts
Eighty μg plasmid DNA encoding Strs and Trxs, respectively, were transformed into the protoplasts with the following method. The plasmid DNA was put carefully in 200 μl protoplast suspension. Stepwise 220 μl PEG buffer [40% PEG 4000 (Merck, Darmstadt, Germany), 0.2 M mannitol, 100 mM CaCl2] was pipetted slowly and carefully to the protoplasts and incubated for 15 min at room temperature (RT). After adding 0.5 ml, 1 ml, 2 ml, and 4 ml, respectively, W5 buffer, the solution was mixed carefully and incubated for 15 min at RT. An overnight incubation in darkness followed. The supernatant was discarded till only a small amount was left. The protoplasts were investigated using a confocal laser scanning microscope (CLSM) (LSM 510 Meta, Zeiss, Jena, Germany).
5.5. Cloning procedures
The plasmids pUC-SPYNE (4616 bp) and pUC-SPYCE (4,832 bp) (abbreviation for split YFP N-terminal/C-terminal fragment expression) were used as described [42]. All primer pairs and templates are summarized in Table1. When necessary cDNA was prepared by RT-PCR using the First Strand cDNA Synthesis Kit (Fisher Scientific, Schwerte, Germany).
For the amplification of the wild-type Str and Trx DNA fragments the PCR tubes contained 0.2 mM dNTPs, 0.4 μM of each primer (Eurofins Genomics, Ebersberg, Germany), 0.25 μl Dream Taq DNA polymerase (Fisher Scientific), and about 1 μg template DNA in a final volume of 50 μl. Before starting the first PCR cycle, the DNA was denatured for 180 s at 94 °C followed by 28 PCR cycles conducted for 60 s at 94 °C, 60 s at the different annealing temperatures required, and 60 s at 72 °C. The process was finished with an elongation phase of 600 s at 72 °C. The amplified PCR fragments were ligated into pGEM-T, sequenced and then ligated into the YFP containing vectors pUC-SPYNE or pUC-SPYCE and introduced into the E. coli (E. coli) strain XL1-blue.
For the production of the mutated Trxs two PCRs were done. The initial PCR contained 0.2 mM dNTPs, 0.5 μM of each primer (Eurofins Genomics), 0.5 μl Phusion DNA polymerase (Fisher Scientific) and about 1 μg template DNA in a final volume of 50 μl. Before starting the first PCR cycle the DNA was denatured for 30 s at 98 °C followed by 28 cycles conducted for 10 s at 98 °C, 30 s at 54 °C and 30 s at 72 °C. The process was finished with an elongation phase of 600 s at 72 °C. The PCR products were used as the template for the final PCR. The PCR contained 0.2 mM dNTPs, 0.5 μM of each primer (Eurofins Genomics), 0.5 μl Phusion DNA polymerase (Fisher Scientific) in a final volume of 50 μl. Before starting the first PCR cycle, the DNA was denatured for 30 s at 98 °C. Initially five cycles were run, each consisted of denaturation at 98 °C for 10 s, followed by annealing at 49 °C for 60 s and finally extension at 72 °C for 30 s. Then, 23 cycles were run. Each of these cycles consisted of denaturation at 98 °C for 10 s, followed by annealing at 54 °C for 30 s and finally extension at 72 °C for 30 s. A final extension was done at 72 °C for 10 min. The amplified PCR products were ligated into pJET (Fisher Scientific), sequenced, ligated into the pUC-SPYCE and then introduced into the E. coli strain XL1-blue.
All clones produced and/or used for BiFC analysis during this study are summarized in Table1. In general all Str sequences were ligated into the pUC-SPYNE vector and the Trx sequences into the pUC-SPYCE vector. As control the transcription factor T14-3c, a 14-3-3 transcription factor protein with a very high interaction potential, was used [42].
The Str expression clones in pQE-30 AtStr1 and a mutant thereof, AtStr_C339S, AtStr2, AtStr14, AtStr15, AtStr16, and AtStr18 were produced during previous studies [29,30,6,11]. The Trx expression clones of Trxo1, Trxy1, Trxh1, and Trxh3 in pET16b were produced using the primers listed in Table1 in which the primer of Trxh3 and Trxy1 were used for pUC-clones and expression clones. The E. coli Trx (accession number AAC76786) was purchased from Sigma (T-0910). A clone expressing NADP-dependent Trx reductase from T. aestivum (TaNTR, accession number AJ421947, 34.9 kDa) was obtained from Serrato et al. [39].
5.6. Plasmid DNA purification
To obtain high amounts of plasmid DNA of the Str- and Trx-containing plasmids, the Maxi Kit from Qiagen (Hilden, Germany) was used with a following phenol/chloroform (1:1) extraction and sodium acetate (3 M, pH 5.3) (Baker, B.-V.-Deventer, Netherlands) precipitation.
5.7. Expression and purification of recombinant proteins
AtStr1, AtStr1_C339S, AtStr2, AtStr14, AtStr16, AtStr18, Trxy1, Trxh1, Tryh3, Trxo1, and TaNTRB were expressed according to the following protocol: after growth of the respective E. coli cultures at 37 °C to an OD600 of 0.6 in Luria Bertani medium (10 g l−1 tryptone, 5 g l−1 yeast extract, 10 g l−1 NaCl containing 100 μg ml−1 ampicillin). The induction was carried out for 3 h with 0.5 mM final concentration of isopropyl-l-d-galactoside at 30 °C. Cell lysis was obtained by adding lysozyme (final concentration 1 mg ml−1) and vigorous homogenizing using an ultrasonic cell disruptor (Branson Ultraschall, Dietzenbach, Germany). The recombinant proteins were purified under non-denaturing conditions by affinity chromatography with nickel affinity resin and by using the Äkta Prime Plus Chromatography system (GE Healthcare, Freiburg, Germany). For buffer exchange the Äkta Prime Plus Chromatography system was also used with a column containing Sephadex G-25 Superfine crosslinked with dextran beads (GE Healthcare). The desalted proteins could be used directly for the enzyme tests. The purity of the protein preparations was checked by SDS–PAGE [17] and subsequent Coomassie staining.
5.8. Protein crosslinking
Proteins (10 μM) were incubated at 25 °C with 1 mM bis(sulfosuccinimidyl) suberate (BS3) (Sigma) [44] in 20 mM NaH2PO4, pH 7.0. At time intervals, aliquots were withdrawn from the reaction mixture and the crosslinking reactions were stopped in the SDS–PAGE loading buffer (125 mM Tris/HCl, pH 6.8, 4% SDS, 350 mM β-mercaptoethanol). Samples were run on 15% SDS–PAGE gels and stained with blue silver (0.12% Coomassie Blue G-250, 10% ammonium sulfate, 10% phosphoric acid, 20% methanol) [12] in order to detect the protein products. The control crosslinking samples were incubated in the same conditions without crosslinker.
5.9. Sulfurtransferase activity
The Str activity assay using thiosulfate (TS) and 3-mercaptopyruvate (3-MP) as substrates was performed as described [29]. The Str activity assay was also conducted with Str and Trx proteins together. After a pre-incubation for 30 min under nitrogen and 25 °C in buffer (0.1 M Tris/HCl, pH 7.5), 0.5 μM tris(2-carboxyl)phosphine (TCEP) (Sigma), Trxo1 (258 μg) and AtStr1 (2.01 μg) the Str activity was measured as described in Papenbrock and Schmidt [29].
5.10. Activity test for thioredoxins by an insulin assay
The activity of the Trx proteins was tested by the standard insulin assay described by Holmgren [15] where the rate of insulin reduction was measured spectrophotometrically at 650 nm as turbidity formation from the precipitation from the free insulin B chain. Stock solutions of insulin were prepared with 10 mg ml−1 (1.67 mM) by suspending 50 mg insulin (Sigma) in 4 ml of 0.05 M Tris/HCl, pH 8.0, and adjusting to pH 2 to 3 by addition of 1.0 M HCl, and rapidly titrating the solution back to 8.0 with 1.0 M NaOH followed by a pH meter. Finally, the volume was adjusted to 5 ml with water. Freshly prepared solution of insulin, 1 mg ml−1 in 0.1 M potassium phosphate, pH 6.5, and 2 mM EDTA was stored on ice. The assay mixture was prepared by addition of 250 μl insulin plus 1.5 μM Trx and water to give a final volume of 300 μl. The reaction was started by pipetting 2 μl 100 mM DTT in all reaction tubes, except the blank. As control the assay was done without Trx. The measurements were performed at 650 nm using a microplate reader (Synergy Mx, BioTek, Bad Friedrichshall, Germany) with no further mixing of the plate for assays lasting up to 80 min. The time for the start of precipitation, defined as an increase by 0.02 at A650 over a stable base-line recording, was determined. The second parameter calculated was the rate of precipitation at 650 nm, defined as the maximal increase ΔA650 min−1 in the interval between 0 and 1.0 in absorbance at 650 nm.
5.11. Biochemical analysis of the interaction of Str and Trx by the H2S releasing assay
Str activity was measured by the release of H2S from 3-MP in the presence of Trx. The assay contained in a total volume of 300 μl: 100 mM Tris/HCl pH 8.0, 0.025 μM AtStr1 or mutant AtStr1_C339S, alternatively 1 μM of AtStr2, AtStr14, AtStr16, or AtStr18, 4 μM of recombinant Trx proteins, 0.5 μM NADP-dependent Trx reductase, 50 μM NADPH, 1 μM TCEP, and 3-MP (10–500 μM as stated) as starting reagent. For the pre-incubation buffer, Str, Trx, and TCEP were incubated for 30 min at 37 °C. Then NADPH, NADP-dependent Trx reductase, and finally 3-MP were added. After an incubation for 20 min at 37 °C the reaction was terminated by adding 30 μl of 30 mM FeCl3 dissolved in 1.2 N HCl and 30 μl 20 mM N,N-dimethyl-p-phenylenediamine dihydrochloride dissolved in 7.2 N HCl [40]. After 20 min incubation at RT the formation of methylene blue was determined at 670 nm. Solutions with different concentrations of Na2S were prepared, treated in the same way as the assay samples, and were used for the quantification of enzymatically formed H2S.
5.12. Other procedures
Protein contents were determined according to Bradford [9] using BSA as protein standard. Alignments were done with Clone Manager 9 (Sci-Ed, Cary, NC, USA) and with ClustalW (http://www.ebi.ac.uk/Tools/msa/clustalw2/).
Author contributions statement
J.P., M.H. and F.F. planned experiments; M.H., N.K., T.T., S.B., and F.F. performed experiments; M.H., N.K., T.T., S.B., F.F., R.S., and J.P. analyzed data; M.H., F.F., and J.P. wrote the paper.
Acknowledgements
We would like to thank Pamela von Trzebiatowski and Silke Walter for their excellent technical assistance. Anshu Kuriakose, Vellore, India, produced some of the mutant thioredoxin clones as a part of her MSc thesis. We acknowledge the gift of recombinant thioredoxin proteins for initial biochemical analysis from Yves Meyer, Perpignan, France, and the gift of split-YFP vectors from Klaus Harter, Tübingen, Germany. The project was originally started in cooperation with Simone Holtgrefe, Osnabrück, and Divya Bagchi, Jabalpur, India. Christian Boestfleisch, Hannover, helped to improve Fig. 2. The work was supported financially by grants from the Deutsche Forschungsgemeinschaft to J.P. (PA 764/1-4 and 1-5), by the Università degli Studi di Milano to T.T., and by the DAAD (Vigoni 0815171).
Enzymes: sulfurtransferase (EC 2.8.1.-); thioredoxin (EC 1.6.4.5)
Footnotes
Supplementary data associated with this article can be found, in the online version, at http://dx.doi.org/10.1016/j.fob.2015.10.001.
Appendix A. Supplementary data
Fig. S1. Positive control. Two parts of the tobacco 14-3-3 transcription factor protein T14-3c (Walter et al. [42]) coupled to YFP were used. Left: Bright field image; middle: YFP emission; right: overlay of autofluorescence and YFP emission. Each pair was tested between four and six times with the same interaction results. Fig. S2. Negative control. Exemplary one negative control between AtStr2 in pUC-SPYNE and the empty pUC-SPYCE vector is shown. Left: Bright field image; middle: YFP emission; right: overlay of autofluorescence and YFP emission. Each pair was tested between four and six times with the same interaction results. Fig. S3. Str activity assay of AtStr1 with different 3-MP concentrations. Fig. S4. Combined enzyme assay using different Str and Trx and 10 μM 3-MP. Fig. S5. Combined enzyme assay using different Str and Trx and 50 μM 3-MP. Fig. S6. H2S releasing assay of Str1 with each component of the assay. Fig. S7. H2S formed with different 3-MP concentrations (black bars), with different 3-MP concentrations and the other components of the assay without Str (grey bars), and with different 3-MP concentrations, the other components, and 0.025 μM Str1 (white bars).
References
- 1.Aussignargues C., Giuliani M., Infossi P., Lojou P., Guiral M., Giudici-Orticoni M., Ilbert M. Rhodanese functions as sulfur supplier for key enzymes in sulfur energy metabolism. J. Biol. Chem. 2012;287:19936–19948. doi: 10.1074/jbc.M111.324863. [DOI] [PMC free article] [PubMed] [Google Scholar]
- 2.Balmer Y., Vensel W.H., Tanaka C.K., Hurkman W.J., Gelhaye E., Rouhier N., Jacquot J.P., Manieri W., Schürmann P., Droux M., Buchanan B.B. Thioredoxin links redox to the regulation of fundamental processes of plant mitochondria. Proc. Natl. Acad. Sci. U.S.A. 2004;101:2642–2647. doi: 10.1073/pnas.0308583101. [DOI] [PMC free article] [PubMed] [Google Scholar]
- 3.Barajas-López Jde D., Serrato A.J., Cazalis R., Meyer Y., Chueca A., Reichheld J.P., Sahrawy M. Circadian regulation of chloroplastic f and m thioredoxins through control of the CCA1 transcription factor. J. Exp. Bot. 2010;62:2039–2051. doi: 10.1093/jxb/erq394. [DOI] [PMC free article] [PubMed] [Google Scholar]
- 4.Bartels A., Forlani F., Pagani S., Papenbrock J. Conformational studies on Arabidopsis sulfurtransferase AtStr1 analysed by spectroscopic methods. J. Biol. Chem. 2007;388:53–59. doi: 10.1515/BC.2007.006. [DOI] [PubMed] [Google Scholar]
- 5.Bauer M., Dietrich C., Nowak K., Sierralta W.D., Papenbrock J. Intracellular localization of sulfurtransferases from Arabidopsis thaliana. Plant Physiol. 2004;135:916–926. doi: 10.1104/pp.104.040121. [DOI] [PMC free article] [PubMed] [Google Scholar]
- 6.Bauer M., Papenbrock J. Identification and characterization of single-domain thiosulfate sulfurtransferases from Arabidopsis thaliana. FEBS Lett. 2002;532:427–431. doi: 10.1016/s0014-5793(02)03723-7. [DOI] [PubMed] [Google Scholar]
- 7.Bhat R.A., Lahaye T., Panstruga R. The visible touch: in planta visualization of protein–protein interactions by fluorophore-based methods. Plant Methods. 2006;2:12. doi: 10.1186/1746-4811-2-12. [DOI] [PMC free article] [PubMed] [Google Scholar]
- 8.Bordo D., Bork P. The rhodanese/Cdc25 phosphatase superfamily, Sequence-structure–function relations. EMBO Rep. 2002;3:741–746. doi: 10.1093/embo-reports/kvf150. [DOI] [PMC free article] [PubMed] [Google Scholar]
- 9.Bradford M.M. A rapid and sensitive method for the quantification of microgram quantities of protein utilizing the principle of protein-dye binding. Anal. Biochem. 1976;72:248–254. doi: 10.1016/0003-2697(76)90527-3. [DOI] [PubMed] [Google Scholar]
- 10.Bracha-Drori K., Shichrur K., Katz A., Oliva M., Angelovici R., Yalovsky S., Ohad N. Detection of protein–protein interactions in plants using bimolecular fluorescence complementation. Plant J. 2004;40:419–427. doi: 10.1111/j.1365-313X.2004.02206.x. [DOI] [PubMed] [Google Scholar]
- 11.Burow M., Kessler D., Papenbrock J. Enzymatic activity of the Arabidopsis sulfurtransferase resides in the C-terminal domain but is boosted by the N-terminal domain and the linker peptide in the full length enzyme. J. Biol. Chem. 2002;383:1363–1372. doi: 10.1515/BC.2002.155. [DOI] [PubMed] [Google Scholar]
- 12.Candiano G., Bruschi M., Musante L., Santucci L., Ghiggeri G.M., Carnemolla B., Orecchia P., Zardi L., Righetti P.G. Blue silver: a very sensitive colloidal Coomassie G-250 staining for proteome analysis. Electrophoresis. 2004;25:1327–1333. doi: 10.1002/elps.200305844. [DOI] [PubMed] [Google Scholar]
- 13.Caplan J.L., Mamillapalli P., Burch-Smith T.M., Czymmek K., Dinesh-Kumar S.P. Chloroplastic protein NRIP1 mediates innate immune receptor recognition of a viral effector. Cell. 2008;132:449–462. doi: 10.1016/j.cell.2007.12.031. [DOI] [PMC free article] [PubMed] [Google Scholar]
- 14.Hancock J.T., Whiteman M. Hydrogen sulfide and cell signaling: team player or referee? Plant Physiol. Biochem. 2014;78:37–42. doi: 10.1016/j.plaphy.2014.02.012. [DOI] [PubMed] [Google Scholar]
- 15.Holmgren A. Thioredoxin catalyzes the reduction of insulin by dithiothreitol and dihydrolipoamide. J. Biol. Chem. 1979;254:9627–9632. [PubMed] [Google Scholar]
- 16.Kerppola T.K. Design and implementation of bimolecular fluorescence complementation (BiFC) assays for the visualization of protein interactions in living cells. Nat. Protoc. 2006;1:1278–1286. doi: 10.1038/nprot.2006.201. [DOI] [PMC free article] [PubMed] [Google Scholar]
- 17.Laemmli U.K. Cleavage of structural proteins during the assembly of the head of bacteriophage T4. Nature. 1970;227:680–685. doi: 10.1038/227680a0. [DOI] [PubMed] [Google Scholar]
- 18.Laloi C., Rayapuram N., Chartier Y., Grienenberger J.M., Bonnard G., Meyer Y. Identification and characterization of a mitochondrial thioredoxin system in plants. Proc. Natl. Acad. Sci. U.S.A. 2001;98:14144–14149. doi: 10.1073/pnas.241340898. [DOI] [PMC free article] [PubMed] [Google Scholar]
- 19.Lee S., Kim S.M., Lee R.T. Thioredoxin and thioredoxin target proteins: from molecular mechanisms to functional significance. Antioxid. Redox Signal. 2013;18:1165–1207. doi: 10.1089/ars.2011.4322. [DOI] [PMC free article] [PubMed] [Google Scholar]
- 20.Maeda K., Hägglund P., Finnie C., Svensson B., Henriksen A. Structural basis for target protein recognition by the protein disulfide reductase thioredoxin. Structure. 2006;14:1701–1710. doi: 10.1016/j.str.2006.09.012. [DOI] [PubMed] [Google Scholar]
- 21.Marchand C., Le Marechal P., Meyer Y., Decottignies P. Comparative proteomic approaches for the isolation of proteins interacting with thioredoxin. Proteomics. 2006;6:6528–6537. doi: 10.1002/pmic.200600443. [DOI] [PubMed] [Google Scholar]
- 22.Meyer Y., Reichheld J., Vignols F. Thioredoxins in Arabidopsis and other plants. Photosynth. Res. 2005;86:419–433. doi: 10.1007/s11120-005-5220-y. [DOI] [PubMed] [Google Scholar]
- 23.Meyer Y., Belin C., Delorme-Hinoux V., Reichheld J.P., Riondet C. Thioredoxin and glutaredoxin systems in plants: molecular mechanisms, crosstalks, and functional significance. Antioxid. Redox Signal. 2012;17:1124–1160. doi: 10.1089/ars.2011.4327. [DOI] [PubMed] [Google Scholar]
- 24.Mikami Y., Shibuya N., Kimura Y., Nagahara N., Ogasawara Y., Kimura H. Thioredoxin and dihydrolipoic acid are required for 3-mercaptopyruvate sulfurtransferase to produce hydrogen sulfide. Biochem. J. 2011;439:479–485. doi: 10.1042/BJ20110841. [DOI] [PubMed] [Google Scholar]
- 25.Nagahara N., Katayama A. Post-translational regulation of mercaptopyruvate sulfurtransferase via a low redox potential cysteine-sulfenate in the maintenance of redox homeostasis. J. Biol. Chem. 2005;280:34569–34576. doi: 10.1074/jbc.M505643200. [DOI] [PubMed] [Google Scholar]
- 26.Nagahara N., Yoshii T., Abe Y., Matsumura T. Thioredoxin-dependent enzymatic activation of mercaptopyruvate sulfurtransferase. J. Biol. Chem. 2007;282:1561–1569. doi: 10.1074/jbc.M605931200. [DOI] [PubMed] [Google Scholar]
- 27.Nandi D.L., Westley J. Reduced thioredoxin as a sulfur-acceptor substrate for rhodanese. Int. J. Biochem. Cell Biol. 1998;30:973–977. doi: 10.1016/s1357-2725(98)00050-8. [DOI] [PubMed] [Google Scholar]
- 28.Nandi D.L., Horowitz P.M., Westley J. Rhodanese as a thioredoxin oxidase. Int. J. Biochem. Cell Biol. 2000;32:465–473. doi: 10.1016/s1357-2725(99)00035-7. [Erratum. In: Int. J. Biochem. Cell. Biol. 2001;33:103] [DOI] [PubMed] [Google Scholar]
- 29.Papenbrock J., Schmidt A. Characterization of a sulfurtransferase from Arabidopsis thaliana. Eur. J. Biochem. 2000;267:145–154. doi: 10.1046/j.1432-1327.2000.00980.x. [DOI] [PubMed] [Google Scholar]
- 30.Papenbrock J., Schmidt A. Characterization of two sulfurtransferase isozymes from Arabidopsis thaliana. Eur. J. Biochem. 2000;267:5571–5579. doi: 10.1046/j.1432-1327.2000.01623.x. [DOI] [PubMed] [Google Scholar]
- 31.Papenbrock J., Guretzki S., Henne M. Latest news about the sulfurtransferases of higher plants. Amino Acids. 2010;41:53–57. doi: 10.1007/s00726-010-0478-6. [DOI] [PubMed] [Google Scholar]
- 32.Papenbrock J., Riemenschneider A., Kampe A., Schulz-Vogt H.N., Schmidt A. Isolation and characterization of cysteine-degrading and H2S-releasing enzymes of higher plants. Plant Biol. 2007;9:582–588. doi: 10.1055/s-2007-965424. [DOI] [PubMed] [Google Scholar]
- 33.Ray W., Zeng G., Potters B., Mansuri A., Larson T. Characterization of a 12-kilodalton rhodanese encoded by glpE of Escherichia coli and its interaction with thioredoxin. J. Bacteriol. 2000;182:2277–2284. doi: 10.1128/jb.182.8.2277-2284.2000. [DOI] [PMC free article] [PubMed] [Google Scholar]
- 34.Remelli W., Cereda A., Papenbrock J., Forlani F., Pagani S. The rhodanese RhdA helps Azotobacter vinelandii in maintaining cellular redox balance. Biochem. J. 2010;391:777–784. doi: 10.1515/BC.2010.073. [DOI] [PubMed] [Google Scholar]
- 35.Remelli W., Guerrieri N., Klodmann J., Papenbrock J., Pagani S., Forlani F. Involvement of the Azotobacter vinelandii rhodanese-like protein RhdA in the glutathione regeneration pathway. PLoS ONE. 2012;7:e45193. doi: 10.1371/journal.pone.0045193. [DOI] [PMC free article] [PubMed] [Google Scholar]
- 36.Roux K.J. Marked by association: techniques for proximity-dependent labeling of proteins in eukaryotic cells. Cell. Mol. Life Sci. 2013;70:3657–3664. doi: 10.1007/s00018-013-1287-3. [DOI] [PMC free article] [PubMed] [Google Scholar]
- 37.Sabelli R., Iorio E., Martino A., Podo F., Ricci A., Viticchiè G., Rotilio G., Paci M., Melino S. Rhodanese-thioredoxin system and allyl sulfur compounds. FEBS J. 2008;275:3884–3899. doi: 10.1111/j.1742-4658.2008.06535.x. [DOI] [PubMed] [Google Scholar]
- 38.Scheibe R., Dietz K.J. Reduction–oxidation network for flexible adjustment of cellular metabolism in photoautotrophic cells. Plant Cell Environ. 2012;35:202–216. doi: 10.1111/j.1365-3040.2011.02319.x. [DOI] [PubMed] [Google Scholar]
- 39.Serrato A., Perrez-Ruiz J., Cejudo F. Cloning of thioredoxin h reductase and characterization of the thioredoxin reductase-thioredoxin h system from wheat. Biochem. J. 2002;367:491–497. doi: 10.1042/BJ20020103. [DOI] [PMC free article] [PubMed] [Google Scholar]
- 40.Siegel M. A direct microdetermination for sulfide. Anal. Biochem. 1965;11:126–132. doi: 10.1016/0003-2697(65)90051-5. [DOI] [PubMed] [Google Scholar]
- 41.Traverso J.A., Vignols F., Cazalis R., Serrato A.J., Pulido P., Sahrawy M., Meyer Y., Cejudo F.J., Chueca A. Immunocytochemical localization of Pisum sativum TRXs f and m in non-photosynthetic tissues. J. Exp. Bot. 2008;59:1267–1277. doi: 10.1093/jxb/ern037. [DOI] [PubMed] [Google Scholar]
- 42.Walter M., Chaban C., Schutze K., Batistic O., Weckermann K., Nake C., Blazevic D., Grefen C., Schumacher K., Oecking C., Harter K., Kudla J. Visualization of protein interactions in living plant cells using bimolecular fluorescence complementation. Plant J. 2004;40:428–438. doi: 10.1111/j.1365-313X.2004.02219.x. [DOI] [PubMed] [Google Scholar]
- 43.Westley J. Rhodanese. Adv. Enzymol. Relat. Areas Mol. Biol. 1973;39:327–368. doi: 10.1002/9780470122846.ch5. [DOI] [PubMed] [Google Scholar]
- 44.Wong S.S., Jameson D.M. 2nd ed. CRC Press; Boca Raton, FL, USA: 2012. Chemistry of protein and nucleic acid cross-linking and conjugation. p 602. [Google Scholar]
- 45.Wu F.H., Shen S.C., Lee L.Y., Lee S.H., Chan M.T., Lin C.S. Tape-arabidopsis sandwich – a simpler arabidopsis protoplast isolation method. Plant Methods. 2009;5:16. doi: 10.1186/1746-4811-5-16. [DOI] [PMC free article] [PubMed] [Google Scholar]
Associated Data
This section collects any data citations, data availability statements, or supplementary materials included in this article.
Supplementary Materials
Fig. S1. Positive control. Two parts of the tobacco 14-3-3 transcription factor protein T14-3c (Walter et al. [42]) coupled to YFP were used. Left: Bright field image; middle: YFP emission; right: overlay of autofluorescence and YFP emission. Each pair was tested between four and six times with the same interaction results. Fig. S2. Negative control. Exemplary one negative control between AtStr2 in pUC-SPYNE and the empty pUC-SPYCE vector is shown. Left: Bright field image; middle: YFP emission; right: overlay of autofluorescence and YFP emission. Each pair was tested between four and six times with the same interaction results. Fig. S3. Str activity assay of AtStr1 with different 3-MP concentrations. Fig. S4. Combined enzyme assay using different Str and Trx and 10 μM 3-MP. Fig. S5. Combined enzyme assay using different Str and Trx and 50 μM 3-MP. Fig. S6. H2S releasing assay of Str1 with each component of the assay. Fig. S7. H2S formed with different 3-MP concentrations (black bars), with different 3-MP concentrations and the other components of the assay without Str (grey bars), and with different 3-MP concentrations, the other components, and 0.025 μM Str1 (white bars).