Abstract
The spectroscopic properties of the organic chromophore 4-naphthoyloxy-1-methoxy-2,2,6,6-tetramethylpiperidine (NfO-TEMPO-Me) in toluene solution are explored through an integrated computational strategy combining a classical dynamic sampling with a quantum mechanical description within the framework of the time-dependent density functional theory (TDDFT) approach. The atomistic simulations are based on an accurately parametrized force field, specifically designed to represent the conformational behavior of the molecule in its ground and bright excited states, whereas TDDFT calculations are performed through a selected combination of hybrid functionals and basis sets to obtain optical spectra closely matching the experimental findings. Solvent effects, crucial to obtain good accuracy, are taken into account through explicit molecules and polarizable continuum descriptions. Although, in the case of toluene, specific solvation is not fundamental, the detailed conformational sampling in solution has confirmed the importance of a dynamic description of the molecular geometry for a reliable description of the photophysical properties of the dye. The agreement between theoretical and experimental data is established and a robust protocol for the prediction of the optical behaviour of flexible fluorophores in solution is set.
1 Introduction
Organic dyes1 have recently attracted a growing attention, thanks to their wide range of applications, that covers different fields in both materials2–11 and life sciences.12–15 In particular, the high selectivity and specificity of some fluorescent molecules in detecting particular molecular targets and/or in modulating the responses to different external stimuli are often exploited to investigate the structural and dynamic properties of a wide variety of complex systems like, e.g., polymeric materials, DNA structures, protein conformations or lipid aggregates.13 In this context, the strong influence of the environment on the fluorescence properties turns out to be a fundamental key in several applications aimed to the design of new technological devices and biomimetic systems. For example, the encapsulation of a dye in a nanoparticle can enhance its fluorescence by altering the dye’s flexibility and protecting it from external quenching agents,5 whereas in mechanochromic materials the optical properties of the dyes are transferred to the whole system, through dispersion of the doping agent in matrices or by grafting it to polymer chains. Indeed, the interaction between the two species (i.e. the polymer and the dye) can be tuned by mechanical stress, in order to properly control both the absorption and emission responses.8,9,11
Spectroscopic techniques are becoming the methods of choice for deeper investigations of the photophysical properties of composite materials.16–18 Unfortunately, often experimental measures alone are not sufficient to unravel the subtle interplay of several effects in determining the overall result. In such circumstances, their synergistic combination with computational approaches can be effectively used both to validate experimental assignments and to provide interpretations of the results in terms of chemical structure, conformational re-adaptation, and molecular motion. Although computational methods can be nowadays applied directly to the study of very complex systems,18 their profitable use also by non-specialists requires the definition, implementation, and validation of robust and general computational protocols. As a matter of fact, quantum mechanical (QM) calculations are unavoidable for spectroscopic characterizations and, in the specific field of electronic spectroscopy (both absorption and emission), Time Dependent Density Functional Theory (TDDFT) has undoubtedly become the most widespread method.19 Although some problems have yet to be fully solved for multiple excitations, charge transfer and Rydberg states, for conventional valence excitations TDDFT based on hybrid (possibly range-separated) density functionals shows a nearly optimal balance between accuracy (related also to the continuous improvement of functionals) and computational inexpensiveness.19–22 In this framework, the energy difference (or vertical energy, VE) between the ground (GS) and the electronically excited state (EES), which leads to the the VE absorption (, computed at the GS equilibrium geometry) or emission ( calculated at the EES equilibrium geometry) wavelengths, can be calculated rather straightforwardly.19 Unfortunately, these quantities alone are not always sufficient to reproduce the experimental band shapes and they cannot be directly compared to the measured maximal absorption () or emission () wavelengths.19,23 In order to reproduce the overall line shapes and their complex features and to reach a more reliable comparison with experimental observations, it is mandatory to take nuclear motions (both of the chromophore and of its environment) into the proper account.23–27 In the case of flexible molecules in condensed phases, some sampling of large parts of the potential energy surfaces (PES) becomes mandatory5,15,28–30 and the most suitable approach is based, in our opinion, on molecular dynamics (MD) simulations followed by proper averaging (and smoothing) of TDDFT results for a sufficient number of representative snapshots. Implicit solvation methods, such as the Polarizable Continuum Model (PCM31), offer the undeniable advantage of correctly describing the average polarization of the environment and its effect on the chromophore without any explicit sampling of solvent coordinates, but they are, of course, unable to capture specific solvent effects especially in the cybotactic region.26,30 This has lead to the proposal of an integrated discrete/continuum model able to describe both short-range and bulk solvent effects in a fully dynamical framework. The so called GLOB model enforces non periodic boundary conditions (NPBC) around a rather large cluster of explicit solvent molecules by means of both PCM reaction field and specific short-range potentials minimizing boundary effects.32,33 Several applications in recent years confirm the reliability and robustness of the GLOB and other related approaches.34–42 Although the classical MD step can be performed also employing conventional periodic conditions in order to use standard codes (here Gromacs), NPBCs are more suitable for QM computations based on localized basis sets. Then the extraction of representative frames can be carried out following different schemes. Within the simple “mechanical embedding” (ME) scheme, for instance, only the dye coordinates are extracted from each snapshot, and the environmental effects are retained only in the solute geometrical variations induced by the presence of the surrounding medium. Conversely, in the “electrostatic embedding” (EE) scheme, the direct electrostatic interaction between the dye and the surrounding environment is accounted for also in the TDDFT calculations. Indeed the EE snapshots are obtained by extracting both solute and a relevant region of the surrounding medium from MD trajectories and the TDDFT calculation is thereafter performed by adopting a full QM description for the dye, a simple (possibly polarizable43–45) point charge description for the retained surrounding environment, and a PCM description of the rest of the solvent. The spectra obtained with “dynamic” approaches are then suitable for a direct comparison with the experimental line shapes: they retain information not only on the peak wavelengths, but also on the broadening and shape of the absorption and emission profiles. Moreover, the simulation of resolved spectra of dyes that are optically active within the visible region makes it possible to predict their actual color, as perceived by the human eye.30,46
In order to reproduce reliably the spectroscopic properties of composite systems, MD simulations should be based on very accurate and specific force fields (FFs). Although a lot of work has been done to describe GS structures and reliable FFs are available in the literature, much less effort has been devoted to the development of “ad hoc” FFs for the EES conformations.35,47–50 Recently, the Joyce51 parameterization protocol, devised to obtain accurate and specific FFs from QM computed data, has been extended to the automated treatment of both GS and EES.50
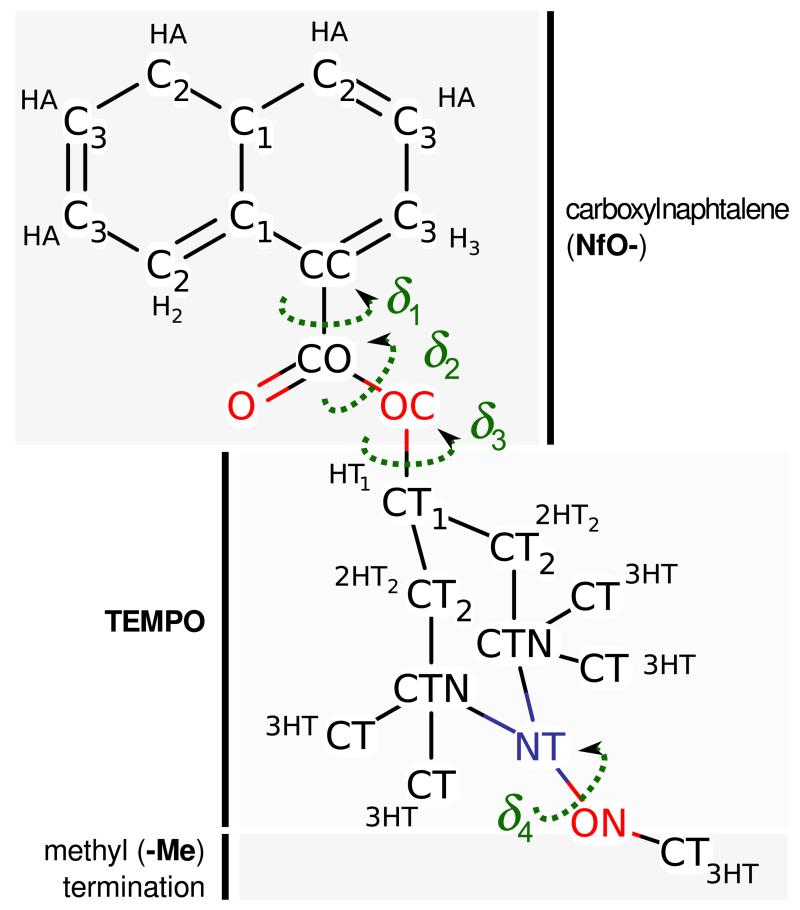
In the present work, the above mentioned “dynamic” approach is applied to compute the electronic spectra of a flexible dye, namely the 4-naphthoyloxy-1-methoxy-2,2,6,6-tetramethylpiperidine (NfO-TEMPO-Me) molecule (see Figure 2), in toluene solution, where solvent molecules are modeled explicitly. This compound is interesting because of its potential application in the design of “smart” polymers with mechanochromic attributes as proven by the experimental characterization obtained through spectroscopic techniques and reported in a recent paper.52–54 More specifically, the 2,2,6,6-tetramethyl-piperidine-1-oxyl (TEMPO) unit was used, in combination with functionalizing groups such as hydroxyl, benzyl, naphthyl (HO-, BzO- and NfO- TEMPO), for grafting the fluorescent probe to polyethylene derivatives via post-reactor modification.52,53 The NfO-TEMPO derivative, substituted with a methyl group at the grafting site, has been studied from both experimental and theoretical points of view in toluene solution.53,54 The theoretical analysis54 depicted a complex conformational landscape, containing six stable conformers, characterized by different values of the three flexible dihedral angles describing the relative orientation of the naphthyl moiety and the TEMPO ring system (see Figure 2). Although this flexibility would suggest that several conformers contribute to the overall spectral shape, previous results54 indicate that a conventional approach, employing vertical excitation calculations at the TDDFT/PCM level, performs a good job in reproducing experimental results at least concerning the positions of peak maxima in both absorption and emission spectra. Here the previous computational study is extended towards a statistical approach, with the two-fold aim of achieving a more realistic sampling of the NfO-TEMPO-Me dye and solvent conformations, and possibly gaining a deeper insight into the structural and dynamic features that tune the spectroscopic characteristics of the system. From a more general point of view, the present study represents a further validation of a multi-level computational approach. The good result obtained on this system encourages to prove the reliability of the estabilished method on more complex materials such as functionalized polymers52,53 and other types of composite systems.
Figure 2.
The NfO-TEMPO molecule. The atom types employed in the Force Field and the four main flexible dihedrals are shown.
2 Computational details
2.1 General approach
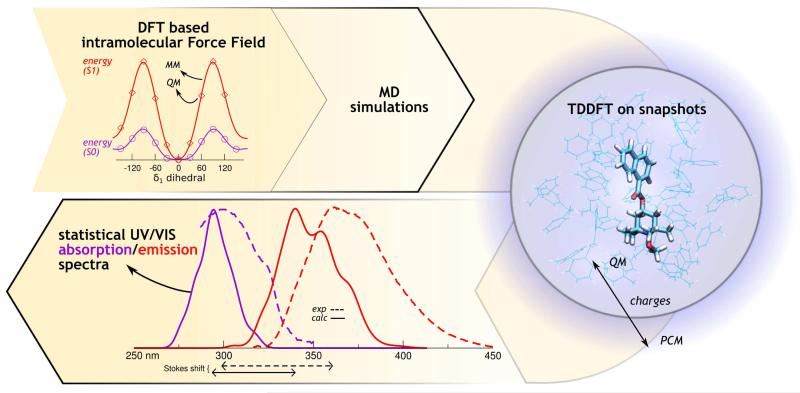
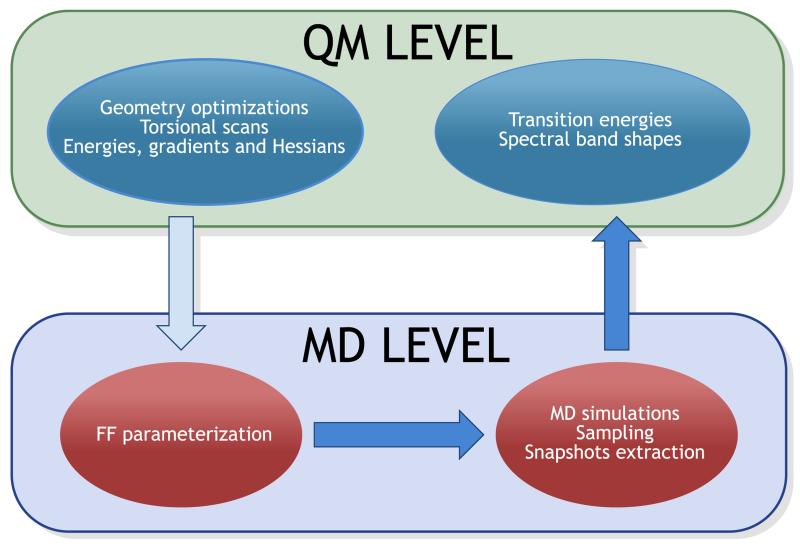
The multi-level approach adopted in the present work is sketched in Figure 11 and can be sumarized as follows.
Figure 11.
-
i)
QM calculations are performed on the target molecule, to sample the conformational space of both GS and EES, identify their minima and compute both the energy and its first and second derivatives at stationary points. Further geometry optimizations are performed at selected values of soft variables in order to better define specific FF terms (vide infra).
-
ii)
QM data are used by Joyce in two separate FF parameterizations of GS and EES, respectively.
-
iii)
GS and EES parameterized FFs are employed in MD simulations of the target dye surrounded by explicit solvent molecules (toluene) employing periodic boundary conditions. The MD trajectories are sampled during the dynamics and representative solute geometries are extracted, with (EE) and without (ME) explicit solvent molecules.
-
iv)
All the resulting mechanically and electrostatically embedded structures are employed in TDDFT QM calculations to compute the transition energies to the first EESs adding to EE structures only a PCM descritpion of bulk solvent effects.
-
v)
The transition energies obtained from the GS and EES snapshots are finally combined to yield the absorption and emission spectra, respectively.
2.2 QM calculations
The conformational search of NfO-TEMPO-Me in toluene solution was performed in a previous study.54 Starting from the most stable conformers identified in that investigation, DFT and TDDFT geometry optimizations in the gas phase, for the GS and EES respectively, were carried out using the PBE0 hybrid exchange-correlation functional and the N07D basis set.55,56 For these optimized structures, gradients, Hessian matrices and harmonic vibrational frequencies were calculated at the same level of theory. Moreover, QM energy scans along the δ1, δ3 and δ4 flexible dihedrals (see Figure 2) were performed by varying each dihedral angle from 0° to 360°, in steps of 30°, minimizing the energy without any constraint, but the scanned coordinate. All electronic transitions were computed by means of the TDDFT method on the ME and EE snapshots extracted from the MD simulations, considering the seven lowest transition for each frame. As far as the EE snapshots are concerned, toluene molecules extracted from the MD frames were replaced by fixed atomic point charges, whereas bulk solvent effects were accounted for through the PCM approach.31 The direct electrostatic effect of the solvent on the electronic property is entirely neglected in the ME scheme, by switching off both the implicit and the explicit solvation schemes. The performances of different functionals, namely PBE0 and CAM-B3LYP, in combination with N07D57 and cc-pvDz basis sets, were explored.
The Gaussian09 suite of programs58 has been used to carry out all QM calculations.
2.3 FF parameterization
The intramolecular FF employed for the description of NfO-TEMPO-Me, Eintra, takes the standard form:
| (1) |
where the first three terms are represented by harmonic expressions
| (2) |
In equation (2) , , and , , are the force constants and equilibrium values for stretching, bending and stiff torsional internal coordinates,50 respectively. The potential energies governing rotations around dihedrals δ1-δ4 are described by sums of cosines, namely
| (3) |
where is the force constant, δμ the dihedral, and the multiplicity and a phase factor for the jth cosine. Nμ is the number of cosine functions employed for dihedral μ. The last term of equation (1) is computed as
| (4) |
where the interaction between the ith and jth atoms is described through a 12-6 Lennard Jones (LJ) plus Coulomb charge-charge potential (Enb intra).
Both the solute GS and EES FFs were parameterized by the Joyce package,50,51 through a least square minimization of the functional Iintra
| (5) |
where Ngeom is the number of the sampled conformations, QK is the Kth normal coordinate and Ug is the QM computed energy in the gth geometry, with respect to the absolute minimum (g = 0). The QM Hessian matrix HKL and the FF Hessian are evaluated at g = 0. All the geometry weights Wg are set to the same unitary value; the diagonal and off diagonal weights of the Hessian matrix elements are set to 5000 and 2500 respectively. More details on the minimization procedure can be found in previous works.50,51
As far as the interaction of the NfO-TEMPO molecule with the solvent is concerned, the standard 12-6 LJ plus charge-charge potential was adopted. For the solute, LJ intermolecular parameters were taken from the OPLS FF59,60 and the atomic point charges were obtained from the equilibrium GS and EES QM geometries through the CM5 procedure.61 Conversely OPLS literature parameters59 were employed for the solvent in all simulations, i.e. with the solute in its ground or excited state.
2.4 MM optimizations and MD simulations
Full or partial energy optimizations at the MM level were performed using the conjugate gradient algorithm available within the Gromacs 4.5.4 package.62 Structures were minimized with a convergence treshold on the root-mean-square forces of 1 kJ·mol−1 · nm−1. Harmonic dihedral restraints of 1000 kJ·mol−1 were imposed on the scanned internal dihedrals when needed.
All the MD simulations were carried out with Gromacs4.5.4.62 The GS and EES FFs of the dye were employed for both simulations in vacuo and in solution. The system simulated in solution consisted of one NfO-TEMPO-Me molecule inserted in a cubic box and surrounded by 991 toluene molecules. Periodic boundary conditions were applied in all directions and the simulation time step was set to 0.5 fs. Long-range electrostatic interactions were treated with the particle mesh Ewald (PME) method, whereas a 14 Å cuto was applied to the van der Waals interactions. The production run was preceded by an equilibration phase during which the starting configuration was firstly energy minimized, to remove unfavourable steric interactions. The resulting configuration was subjected to a further equilibration protocol coupling the system to a thermal bath at temperature T = 300 K (with a coupling constant of 0.1 ps) and a pressure bath with pressure P = 1 atm (with a coupling constant of 1.0 ps) for a total period of 1 ns. Starting from the final structure, a 3 ns-production dynamics was carried out in the NPT ensemble. During both the equilibration and production phases Berendsen’s weak coupling schemes63 were employed. Configurations were stored every 0.5 ps for further analysis. Simulations in the gas phase were performed in the NVT ensemble at 300 K and the total sampling time was 1.2 ns. Selected snapshots were extracted from the MD trajectories and used for the simulations of the spectra. The samples consisted of 80 and 200 configurations for the simulation in the gas phase and in solution, respectively. In the latter case, two sets of snapshots were extracted, for the ME and EE schemes, containing respectively only the solute or the solute plus all toluene molecules within a radius Rcut from its center of mass.
2.5 Statistical calculation of the UV-VIS spectra
The transition energies computed on each set of snapshots were convoluted with gaussian functions in the energy domain with half width at half maximum (HWHM Δν) of 0.05 eV. Thus, the spectrum computed for the c-th frame is
| (6) |
where and fc,i are the energy and the oscillator strength of the i-th excited state, respectively, whereas . For a vis-à-vis comparison with the experimental data, the energy spectrum is then plotted in the wavelength domain (ϵc(λ)). The signals originating from each snapshot are then averaged according to the equation:
| (7) |
to achieve the final “statistical” UV-VIS spectrum for a given functional-basis choice.
3 Results
3.1 NfO-TEMPO FF parameterization
As indicated in Section 2, NfO-TEMPO intermolecular parameters were transferred from OPLS59,60 FF (LJ) or obtained from QM data (CM5 point charges). The atom types chosen to model the NfO-TEMPO molecule, for both GS and EES, are reported in Figure 2. All intermolecular parameters can be found in the supporting information.
The intramolecular FF parameterization was performed by minimizing the functional (5), achieving standard deviations of 0.172 kJ/mol and 0.165 kJ/mol for GS and EES, respectively. Inspection of Table 1 (where a selected set of the optimal parameters is reported) shows that the parameterized FF is able to capture even subtle differences between similar internal coordinates, that could not be distinguished by general purpose FFs. In the GS parameterization, for instance, a non negligible difference is found between the C1-C2 and the C2-C3 aromatic bonds in the naphthalene moiety, which are described by slightly different equilibrium distances (1.42 and 1.38 Å) and remarkably different force constants (2954 and 3897 kJ/mol Å−2, respectively). Structure rearrangements taking place upon electronic transition are also accounted for, as indicated by the changes shown by FF parameters between the GS and EES FF. For instance the CC-CO equilibrium bond distance decreases from 1.49 Å to 1.45 Å and the relative force constant increases by ~ 500 kJ/mol Å−2, paralleling the partial π character that the bond assumes in the EES. It is worth noticing that in the EES, as a result of the increased delocalization of the naphthalene π cloud toward the carboxyl region, the naphthalene structure reduces its conjugate character and consequently its rigidity, as can be seen from the decrease by ~ 50 kJ/mol of the harmonic improper dihedral terms describing the out-of-plane deviations in the region.
Table 1.
Selected FFs parameters for NfO-TEMPO-Me as optimized by JOYCE. The atom types are reported in fig. 2. The equilibrium coordinates r0, θ0, ϕ0 (reported in Å and deg, respectively) and the force constants kb, kb, kt, (in kJ/mol Å−2, kJ/mol rad−2 and kJ/mol) have been defined in equations (1-3). The complete parameter set can be found in the supporting informations.
| GS | EES | ||||
|---|---|---|---|---|---|
|
| |||||
| Moiety | Bonds | r 0 | ks | r 0 | ks |
| NfO | C2-C3 | 1.38 | 3897 | 1.42 | 3033 |
| C3-C3 | 1.41 | 3341 | 1.38 | 3801 | |
| C1-CC | 1.44 | 2554 | 1.44 | 2498 | |
| C3-CC | 1.38 | 3507 | 1.44 | 2763 | |
| CC-CO | 1.49 | 2034 | 1.45 | 2489 | |
| CO-O | 1.21 | 6703 | 1.23 | 5682 | |
| CO-OC | 1.35 | 2936 | 1.36 | 2848 | |
| OC-CT1 | 1.44 | 2390 | 1.43 | 2441 | |
|
| |||||
| TEMPO-Me | CT1-CT2 | 1.52 | 2276 | 1.52 | 2226 |
| CT2-CTN | 1.54 | 1936 | 1.54 | 1924 | |
| CTN-NT | 1.49 | 2053 | 1.49 | 2036 | |
| NT-ON | 1.42 | 2444 | 1.42 | 2416 | |
| ON-CT | 1.41 | 2491 | 1.41 | 2503 | |
|
| |||||
| Moiety | Angles | θ 0 | kb | θ 0 | kb |
|
| |||||
| NfO | C2-C1-C1 | 118 | 581 | 118 | 383 |
| C2-C1-CC | 124 | 805 | 123 | 709 | |
| C2-C3-C3 | 121 | 648 | 119 | 581 | |
| C1-CC-CO | 122 | 420 | 122 | 234 | |
| O-CO-OC | 122 | 968 | 121 | 1013 | |
|
| |||||
| TEMPO | CO-OC-CT1 | 117 | 727 | 117 | 661 |
|
| |||||
| Moiety | Harmonic dihedrals | ϕ 0 | kt | ϕ 0 | kt |
|
| |||||
| NfO | C*-C*-C*-C* (cis) | 0 | 53.6 | 0 | 47.6 |
| C*-C1-C1-C2 (trans) | 180 | 53.6 | 180 | 47.6 | |
| H*-C*-C*-C* (o.o.p.) | 0 | 554.2 | 0 | 490.4 | |
| O-CO-OC-CT1 (δ2) | 0 | 30.3 | 0 | 30.3 | |
| CC-O-OC-CO (o.o.p.) | 0 | 928.6 | 0 | 670.5 | |
|
| |||||
| Moiety | Periodic dihedrals | nj | nj | ||
|
| |||||
| TEMPO | OC-CT1-CT2-CTN | 3 | 8.95 | 3 | 7.77 |
Broadly speaking, the force constants relative to the internal coordinates of the carboxylnaphtalene group show rather substantial differences between GS and EES: changes as large as 22%, 47% and 31% are found for the stretching, bending and torsion harmonic terms, respectively. Instead, negligible modifications were found in the parameters relative to the TEMPO-Me region, with deviations on the stretching and bending harmonic terms lower than 2% and 8%, respectively. A tentative explanation lies in the fact that NfO-TEMPO-Me HOMO and LUMO orbitals are essentially localized on the carboxyl-naphtalene portion of the molecule,54 that can thus be considered the most relevant part in the description of the optical behavior of this compound.
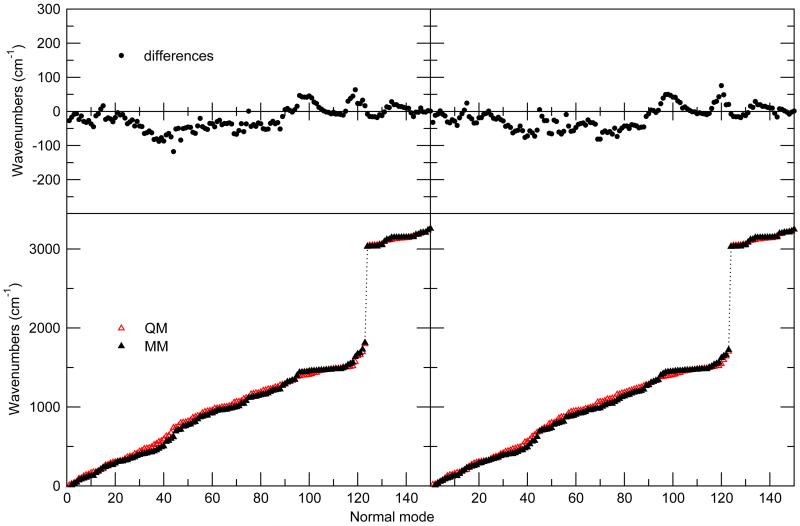
The capability of the new FF to reproduce correctly the vibrational behavior of the molecule is quantified by comparing the normal mode frequencies computed at the QM and MM levels (see Figure 3). A good agreement is achieved, resulting in a root mean square deviation of 38 and 37 cm−1, for GS and EES, respectively. It may be worth noticing that the achieved accuracy is in line with the results obtained in previous parameterizations,50 hence a rather reliable representation of the NfO-TEMPO vibrational behavior is expected during MD simulations.
Figure 3.
NfO-TEMPO vibrational frequencies in GS and EES. Bottom: comparison between QM and MM computed frequencies. Top: differences between the two descriptions.
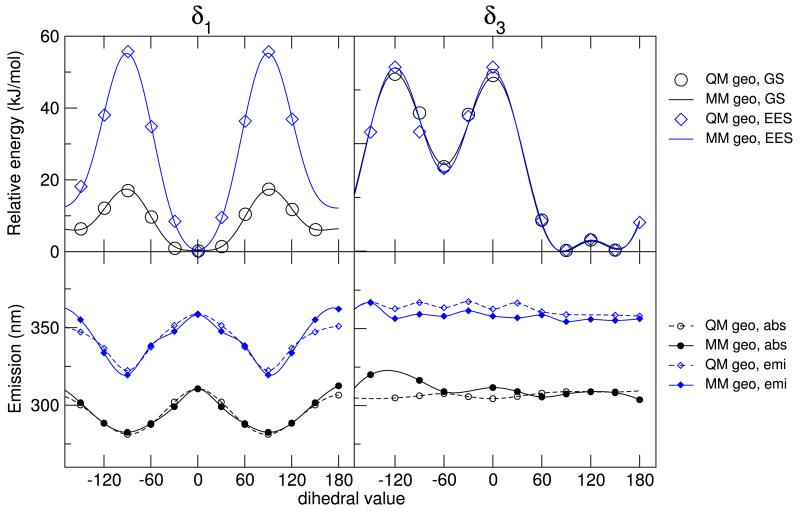
As far as the the two flexible dihedral angles, δ1 and δ3, are concerned, they are expected to affect the conformation of the NfO moiety, and therefore, for each dihedral, the reference QM torsional energy scan was performed separately for GS and EES. Conversely, for computational convenience, the QM δ4 scan was performed only for GS, and the resulting FF parameters were simply transferred from the GS to the EES FF. For all dihedrals, both FFs accurately match their QM reference energy profile. In the top panel of Figure 4 the QM energies calculated for the optimized geometries at a given torsional angle are compared to their MM counterparts, showing a very good agreement for both GS and EES. As could be expected considering the localization of the HOMO and LUMO orbitals,54 major differences between GS and EES profiles were found, at both QM and MM level, only for δ1, whereas the δ3 torsional curve does not undergo noticeable changes upon electronic transition. The different steepness around the δ1 minimum is also in agreement with the partial π character of the CC-CO bond revealed by the force constants analysis.
Figure 4.
FF description of the dihedral angles. Top: energy profiles along the δ1 and δ3 internal dihedrals for GS and EES, at QM and FF level. Bottom: single point excitation wavelengths at partially optimized QM and MM geometries
On the grounds of earlier studies,34,35 it is expected that the dihedral description strongly affects the optical properties of the molecule. The absorption and emission wavelength have been calculated, at the VE TD-DFT level, for all the QM and MM geometries, obtained in the torsional energy scans. The results are shown in the bottom panel of Figure 4. As a matter of fact, both absorption and emission wavelengths for QM and MM optimized geometries show a strong dependence on the δ1 angle, which is responsible for the relative orientation of the naphthyl and carboxyl moieties within the NfO portion of the molecule. The values computed for the MM geometries are in good agreement with those identified by the QM calculations, with slightly larger differences (+ 6.0 nm for absorption, and + 11.1 nm for emission) in the case of δ1 = 180°. Nonetheless, the latter conformation is expected to be scarcely populated at room temperature, considering its relative stability (≃ 12 kJ/mol) and high interconversion barrier (≃ 60 kJ/mol) with respect to the absolute energy minimum (at δ1 = 0 deg). As long as δ3 is concerned, its effect on is less pronounced, with some minor variations found in emission for δ3 ~ 30°. This scarce sensitivity is not surprising, considering that the HOMO and LUMO orbitals are localized in molecular regions not involved in the δ3 torsion. As for δ1, the FF mimics with rather good accuracy this behavior, with slightly larger deviations for absorption, found in high energy conformations (δ3 < −60°).
3.2 Simulations
The GS and EES parameterized FFs were employed in two sets of MD simulations, performed on the isolated dye at 300 K and on the solvated NfO-TEMPO at 1 atm and 300 K. All four systems (i.e. GS and EES in vacuo and solvated GS and EES) were equilibrated for 1 ns, and subsequently simulated for 1.2 and 3 ns (for the in vacuo and solvated phase, respectively), saving trajectories every 0.5 ps.
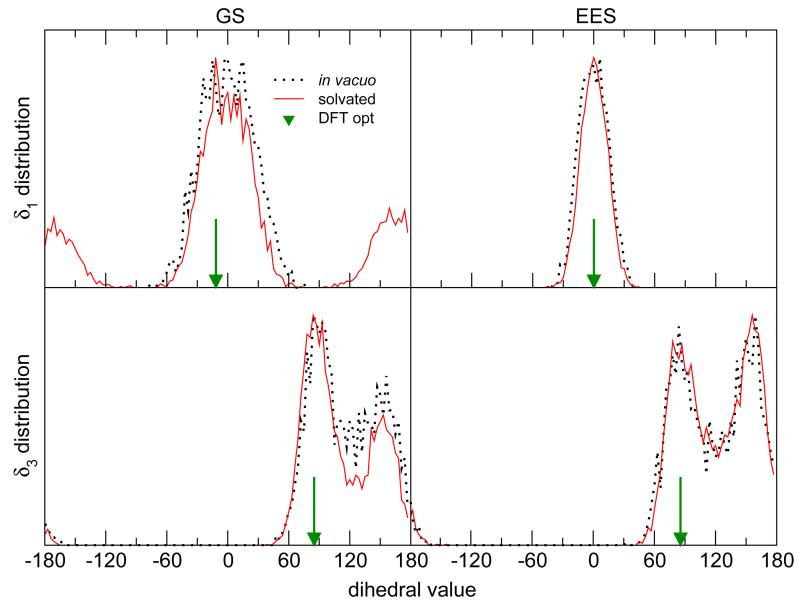
The dye internal structure, along the four different simulations has been first evaluated by looking at the distributions of the two main flexible dihedrals, reported in Figure 5. As regards the GS simulation in gas phase (black dotted line) δ1 remains constrained to the main potential well, and its distribution is symmetrically broadened around 0°, the QM reference value being within this well, at about −12°. The solvated system shows similar distributions within δ1 ≃ 0° region, but the interaction with the solvent allows for exploring also the local minimum at about 180°. Conversely, due to the increased steepness around the δ1 minimum region found in the torsional profile, the EES population distribution is much narrower for both isolated and solvated systems, and the 180° region is never explored. This indicates that any possibility for δ1 to be trapped in the above-mentioned region (either by vertical excitation from the GS or internal convertion from higher EES) is neglected at this level. The δ3 distribution shows, instead, a double peak for both GS and EES simulations, with the first one corresponding to the QM value of about 85° and the second one located at δ3 ≃ 150° i.e. close to the second local minimum found in the torsional energy scan reported in Figure 4.
Figure 5.
Distributions of the δ1 (top) and δ3 (bottom) dihedrals during the simulations, compared to the QM optimized geometry. The curves are normalized to their maximum value. For NfO-TEMPO-Me the ground state (left) and the electronically excited state (right) are considered.
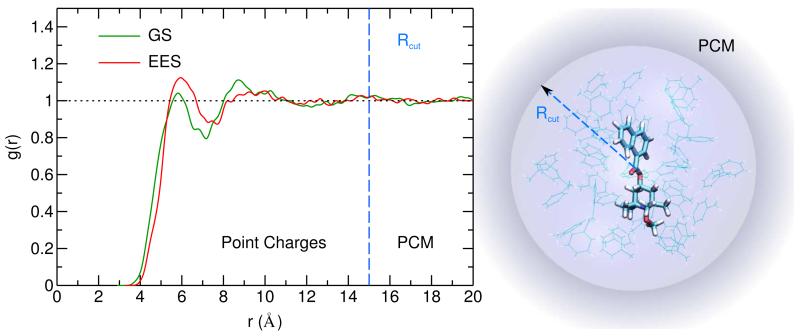
Furthermore, as the solvated systems are concerned, the local solvent structure around the dye has been monitored by computing the pair correlation function between the NfO-TEMPO and toluene centers of mass, for both GS and EES. Inspection of Figure 6 shows that some differences arise in the first solvation shell for GS end EES, the number of first neighbors being larger in the latter case. On the other hand, the differences become negligible for the second solvation shell and at distances larger than 13 Å both pair correlation functions converge to an homogeneous density. Clearly, a continuum model is unable to account for these local features, and for this reason a portion of the surrounding solvent was included in the snapshots extracted for the EE calculations. In particular, all solvent molecules within a radius Rcut of 15 Å were included explicitly. Indeed, beyond this distance, the pair correlation function has reached its asymptotic value, and the PCM can be confidently applied, as shown pictorially in the right panel of Figure 6. The included solvent molecules amount on average to 30, with a standard deviation of 2, for both GS and EES simulations.
Figure 6.
Left panel: solute – solvent pair correlation functions relative to the GS and EES simulations. Right panel: layered hybrid description of the dye in solution. The dye is described at QM level, a 15 Å large sphere of explicit toluene atomic charges is placed around it, and is embedded in a spherical PCM cavity.
3.3 Absorption spectra
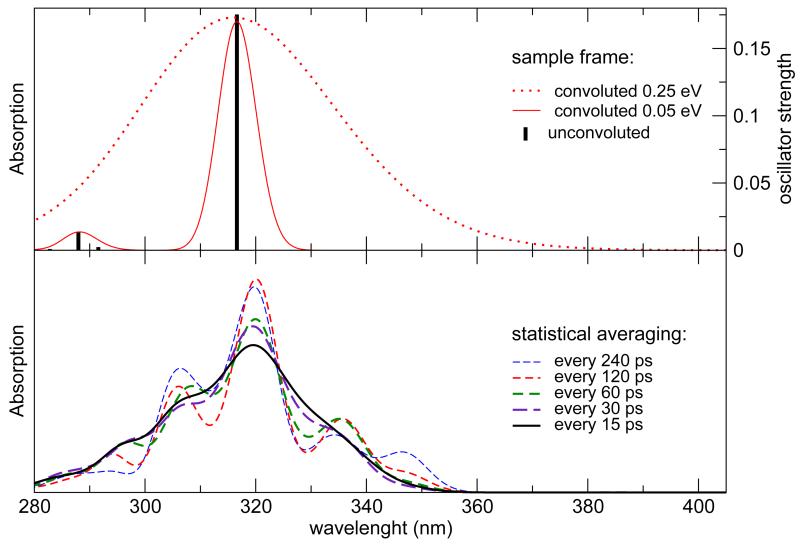
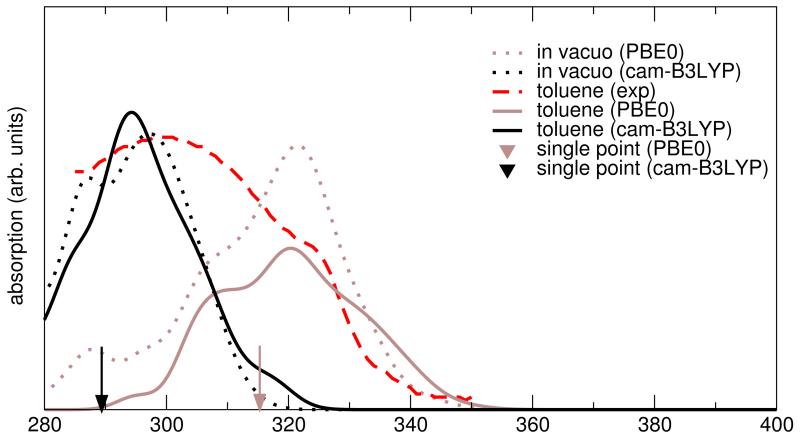
Snapshots spaced by constant time intervals are then extracted from the MD simulations and used to calculate the UV/VIS spectra with an integrated TD-DFT/charges/PCM computational setup. In Figure 7, top panel, a typical unconvoluted absorption spectrum from a random frame is shown in black bars. A Gaussian broadening was applied according to equation (6) with two different values for Δν: 0.25 eV is the value used in the previous time-independent study of NfO-TEMPO-Me,54 whereas 0.05 eV is the value chosen for the present work. In the bottom panel, the absorption spectrum is obtained by averaging, over an increasing number of snapshots, the signals broadened with Δν = 0.05 eV for each frame. It should be noted that the overall spectrum results now from the sum of hundreds of Gaussian functions, centered at different positions, that converges to a smooth, averaged line when the sampling is reliable. The inclusion of one frame every 15 ps of MD is chosen for all the computations in the following, in order to achieve a smooth statistical description without artifacts arising from the sampling itself. The dynamic approach proposed in the present study red-shifts the absorption wavelength, , by about 2 nm, with respect to the static approach employed in a previuos work.54 Unfortunately, the static value (315 nm) did already overestimate the experimental by 16 nm, so that dynamical effects seem to worsen agreement with experiment. Since the choice of the functional / basis set could play a role in determining this trend, other functional/basis set pairs have been explored, eventually obtaining remarkably accurate results by combining the CAM-B3LYP functional with the cc-pvDz basis set (sse Figure 8). In this case, the static approach (black placemark in the graph) underestimates the experimental peak wavelength by 10 nm, but this error is corrected by the MD treatment with a 3 nm red-shift. The thermal broadening of the absorption line, obtained by including different snapshots, allows a more direct comparison of the spectra, resulting in a good agreement between the computed and the experimental54 (292 nm and 299 nm, respectively). Concerning solvent effects, it should be noted that solvatochromic shifts are quite negligible, leading to very similar spectra in the gas phase and in solution.
Figure 7.
Statistical averaging of UV/VIS spectra of absorption. Top: the stick spectrum calculated from a sample snapshot of the GS dynamics in toluene at the PBE0/N07D level of theory, convoluted using different values for Δν. Bottom: average signal from the 5 ns MD exploiting an increasing number of snapshots and Δν = 0.05 eV.
Figure 8.
Absorption spectra in vacuo (dotted) and in toluene solution (solid line) calculated with different DFT XC functionals (PBE0: brown, CAM-B3LYP: black) in the statistical approach, compared to the static approach (placemarks) and to the experimental spectrum. The same normalization was used for all the computed spectra.
3.4 Emission spectra
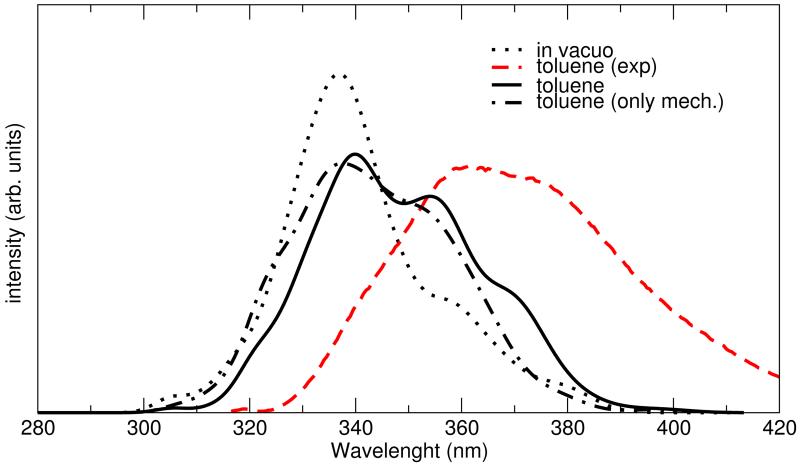
Emission spectra were computed at the CAM-B3LYP/cc-pvDz level with the same approach adopted for absorption and the resulting spectral lines are reported in Figure 9. Inspection of the figure shows that the emission profile of NfO-TEMPO-Me in toluene solution reproduces fairly well the experimental data, especially the line-shape and its decay, although the peak is blue-shifted by about 15 nm. At variance with absorption, the effect of the solvent on the spectral shape is quite significant. In this case the spectrum in the gas phase is less broadened and centered at a shorter wavelength (by about 17 nm) so that a non negligible solvatochromic shift is observed. It is worth noticing that the increased sensitivity to the solvent, found for EES with respect to GS, is consistent with the augmented flexibility of the napthalene skeleton (i.e. where HOMO and LUMO orbitals are essentially localized) evidenced by the FF and with the larger number of solvent molecule found in the first solvation shell by pair correlation function analysis. A deeper insight on this solvent effect can nonetheless be gained by comparing the spectra obtained with ME and EE methods. As it can be seen in Figure 9, the main contribution to the broadening is accounted for alreadty at ME level, whereas the inclusion of the direct electrostatic interaction in the TDDFT calculations, achieved with EE, only tunes the signal, evidencing two shoulders at ~ 355 and 370 nm.
Figure 9.
Emission spectra calculated in the statistical approach with the CAM-B3LYP functional compared to the experimental spectrum. The spectra are calculated in vacuo (dotted) and toluene solution (solid line), considering also the ”mechanical embedding” alone (dash-dotted line).
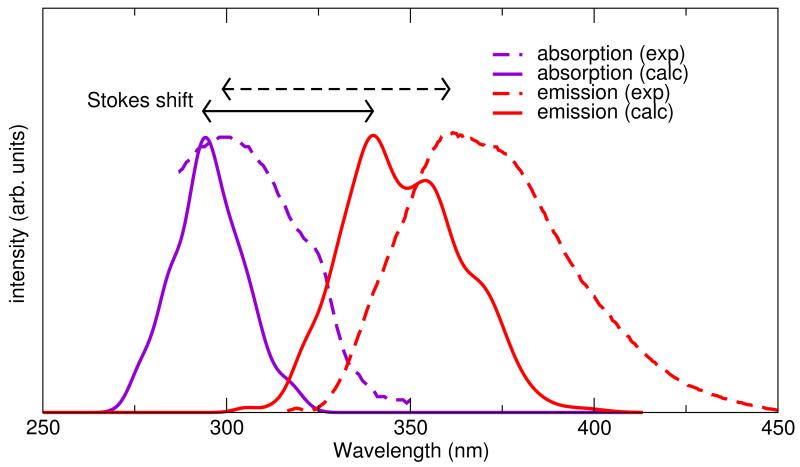
Results obtained previously with a vertical excitation approach54 and with the present time dependent protocol are summarized in Table 2, whereas the final computed absorption and emission spectra are compared with their experimental counterparts in Figure 10. The dynamic approach has the clear advantage of providing a detailed band shape that can be directly compared with the experimental signals, moreover it can reproduce true maximal absorption and emission wavelength , instead of vertical energies , which are closely related to the experimental values. Indeed, in the present case, a slightly better agreement with the experiments is also achieved. More important, the Stokes shift, which is defined as the difference between and , can now be computed more rigourosly, yielding a good agreement (8 nm) with the experimental one.
Table 2.
Comparison of the absorption peak wavelengths and the Stokes shifts for the Nfo-TEMPO-Me UV/VIS spectrum from different methods. TD-DFT/PCM calculations at the equilibrium geometry are referred to as Single point, while the statistical approach is the one based on MD simulations.
| Method | Absorption wavelength | Stokes shift | |||
|---|---|---|---|---|---|
| gas phase | toluene | gas phase | toluene | ||
| Experimentala | 299 nm | 62 nm | |||
|
| |||||
| Single point | PBE0/N07Da | 315 nm | |||
| CAM-B3LYP/cc-pvDzb | 289 nm | ||||
|
| |||||
| Statisticalb | PBE0/N07D | 316 nm | 317 nm | 38 nm | 50 nm |
| CAM-B3LYP/cc-pvDz | 292 nm | 292 nm | 37 nm | 54 nm | |
Ref. [54];
this work
Figure 10.
Time dependent computed (solid lines) and experimental (dotted lines) absorption and emission spectra. Stokes shift are indicated with black arrows.
4 Conclusions
The time dependent protocol used in this work for the computation of absorption and emission spectra of the NfO-TEMPO dye in toluene solution was able to reproduce peak wavelengths, spectral line shapes and Stokes shifts in good agreement with the experimental data. With respect to the static approach, which was previously54 adopted by our group to study the NfO-TEMPO system, the description of the spectroscopic behaviour of the solvated dye is significantly improved, and a more reliable comparison with the measured spectra is now possible, due to the availability of the band shapes and the consequent correct definiton of .
Besides the results achieved, the choice of adopting this time dependent protocol can be a posterori validated in consideration of two important features. First, an accurate representation of the molecular flexibility is found to be important. This is because there is a strong dependence of the spectral response on the molecular conformation. As a consequence, the use of a specific and reliable FF is essential when classical MD techniques are employed for the statistical sampling. Furthermore, although strong specific solute-solvent interactions are not expected in the present case, an explicit account for the solvent molecules remains essential for a correct description of EES, where both ME and EE altered remarkably the in vacuo computed spectral line shape
As already observed in previous works, the present protocol is well suited also for the description of more complex systems,34,35,38,39 where the surrounding medium consists of advanced materials such as nano-particles, polymers, lipid bilayers and other types of molecular environments. Indeed, the extension of the present computational procedure to the study of the NfO-TEMPO dye in a polymeric matrix is currently in progress.
Finally, it may be important to note that, in the in silico design of such complex materials, the choice of a reliable combination of DFT functional and basis set is of fundamental importance. The present work suggests that the selection of the most suitable combination in the TDDFT calculations of the spectral properties should be driven by the comparison of the experimental spectra with broadened theoretical lines, rather than by single point vertical excitations. According to the more or less flexible structure of the target dye and/or to the strenght of the interactions with the surrounding medium, this can be done in a time independent fashion, by accounting for the vibronic structure,27 or through a time-dependent statistical approach, as done in the present work.
Supplementary Material
Figure 1.
Scheme of the multi-level approach.
Aknowledgements
The research leading to these results has been supported by the European Unions Seventh Framework Programme (FP7/2007-2013) under Grant Agreement No. ERC-2012-AdG-320951-DREAMS and by the Fondazione Cassa di Risparmio di Pisa under POLOPTEL project no. 167/09.
Footnotes
The complete parameter files in Gromacs4.5.4 format, the velocity autocorrelation function of the dye throughout the MD simulation and the dependence of the TDDFT calculation on the explicit solvent shell radius Rcut are provided as supporting information. This information is available free of charge via the Internet at http://pubs.acs.org/
References
- [1].Zollinger H. Color Chemistry: Syntheses, Properties, and Applications of Organic Dyes and Pigments. John Wiley & Sons; 2003. [Google Scholar]
- [2].Sagara Y, Kato T. Nature Chem. 2009;1:605–610. doi: 10.1038/nchem.411. [DOI] [PubMed] [Google Scholar]
- [3].Zhang X, Rehm S, S.-S. M, W. F. Nature Chem. 2009;1:623–629. doi: 10.1038/nchem.368. [DOI] [PubMed] [Google Scholar]
- [4].Davis D, Hamilton A, Yang J, Cremar L, Gough DV, Potisek S, Ong M, Braun P, Martinez T, White S, Moore J, Sottos N. Nature. 2009;459:68–72. doi: 10.1038/nature07970. [DOI] [PubMed] [Google Scholar]
- [5].Larson DR, Ow H, Vishwasrao HD, Heikal A. a., Wiesner U, Webb WW. Chem. Mater. 2008;20:2677–2684. [Google Scholar]
- [6].Hagfeldt A, Boschloo G, Sun L, Kloo L, Pettersson H. Chem. Rev. 2010;110:6595–6663. doi: 10.1021/cr900356p. [DOI] [PubMed] [Google Scholar]
- [7].Kim H, Guo Z, Zhu W, Yoon J, Tian H. Chem. Soc. Rev. 2011;40:79–93. doi: 10.1039/c0cs00058b. [DOI] [PubMed] [Google Scholar]
- [8].Pucci A, Bizzarri R, Ruggeri G. Soft Matter. 2011;7:3689–3700. [Google Scholar]
- [9].Pucci A, Ruggeri G. J. Mater. Chem. 2011;21:8282–8291. [Google Scholar]
- [10].Chen Y, Spiering A, Karthikeyan S, Peters G, Meijer E, Sijbesma R. Nature Chem. 2012;4:559–562. doi: 10.1038/nchem.1358. [DOI] [PubMed] [Google Scholar]
- [11].Ciardelli F, Ruggeri G, Pucci A. Chem. Soc. Rev. 2013;42:857–870. doi: 10.1039/c2cs35414d. [DOI] [PubMed] [Google Scholar]
- [12].Nalwa H. Handbook of Photochemistry and Photobiology. American Scientific Publishers; 2003. [Google Scholar]
- [13].Haugland RP. The Handbook. A Guide to Fluorescent Probes and Labeling Technologies. Molecular Probes, Inc.; Eugene, OR: 2005. [Google Scholar]
- [14].Goldys E. Fluorescence Applications in Biotechnology and Life Sciences. Wiley-Blackwell; New Jersey: 2005. [DOI] [PubMed] [Google Scholar]
- [15].Signore G, Nifosì R, Albertazzi L, Storti B, Bizzarri R. J. Am. Chem. Soc. 2010;132:1276–1288. doi: 10.1021/ja9050444. [DOI] [PubMed] [Google Scholar]
- [16].Ellis A, Feher M, Wright T. Electronic and Photoelectron Spectroscopy. Cambridge University Press; Cambridge: 2005. [Google Scholar]
- [17].Laane J, editor. Frontiers of Molecular Spectroscopy. Elsevier; Amsterdam: 2009. [Google Scholar]
- [18].Barone V, editor. Computational Strategies for Spectroscopy: From Small Molecules to Nano Systems. Wiley; Chichester, U.K.: 2011. [Google Scholar]
- [19].Adamo C, Jacquemin D. Chem. Soc. Rev. 2013;42:845–856. doi: 10.1039/c2cs35394f. [DOI] [PubMed] [Google Scholar]
- [20].Yanaia T, Tewb DP, H. N. Chem. Phys. Lett. 2004;393:51–57. [Google Scholar]
- [21].Leang SS, Zahariev F, Gordon MS. J. Chem. Phys. 2012;136:104101–104112. doi: 10.1063/1.3689445. [DOI] [PubMed] [Google Scholar]
- [22].Bousquet D, Fukuda R, Maitarad P, Jacquemin D, Ciofini I, Adamo C, Ehara M. J. Chem. Theory Comput. 2013;9:2368–2379. doi: 10.1021/ct400097b. [DOI] [PubMed] [Google Scholar]
- [23].Avila Ferrer FJ, Santoro F. Phys. Chem. Chem. Phys. 2012;14:13549–13563. doi: 10.1039/c2cp41169e. [DOI] [PubMed] [Google Scholar]
- [24].Barone V, Bloino J, Biczysko M, Santoro F. J. Chem. Theory Comput. 2009;5:540–554. doi: 10.1021/ct8004744. [DOI] [PubMed] [Google Scholar]
- [25].Bloino J, Biczysko M, Santoro F, Barone V. J. Chem. Theory Comput. 2010;6:1256–1274. doi: 10.1021/ct8004744. [DOI] [PubMed] [Google Scholar]
- [26].Klaumünzer B, Kröner D, Saalfrank P. J. Phys. Chem. B. 2011;114:10826–10834. doi: 10.1021/jp100642c. [DOI] [PubMed] [Google Scholar]
- [27].Prampolini G, Bellina F, Biczysko M, Cappelli C, Carta L, Lessi M, Pucci A, Ruggeri G, Barone V. Chemistry (Weinheim an der Bergstrasse, Germany) 2013;19:1996–2004. doi: 10.1002/chem.201203672. [DOI] [PubMed] [Google Scholar]
- [28].Pereira Gomes A, Jacob C. Annu. Rep. Prog. Chem. 2012;108:222–277. [Google Scholar]
- [29].Ali M, Dutta P, Pandey S. J. Phys. Chem. B. 2010;114:15042–15051. doi: 10.1021/jp106601a. [DOI] [PubMed] [Google Scholar]
- [30].Malcioglu OB, Calzolari A, Gebauer R, Varsano D, Baroni S. J. Am. Chem. Soc. 2011;133:15425–15433. doi: 10.1021/ja201733v. [DOI] [PubMed] [Google Scholar]
- [31].Tomasi J, Mennucci B, Cammi R. Chem. Rev. 2005;105:2999–3093. doi: 10.1021/cr9904009. [DOI] [PubMed] [Google Scholar]
- [32].Brancato G, Rega N. In: Computational Strategies for Spectroscopy: From Small Molecules to Nano Systems. Barone V, editor. Wiley; Chichester, U.K.: 2011. pp. 517–547. [Google Scholar]
- [33].Caruso P, Causà M, Cimino P, Crescenzi O, DAmore M, Improta R, Pavone M, Rega N. Theor. Chem. Acc. 2012;131:1211–1219. [Google Scholar]
- [34].Barone V, Bloino J, Monti S, Pedone A, Prampolini G. Phys. Chem. Chem. Phys. 2010;12:10550–10561. doi: 10.1039/c002722g. [DOI] [PubMed] [Google Scholar]
- [35].Barone V, Bloino J, Monti S, Pedone A, Prampolini G. Phys. Chem. Chem. Phys. 2011;13:2160–2166. doi: 10.1039/c0cp01320j. [DOI] [PubMed] [Google Scholar]
- [36].Cascella M, Cuendet M, Tavernelli I, Rothlisberger U. J. Phys. Chem. B. 2007;111:10248–10252. doi: 10.1021/jp071938i. [DOI] [PubMed] [Google Scholar]
- [37].Demachy I, Ridard J, Laguitton-Pasquier H, Durnerin E, V G, Archirel P, Lévi B. J. Phys. Chem. B. 2005;109:24121–24133. doi: 10.1021/jp054656w. [DOI] [PubMed] [Google Scholar]
- [38].Pedone A, Prampolini G, Monti S, Barone V. Phys. Chem. Chem. Phys. 2011;13:16689–16697. doi: 10.1039/c1cp21475f. [DOI] [PubMed] [Google Scholar]
- [39].Pedone A, Prampolini G, Monti S, Barone V. Chem. Mater. 2011;23:5016–5023. [Google Scholar]
- [40].Biczysko M, Bloino J, Brancato G, Cacelli I, Cappelli C, Ferretti A, Lami A, Monti S, Pedone A, Prampolini G, Puzzarini C, Santoro F, Trani F, Villani G. Theor. Chem. Acc. 2012;131:1201–1220. [Google Scholar]
- [41].Gonçalves MB, Dreyer J, Lupieri P, Barrera-Patiño C, Ippoliti E, Webb MR, Corrie JET, Carloni P. Phys. Chem. Chem. Phys. 2013;15:2177–2183. doi: 10.1039/c2cp42396k. [DOI] [PubMed] [Google Scholar]
- [42].Czar MF, Jockusch RA. ChemPhysChem. 2013;14:1138–1148. doi: 10.1002/cphc.201201008. [DOI] [PubMed] [Google Scholar]
- [43].Lipparini F, Cappelli C, Scalmani G, De Mitri N, Barone V. J. Chem. Theory Comput. 2012;8:4270–4278. doi: 10.1021/ct300635c. [DOI] [PubMed] [Google Scholar]
- [44].Lipparini F, Cappelli C, Barone V. J. Chem. Theory Comput. 2012;8:4153–4165. doi: 10.1021/ct3005062. [DOI] [PubMed] [Google Scholar]
- [45].Steindal AH, Ruud K, Frediani L, Aidas K, Kongsted J. J. Phys. Chem. B. 2011;115:3027–3037. doi: 10.1021/jp1101913. [DOI] [PubMed] [Google Scholar]
- [46].De Angelis F, Santoro F, Nazeruddin MK, Barone V. J. Phys. Chem B. 2008;112:13181–13183. doi: 10.1021/jp806519d. [DOI] [PubMed] [Google Scholar]
- [47].Tiberio G, Muccioli L, Berarardi R, Zannoni C. ChemPhysChem. 2010;11:1018–1028. doi: 10.1002/cphc.200900652. [DOI] [PubMed] [Google Scholar]
- [48].Rhee YMIN. Int. J. Quant. Chem. 2011;111:4091–4105. [Google Scholar]
- [49].Pipolo S, Benassi E, Brancolini G, Valásek M, Mayor M, Corni S. Theor. Chem. Acc. 2012;131:1274–1288. [Google Scholar]
- [50].Barone V, Cacelli I, De Mitri N, Licari D, Monti S, Prampolini G. Phys. Chem. Chem. Phys. 2013;15:3736–3751. doi: 10.1039/c3cp44179b. [DOI] [PubMed] [Google Scholar]
- [51].Cacelli I, Prampolini G. J. Chem. Theory Comput. 2007;3:1803–1817. doi: 10.1021/ct700113h. [DOI] [PubMed] [Google Scholar]
- [52].Cicogna F, Coiai S, Passaglia E, Tucci I, Ricci L, Ciardelli F, Batistini A. J. Polym. Science. A. 2011;49:781–795. [Google Scholar]
- [53].Cicogna F, Coiai S, Pinzino C, Ciardelli F, Passaglia E. React. Func. Polym. 2012;72:695–702. [Google Scholar]
- [54].Monti S, Cicogna F, Passaglia E, Prampolini G, Barone V. Phys. Chem. Chem. Phys. 2011;13:21471–21478. doi: 10.1039/c1cp22878a. [DOI] [PubMed] [Google Scholar]
- [55].Adamo C, Barone V. J. Chem. Phys. 1999;110:6158–6170. [Google Scholar]
- [56].Barone V, Cimino P, Stendardo E. J. Chem. Theory Comput. 2008;4:751–764. doi: 10.1021/ct800034c. [DOI] [PubMed] [Google Scholar]
- [57].Barone V, Cimino P. Chem. Phys. Lett. 2008;454:139–143. [Google Scholar]
- [58].Frisch MJ, Trucks GW, Schlegel HB, Scuseria GE, Robb MA, Cheeseman JR, Scalmani G, Barone V, Mennucci B, Petersson G, Nakatsuji H, Caricato M, Li X, Hratchian HP, Izmaylov AF, Bloino J, Zheng G, Sonnenberg JL, Hada M, Ehara M, Toyota K, Fukuda R, Hasegawa J, Ishida M, Nakajima T, Honda Y, Kitao O, Nakai H, Vreven T, Montgomery JA, Peralta JE, Ogliaro F, Bearpark M, Heyd JJ, Brothers E, Kudin KN, Staroverov VN, Kobayashi R, Normand J, Raghavachari K, Rendell A, Burant J, Iyengar SS, Tomasi J, Cossi M, Rega N, Millam JM, Klene M, Knox JE, Cross JB, Bakken V, Adamo C, Jaramillo J, Gomperts R, Stratmann RE, Yazyev O, Austin AJ, Cammi R, Pomelli C, Ochterski JW, Martin RL, Morokuma K, Zakrzewski VG, Voth GA, Salvador P, Dannenberg JJ, Dapprich S, Parandekar PV, Mayhall NJ, Daniels AD, Farkas O, Foresman JB, Ortiz JV, Cioslowski J, Fo DJ. Gaussian09, Revision c.01. Gaussian, Inc.; Wallingford CT: 2009. [Google Scholar]
- [59].Jorgensen W, Maxwell D, Tirado-Rives J. J. Am. Chem. Soc. 1996;118:11225–11236. [Google Scholar]
- [60].Damm W, Frontera A, Tirado-Rives J, Jorgensen W. J. Comp. Chem. 1997;18:1955–1970. [Google Scholar]
- [61].Marenich A, Jerome S, Cramer C, Truhlar D. J. Chem. Theory Comput. 2012;8:575–584. doi: 10.1021/ct200866d. [DOI] [PubMed] [Google Scholar]
- [62].van der Spoel D, Lindahl E, Hess B, van Buuren AR, Apol E, Meulenho P, Tieleman D, Sijbers A, Feenstra K, van Drunen R, Berendsen H. GROMACS4.5; Gromacs User Manual version 4.5.4. 2010 ww.gromacs.org.
- [63].Berendsen HJC, Postma JPM, van Gunsteren W, Di Nola A, Haak JR. J. Chem. Phys. 1984;81:3684–3690. [Google Scholar]
Associated Data
This section collects any data citations, data availability statements, or supplementary materials included in this article.


