Abstract
Purpose
To develop a reliable and efficient digital method to quantify planimetric Goldmann visual field (GVF) data to monitor disease course and treatment responses in retinal degenerative diseases.
Methods
A novel method to digitally quantify GVF using Adobe Photoshop CS3 was developed for comparison to traditional digital planimetry (Placom 45C digital planimeter; EngineerSupply, Lynchburg, Virginia, USA). GVFs from 20 eyes from 10 patients with Stargardt disease were quantified to assess the difference between the two methods (a total of 230 measurements per method). This quantification approach was also applied to 13 patients with X-linked retinitis pigmentosa (XLRP) with mutations in RPGR.
Results
Overall, measurements using Adobe Photoshop were more rapidly performed than those using conventional planimetry. Photoshop measurements also exhibited less inter- and intra-observer variability. GVF areas for the I4e isopter in patients with the same mutation in RPGR who were nearby in age had similar qualitative and quantitative areas.
Conclusions
Quantification of GVF using Adobe Photoshop is quicker, more reliable, and less-user dependent than conventional digital planimetry. It will be a useful tool for both retrospective and prospective studies of disease course as well as for monitoring treatment response in clinical trials for retinal degenerative diseases.
Keywords: retinal dystrophies, Goldmann visual fields, disease course, treatment response, genotype-phenotype correlations
17. 1 Introduction
Kinetic perimetry is broadly less utilized today in ophthalmic care. However, it remains critical in the evaluation of progression of inherited and autoimmune retinal degenerations. The visual fields of these patients are better assessed with kinetic perimetry [1] and their visual field defect or scotoma may lie beyond 30 degrees of the visual field tested by the Humphrey Visual Field analyzer. Descriptive methods for evaluating Goldmann visual fields (GVF) have been described in the past, with central and peripheral losses reflecting cone-rod and rod-cone patterns of retinal degeneration, respectively [2]. Linstone et al [3] described the use of planimetry to quantify Goldmann visual fields (GVF) over two decades ago and this technique has been successfully used to monitor treatment responses in patients with autoimmune retinopathy [4, 5].
Despite the potential for quantification, planimetric measurements are often time-consuming and can vary widely between users. In order to determine efficacy of immunosuppressive agents used for treatment of autoimmune retinopathies [4], and as new therapies for retinal dystrophies enter into clinical trials, it has become increasingly important to accurately quantify visual field areas in both clinical and research settings. We describe a novel technique that is faster, more reliable and less operator-dependent using Adobe Photoshop CS3 (Photoshop). We also apply this technique to patients with X-linked retinitis pigmentosa (XLRP) who have the same mutations in RPGR to explore the potential for quantified GVF in future studies of genotype-phenotype relationships.
17. 2 Methods
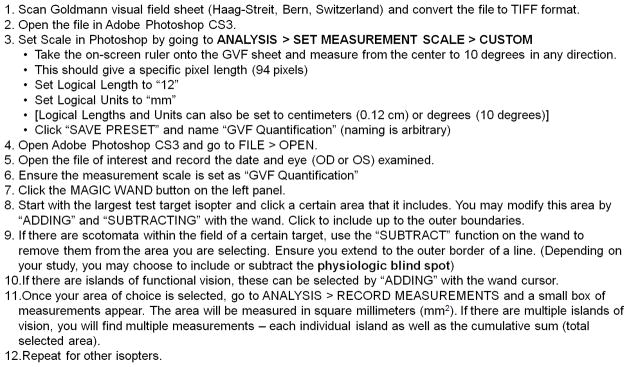
This study was approved by the University of Michigan Institutional Review Board. A novel method of quantifying GVF digitally using Photoshop was developed at the University of Michigan (Figure 17.1). Measurements made using this technique were compared to traditional digital planimetry (Placom 45C digital planimeter; EngineerSupply, Lynchburg, Virginia, USA). 38 GVF tests from 10 patients (20 eyes) with different stages of Stargardt disease were quantified in planimetric square centimeters (cm2) to evaluate the difference between the two methods (230 measurements/method). The average difference between measurements using each method was assessed.
Figure 1. Goldmann Visual Field Digital Quantification Methodology.

Goldmann visual field quantification methodology using Adobe Photoshop CS3 is delineated in a stepwise fashion.
Inter- and intra-observer variations of the two methods were also evaluated. Two observers each measured one full visual field comprising the I4e, III4e, and IV4e isopters. Each set of measurements for each isopter was performed three times using both methodologies. The three measurements of each parameter were averaged to obtain one value/parameter/observer/methodology. The average difference between the measurements of each observer using a particular measurement method was defined as the inter-observer variability. Given that each measureable parameter was measured three times by each observer, intra-observer variability for each measure was assessed by calculating the standard deviation (SD) within the 3 measurements. The average standard deviations for each measurement using each methodology were compared to assess overall intra-observer variability.
GVF from thirteen patients with proven mutations in RPGR were evaluated in an application of this quantification technique. Descriptive phenotypes were assigned to each patient’s pattern of GVF loss. Predominantly peripheral losses represented a rod-cone phenotype, and predominantly central vision loss represented a cone-rod phenotype, as described by Heckenlively [2]. The GVF areas for the I4e isopter were quantified as described above and expressed as percentages of the normal mean for the total I4e area as derived from 10 normal eyes (176.78 cm2). Qualitative GVF phenotypes and quantified areas from patients with the same mutation who were near in age were compared in square centimeters.
17.3 Results
17.3.1 Verification of Quantification Technique
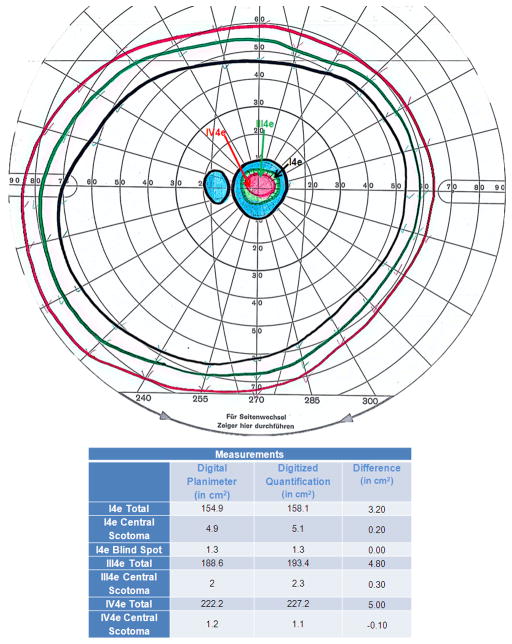
Measurements using Photoshop were on average 2.33% (SD=0.65%) greater that measurements by digital perimetry for visual field areas measured by the I4e, III4e, and IV4e isopters (N=20 eyes; 10 patients). An example comparing measurements of these isopters from a 35 year old female patient with Stargardt disease is shown in Figure 17.2.
Figure 2. Comparison of Traditional versus Novel Digital GVF Quantification.
Quantification of the total extent of peripheral fields, physiologic blind spot, and central scotoma were performed by a single observer in square centimeters (cm2) for the I4e, III4e, and IV4e isopters using digital planimetry and Adobe Photoshop for a 35-year-old female patient with Stargardt disease. The absolute differences between the two methodologies are shown in the table.
Inter-observer variability taken from an average of three measurements per user per isopter was 0.216 cm2 for digital planimetry versus 0.067 cm2 for Photoshop. Intra-observer variability, as reflected by the average standard deviation of 18 sets of 3 measurements each from two users measuring all available isopters from one visual field, was 0.227 cm2 for digital planimetry versus 0.0 cm2 for measurements using Photoshop. Of note, for a GVF with full peripheral fields, on average greater than 10 minutes was required for digital planimetry measurements, while less than 5 minutes were required using Photoshop.
17.3.2 Application of Quantification Technique
Qualitative and quantitative GVF phenotypes in thirteen patients with XLRP representing 6 distinct proven mutations in RPGR were compared. Patients were compared only to other patients who had the same mutation and were nearby (less than 6 years) in age. The patients with a rod-cone GVF phenotype tended to have qualitatively and quantitatively smaller areas when compared to other patients with the same mutation. In contrast, patients with a cone-rod phenotype tended to have larger GVF areas. The difference in areas for all comparisons of patients with the same mutations was minimal.
17.4 Discussion
We have shown that Photoshop can be a useful measurement tool for GVF. This technique is less time-consuming, more reliable, and less user-dependent than previous techniques such as digital planimetry. It can enable the precise longitudinal assessment of GVF to evaluate the progression and therapeutic responses of retinal degenerative diseases. This may be especially useful for clinical trials involving novel therapies (e.g., gene therapy), where accurately quantified scotomata may be monitored longitudinally as an outcome measure.
There are some limitations to our technique. First, it is most useful for retrospective studies that utilize standardized methodology. Even when standardized technique is utilized, there may be significant test-retest variability [6]. Second, although newer perimeters (e.g., Octopus® 900) can provide automated GVF quantification, there exists a wealth of quantifiable retrospective GVF data that can be utilized to study disease course and genotype to phenotype correlations in various diseases.
Another limitation of our technique is that it provides planimetric, rather than retinal, areas, which does not account for perimetric distortions [7, 8]. However, these distortions are minimal at smaller eccentricities [9]. Therefore, for defects such as central scotomata, an accurate technique such as the one described herein is useful in both clinical and research settings.
The application of our quantitative technique in patients with XLRP caused by mutations in RPGR illustrates the potential for using our technique to analyze retrospective GVF data to explore genotype to phenotype relationships. Most importantly, it shows the greatest utility when patients with the same mutation who are near in age are compared, as it reveals whether visual field loss is comparable both qualitatively and quantitatively at similar points of the disease course for each mutation. Given that most retinal dystrophies often take years to decades to progress, the data currently available is mostly retrospective (often with incomplete follow-up). Therefore, accurate quantification of visual parameters such as GVF is important to assess the disease course in each unique mutation.
Acknowledgments
We would like to specially thank Dr. Michael D. Abramoff, MD, PhD for his advice on Goldmann visual field quantification.
This research was supported by the Foundation Fighting Blindness and the National Eye Institute (Core Center for Vision Research - EY007003).
References
- 1.Barton JJS, Benatar M. Field of Vision: A Manual and Atlas of Perimetry. Springer-Verlag New York, LLC; Apr, 2003. [Google Scholar]
- 2.Heckenlively JR. Retinitis pigmentosa. Philadelphia: Lippincott; 1988. [Google Scholar]
- 3.Linstone FA, Heckenlively JR, Solish AM. The use of planimetry in the quantitative analysis of visual fields. Glaucoma. 1982;4(17) [Google Scholar]
- 4.Ferreyra HA, Jayasundera T, Khan NW, He S, Lu Y, Heckenlively JR. Management of autoimmune retinopathies with immunosuppression. Archives of ophthalmology. 2009;127(4):390–7. doi: 10.1001/archophthalmol.2009.24. [DOI] [PubMed] [Google Scholar]
- 5.Heckenlively JR, Ferreyra HA. Autoimmune retinopathy: a review and summary. Semin Immunopathol. 2008;30(2):127–34. doi: 10.1007/s00281-008-0114-7. [DOI] [PubMed] [Google Scholar]
- 6.Bittner AK, Iftikhar MH, Dagnelie G. Test-retest, within-visit variability of Goldmann visual fields in retinitis pigmentosa. Invest Ophthalmol Vis Sci. 2011;52(11):8042–6. doi: 10.1167/iovs.11-8321. [DOI] [PMC free article] [PubMed] [Google Scholar]
- 7.Drasdo N, Fowler CW. Non-linear projection of the retinal image in a wide-angle schematic eye. Br J Ophthalmol. 1974;58(8):709–14. doi: 10.1136/bjo.58.8.709. [DOI] [PMC free article] [PubMed] [Google Scholar]
- 8.Kirkham TH, Meyer E. Visual field area on the Goldmann hemispheric perimeter surface. Correction of cartographic errors inherent in perimetry. Curr Eye Res. 1981;1(2):93–9. doi: 10.3109/02713688109001732. [DOI] [PubMed] [Google Scholar]
- 9.Dagnelie G. Conversion of planimetric visual field data into solid angles and retinal areas. Clin Vision Sciences. 1990;5:95–100. [Google Scholar]


