Abstract
Dynamic and longitudinal lung CT imaging produce 4D lung image data sets, enabling applications like radiation treatment planning or assessment of response to treatment of lung diseases. In this paper, we present a 4D lung segmentation method that mutually utilizes all individual CT volumes to derive segmentations for each CT data set. Our approach is based on a 3D robust active shape model and extends it to fully utilize 4D lung image data sets. This yields an initial segmentation for the 4D volume, which is then refined by using a 4D optimal surface finding algorithm. The approach was evaluated on a diverse set of 152 CT scans of normal and diseased lungs, consisting of total lung capacity and functional residual capacity scan pairs. In addition, a comparison to a 3D segmentation method and a registration based 4D lung segmentation approach was performed. The proposed 4D method obtained an average Dice coefficient of 0.9773 ± 0.0254, which was statistically significantly better (p value ≪0.001) than the 3D method (0.9659 ± 0.0517). Compared to the registration based 4D method, our method obtained better or similar performance, but was 58.6% faster. Also, the method can be easily expanded to process 4D CT data sets consisting of several volumes.
1. Introduction
Applications like lung cancer radiotherapy planning [1], assessment of lung diseases like COPD [2], or dynamic lung ventilation studies [3] require the acquisition and subsequent analysis of 4D lung CT scans (e.g., two lung scans at different respiratory states). Most quantitative analysis approaches utilize image registration methods [4, 5] for 4D analysis. In order to achieve accurate results and reduce computation time, registration is typically only performed within a lung mask. Thus, for such approaches, the segmentation of each lung CT volume acquired is a prerequisite. This can be accomplished by utilizing standard 3D lung segmentation methods like the ones proposed in [6–10], which assume a large density difference between air-filled lung parenchyma and surrounding objects/tissues. However, since 4D imaging is mainly performed for the assessment and/or treatment of lung diseases, such simple methods frequently fail to perform well. Recently, 3D segmentation methods have been developed to deal with this issue, including approaches that utilize an atlas-based segmentation-by-registration scheme [11], an error-correcting hybrid system [12], a shape “break-and-repair” strategy [13], and a 3D robust active shape model (RASM) [14, 15]. However, none of these approaches takes advantage of 4D lung CT scans and thus requires lungs to be segmented individually. This can be problematic, especially when segmenting pairs of total lung capacity (TLC) and functional residual capacity (FRC) lung scans, because (diseased) lungs at FRC are typically more difficult to segment than lungs imaged at TLC. Consequently, algorithms that simultaneously segment lungs in all available CT volumes are more promising.
Work on 4D lung segmentation techniques is scant. Wilms et al. [16] adopted a 4D statistical shape model that was originally developed by Perperidis et al. [17] for segmentation of gated cardiac image sequences. A limitation of this approach is that it is based on standard least squares active shape model (ASM) matching, which is known to be affected by outliers [14, 18]. Consequently, disease induced changes of lung tissue (e.g., density) or artifacts resulting from sorting algorithm errors in case of free-breathing CT lung imaging can adversely impact model matching.
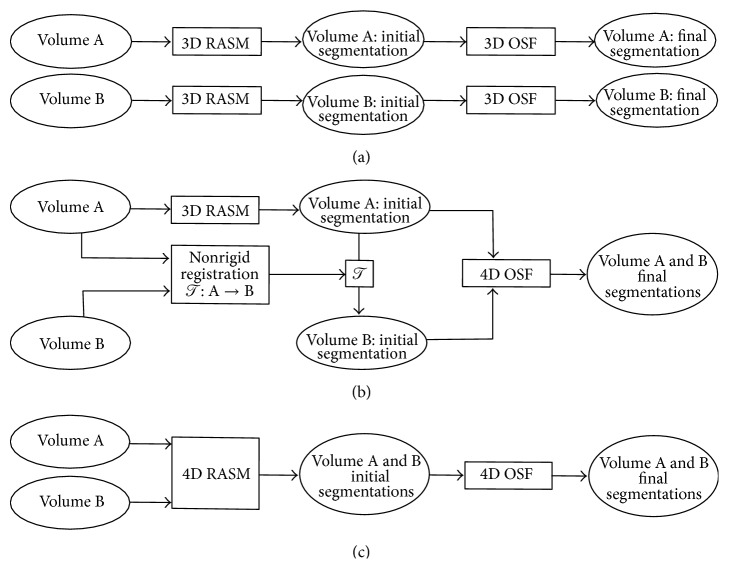
In our previous work, Sun et al. [19] introduced a 4D lung segmentation method based on 4D optimal surface finding (OSF). The approach requires a rough initial lung segmentation, which was obtained by applying a 3D RASM [14] to a TLC lung scan and transferring this segmentation by means of a nonrigid image registration to the corresponding FRC scan (Figure 1(b)). This approach has some potential shortcomings. First, the initial, rough segmentation step does not take full advantage of the available 4D CT data. Consequently, if the initial lung segmentation is inaccurate, the error is propagated to the other volume by the algorithm. Second, for many applications (e.g., segmentation of longitudinal TLC volumes), it is not obvious which volume should be utilized for 3D RASM segmentation to achieve good segmentation performance. Third, the registration step is quite time-consuming.
Figure 1.
RASM-based approaches for segmenting lungs in a 4D CT volume (represented by 3D volumes A and B). (a) 3D segmentation method [14]. (b) Registration based 4D segmentation method [19]. (c) Proposed 4D segmentation approach with new 4D RASM (Section 3.1).
In this paper, we address these limitations by proposing a new 4D RASM model matching step that replaces the combination of single 3D RASM segmentation and subsequent registration to other volumes as proposed by Sun et al. [19]. In addition, we provide an extensive study, comparing the 3D base method published by Sun et al. [14] applied to each CT scan independently (Figure 1(a)), the registration based 4D version [19] (Figure 1(b)), and the proposed approach (Figure 1(c)) on a diverse set of 4D CT data, consisting of TLC and FRC scan pairs of normal and diseased lungs.
2. Prior Work
The proposed method extends our 3D RASM method [14] to mutual segmentation of lungs in 4D CT data. Thus, we briefly outline the RASM fitting process for a single 3D volume.
The RASM consists of a point distribution model (PDM) that captures the variation in lung shapes and a robust matching approach that iteratively fits the model to a lung CT scan to perform a segmentation. The PDM is constructed separately for left and right lungs from N lung volume training data sets that have m corresponding points (landmarks) [14]. An instance of a left or right lung shape is generated from the corresponding PDM by the linear model
| (1) |
where is the mean lung shape vector, 𝒫 denotes the shape eigenvector matrix, and b represents the shape coefficients.
The matching process begins with automatically placing the mean lung shape in the target CT volume based on a ribs detection step [14]. The model shape points are then updated to y based on a gradient based cost function. For this purpose, a robust matching step is utilized to prevent that outliers are used during the model matching process. It is based on a robust PCA coefficient estimation method, which utilizes subsets of landmark points ω i,j and a voting scheme [14]. During matching, for each of these subsets a reconstruction error e ωi,j is calculated, which is then being used to determine the inliers update points of y (note the notation for specifying inliers using ; e.g., corresponds to the set y {pi=1} in [14] and is used here instead for the sake of clarity). Subsequently, is utilized to update the shape coefficients by calculating
| (2) |
where 𝒯 is the pose transformation matrix for mapping points from target image coordinate frame to model coordinate frame and denotes the points corresponding to inliers in the mean lung shape . refers to the columns corresponding to inliers in the shape eigenvector matrix 𝒫. A new instance of the model is calculated using (1), which is transformed to the image space by 𝒯 −1. The model shape points are then iteratively updated until convergence.
Once the robust matching process is finished, the resulting RASM segmentation is used as an initial shape for a graph-based optimal surface finding (OSF) algorithm to further refine the segmentation [14] (Figure 1(a)).
3. Methods
Our method for generating a 4D lung segmentation (Figure 1(c)) is based on fitting a 3D RASM mutually to 4D volume data (Section 3.1), followed by a 4D OSF segmentation step (Section 3.2). The results of all the different processing stages are depicted in Figure 2. Below, we describe the segmentation process in detail for a TLC and FRC lung scan pair, but the approach would also work for other respiratory states or longitudinal scans and can be expanded to more than two lung volumes.
Figure 2.
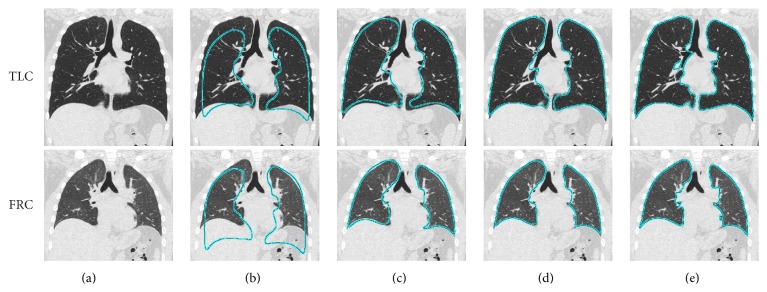
Illustration of intermediate and final results of the proposed 4D lung segmentation approach. (a) 4D CT data consisting of a TLC and FRC lung scan pair to be segmented. (b) Model initialization. (c-d) 4D RASM segmentation with (c) mutual segmentations and (d) result after the constrained adaptation step. (e) 4D OSF segmentation result.
In addition to the main processing steps described in Sections 3.1 and 3.2, the following two preprocessing steps are performed. First, a modified system of the airway tree segmentation method [20] is utilized to extract the trachea and main bronchi, which are then dilated using a radius of 2 voxels. These locations are assigned a value of 50 HU in order to make them unattractive for RASM and OSF segmentation. Second, an overlap between left and right lung segmentations is avoided by detecting the thin tissue layer between the lungs, as described by Gill et al. [21].
3.1. 4D RASM Segmentation
For model-based segmentation, a lung PDM is constructed from 75 TLC and 75 FRC normal lung CT scan pairs, which are not part of the image data utilized for method evaluation (Section 4.1). Note that model building is done separately for right and left lungs. Utilizing the right or left PDM, 4D RASM segmentation consists of the following main processing steps (Figure 3).
Figure 3.

Flowchart showing the steps involved in fitting the model to 4D CT data. The independent and mutual steps are identified in the iterative model fitting process.
(a) Model Initialization. The mean lung model is placed independently in the target TLC and FRC volumes (Figure 2(b)). For this purpose, a ribs detection method [14] is applied on the respective volumes.
(b) Iterative Model Fitting. The matching steps (i) to (v) given below are repeated for 90 iterations, which are sufficient to achieve model convergence (Figure 2(c)). Alternatively, a convergence criterion could be used.
-
(i)
Updating Shape Points. Utilizing a gray-value gradient based cost function [14] of TLC and FRC volumes, the model shape points are independently updated in the TLC and FRC volumes, resulting in y tlc and y frc, respectively.
-
(ii)Robustly Estimating Mutual Inlier Update Points. Update point sets y tlc and y frc are used to calculate e ωi,j tlc and e ωi,j frc, respectively, which is similar to that described in [14]. However, after this step, a mutual reconstruction error is calculated with
to enable mutual inlier estimation. Thus, e ωi,j mutual is used in the voting scheme described in [14] instead of individual reconstruction errors e ωi,j tlc or e ωi,j frc. The outcomes of the voting process are inlier update point sets and . Note that, while and are different, they have the same cardinality and correspond to the same landmark points of the lung PDM.(3) -
(iii)Computing Mutual Shape Coefficients. The inlier point sets and are independently transformed to the model coordinate frame by using pose transformation matrices 𝒯 tlc and 𝒯 frc, respectively. Each transformation is derived from a Procrustes analysis between inlier sets ( and ) and corresponding mean model () in model coordinate space. The shape coefficients b mutual are computed using the average of the transformed inliers
(4) -
(iv)
Generating a New Model Instance. A new instance of the model, which is used to represent the lung in TLC and FRC scans, is calculated using (1) and b mutual.
-
(v)
Transforming the Model. The model is transformed back to TLC and FRC volumes using 𝒯 tlc −1 and 𝒯 frc −1, respectively.
(c) Constrained Model Adaptation. After the 4D fitting process converges, a single lung shape with individual transformation matrices 𝒯 tlc and 𝒯 frc results, which matches the lungs in TLC and FRC scans. However, the transformations only account for isotropic scaling. Thus, the fitted models will not be perfectly aligned with the image data, because the difference in TLC and FRC lung shapes cannot be explained by an isotropic scale factor. To obtain a better alignment, we subsequently allow the shape coefficients to individually adapt to the target images by continuing the RASM fitting process independently in both volumes for ten iterations (Figure 2(d)). Note that this adaptation is done in a constrained manner, only allowing a subset of model coefficients to change within certain limits to avoid major divergence of TLC and FRC models. The subset of model coefficients (sorted in decreasing order of their eigenvalues) is defined by the coefficients whose eigenvalues account for 80% of shape variation. In our case, this resulted in a set of 22 coefficients out of 150, which were allowed to change by a maximum of 0.5 times the standard deviation σ in the respective eigenvalues. Thus, the final shape coefficients b adapted after the individual adaptation step for the TLC or FRC volume are limited to
| (5) |
The parameters constraining the model were selected conservatively, and we found that small parameter variations have little impact on the overall lung segmentation.
3.2. 4D OSF Segmentation
After the initial model-based segmentations are created for TLC and FRC volumes, they are refined using the 4D OSF method [19], resulting in the final 4D lung segmentation (Figure 2(e)). For this purpose, the same parameter settings as proposed by Sun et al. [19] were utilized.
4. Evaluation
4.1. Image Data
For evaluation, 152 multidetector computed tomography (MDCT) thorax scans of lungs from 4 different sets S normal, S asthma, S COPD, and S mix with no significant abnormalities (normal), asthma (both severe and nonsevere), chronic obstructive pulmonary disease (COPD, GOLD 1 to 4), and a mixture of different lung diseases, respectively, were utilized. The total number of scans in sets S normal, S asthma, S COPD, and S mix were 40, 36, 36, and 40, respectively. All the four sets contained pairs of TLC (volume A) and FRC (volume B) images. The image sizes varied from 512 × 512 × 351 to 512 × 512 × 781 voxels with a mean size of 512 × 512 × 580 voxels. The slice thickness of images ranged from 0.5 to 0.63 mm (mean: 0.52 mm) and the in-plane resolution from 0.49 × 0.49 to 0.91 × 0.91 mm (mean: 0.64 × 0.64 mm).
4.2. Experimental Setup
For all test data sets, an independent reference standard was generated. Manual segmentation of a whole lung is time-consuming, and due to the large number of 152 test CT scans, we utilize a sampling approach, which is similar to that utilized in [6, 11, 12], to reduce the substantial effort required for manual inspection and segmentation. Thus, for every tenth axial slice, a trained expert generated a reference segmentation under the supervision of a pulmonologist, resulting in a dense sampling of the lung volume with between 41 and 64 labeled slices for each data set (Figure 4). The same sampling approach was applied to the segmentation result to be evaluated. Based on the sampled volumes, the Dice coefficient D [22] was calculated. In addition, the mean unsigned distance error d [22] was computed with respect to the reference in all axial slices where a reference standard and segmentation result were both available. Subsequently, the average of all these locations was calculated per data set and reported.
Figure 4.
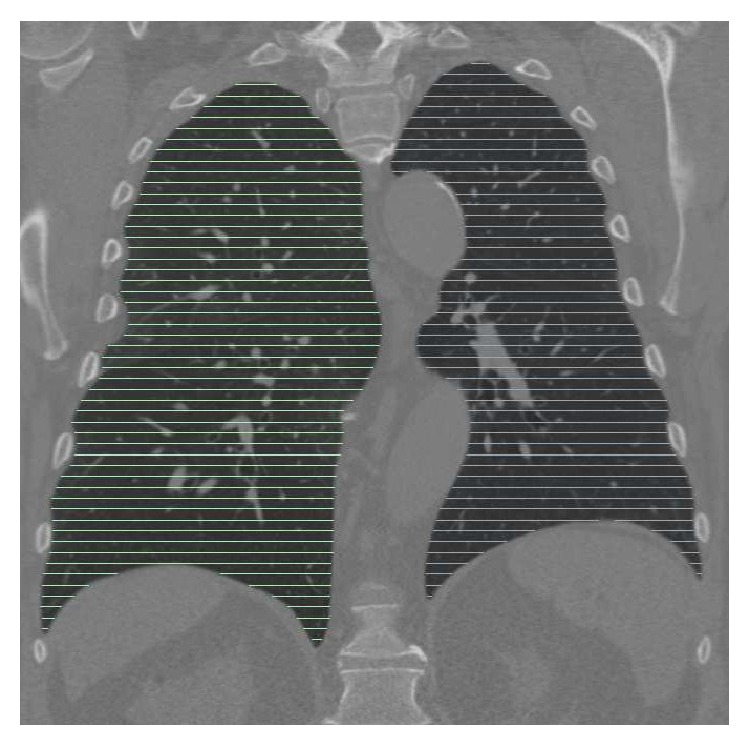
Example showing the location and density of axial reference segmentations in relation to lung anatomy.
In the following sections, the proposed method (Figure 1(c)) will be denoted by M 4D. In addition, two other methods will be utilized for comparison. M 3D will be utilized to denote the 3D approach proposed by Sun et al. [14] (Figure 1(a)). The 4D method of Sun et al. [19] (Figure 1(b)) was used in two variants; the variant where volume A (TLC) is registered to volume B (FRC) will be denoted by M 4DregAB, and the variant where volume B (FRC) is registered to volume A (TLC) will be denoted by M 4DregBA. Investigating these two variants allows us to assess and compare performance in situations with different but unknown respiratory state (e.g., longitudinal lung image data). For all methods utilized, the standard parameter setting as described in respective papers was used. Unless otherwise mentioned, all reported results refer to the final (OSF) segmentation.
A paired permutation test [23] was utilized for determining statistical significance, because it does not make assumptions about the distribution of the underlying data and a paired t-test or paired signed rank test was not applicable to our data.
5. Results
5.1. Segmentation Performance
Our novel 4D RASM matching approach (without final OSF segmentation step) showed an average Dice coefficient of 0.9468 ± 0.0318. In contrast, the standard 3D RASM approach resulted in an average Dice coefficient of 0.9391 ± 0.0525. The 4D RASM showed a statistically significant improvement (p value ≪0.001) compared against 3D RASM.
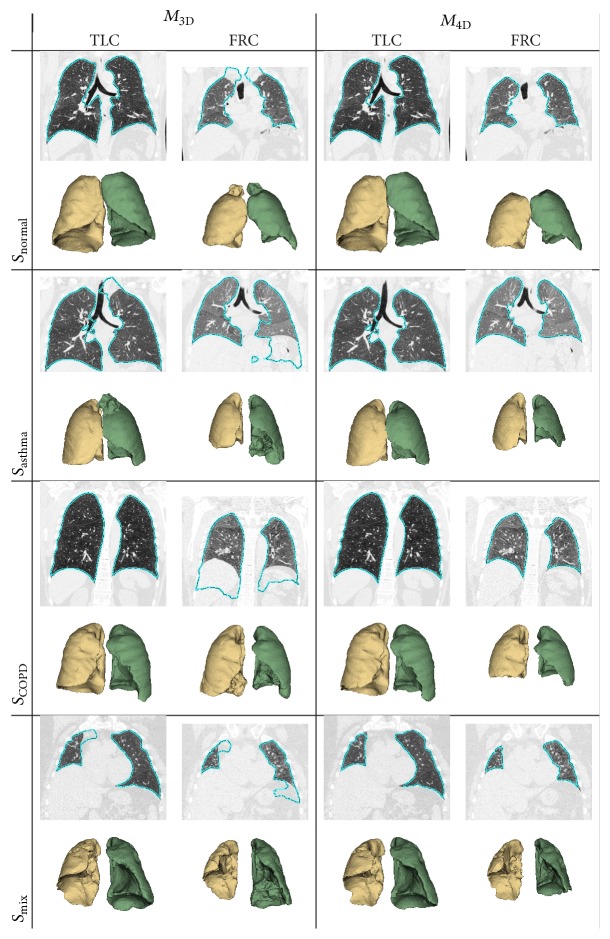
Tables 1 and 2 summarize the resulting final (OSF) segmentation performance with corresponding p values, comparing results of M 3D and M 4D. In both tables, M 4D shows statistically significant improvement in each data set and for TLC and FRC scans. Figure 5 depicts some examples of segmentations (one from each test data set) obtained by methods M 3D and M 4D.
Table 1.
Dice coefficient D for methods M 3D and M 4D. Statistically significant p values are marked with ∗.
| Set | M 3D | M 4D | p value |
|---|---|---|---|
| S normal | 0.9822 ± 0.0129 | 0.9850 ± 0.0058 | ≪0.001∗ |
| S asthma | 0.9667 ± 0.0437 | 0.9789 ± 0.0108 | ≪0.001∗ |
| S COPD | 0.9685 ± 0.0514 | 0.9839 ± 0.0068 | ≪0.001∗ |
| S mix | 0.9467 ± 0.0732 | 0.9623 ± 0.0444 | 0.012∗ |
|
| |||
| TLC | 0.9808 ± 0.0142 | 0.9846 ± 0.0103 | ≪0.001∗ |
| FRC | 0.9510 ± 0.0687 | 0.9700 ± 0.0329 | ≪0.001∗ |
|
| |||
| ALL | 0.9659 ± 0.0517 | 0.9773 ± 0.0254 | ≪0.001∗ |
Table 2.
Mean unsigned distance error d in millimeters for methods M 3D and M 4D. Statistically significant p values are marked with ∗.
| Set | M 3D | M 4D | p value |
|---|---|---|---|
| S normal | 1.20 ± 0.77 | 0.89 ± 0.44 | ≪0.001∗ |
| S asthma | 1.68 ± 1.25 | 1.14 ± 0.50 | ≪0.001∗ |
| S COPD | 1.66 ± 1.90 | 1.00 ± 0.56 | ≪0.001∗ |
| S mix | 2.77 ± 4.42 | 1.81 ± 1.45 | ≪0.001∗ |
|
| |||
| TLC | 1.16 ± 0.68 | 0.88 ± 0.53 | ≪0.001∗ |
| FRC | 2.52 ± 3.50 | 1.56 ± 1.11 | ≪0.001∗ |
|
| |||
| ALL | 1.84 ± 2.61 | 1.22 ± 0.93 | ≪0.001∗ |
Figure 5.
Comparison of segmentation results generated with methods M 3D and M 4D. Coronal CT cross sections with marked lung boundaries in combination with corresponding 3D lung mesh models are shown to enable locating and assessing segmentation errors as well as differences between results.
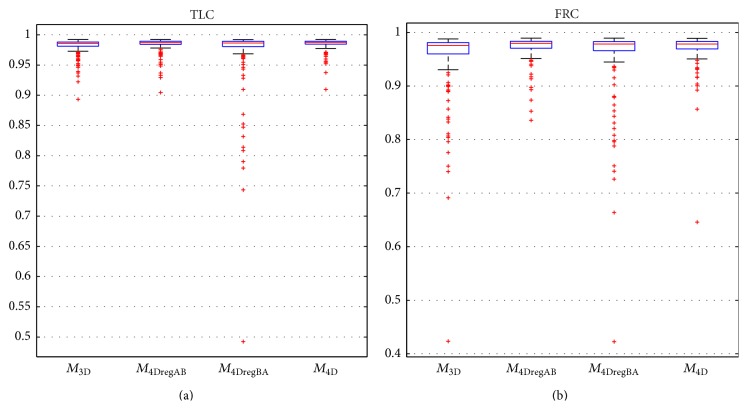
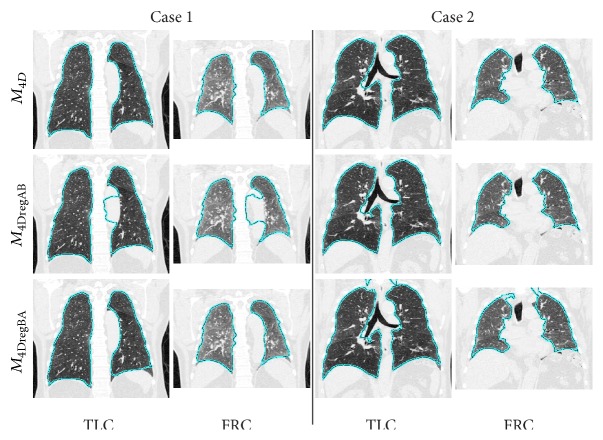
Tables 3 and 4 compare the final lung segmentation Dice coefficient of M 4D to M 4DregAB and M 4DregBA, respectively. Overall, M 4D and M 4DregAB were found to be equivalent (no statistically significant difference), but M 4D was found to be significantly better compared to M 4DregBA. Figure 6 provides a comparison of final Dice coefficients in form of box plots for all methods and separated by respiratory state. A comparison of results generated with M 4D, M 4DregAB, and M 4DregBA is shown in Figure 7.
Table 3.
Dice coefficient D for methods M 4DregAB and M 4D. Statistically significant p values are marked with ∗.
| Set | M 4DRegAB | M 4D | p value |
|---|---|---|---|
| TLC | 0.9834 ± 0.0127 | 0.9846 ± 0.0103 | 8.92e − 03∗ |
| FRC | 0.9718 ± 0.0233 | 0.9700 ± 0.0329 | 2.07e − 01 |
|
| |||
| ALL | 0.9776 ± 0.0196 | 0.9773 ± 0.0254 | 7.97e − 01 |
Table 4.
Dice coefficient D for methods M 4DregBA and M 4D. Statistically significant p values are marked with ∗.
| Set | M 4DregBA | M 4D | p value |
|---|---|---|---|
| TLC | 0.9687 ± 0.0579 | 0.9846 ± 0.0103 | ≪0.001∗ |
| FRC | 0.9539 ± 0.0711 | 0.9700 ± 0.0329 | ≪0.001∗ |
|
| |||
| ALL | 0.9613 ± 0.0651 | 0.9773 ± 0.0254 | ≪0.001∗ |
Figure 6.
Box plots of Dice coefficients for methods M 3D, M 4DregAB, M 4DregBA, and M 4D on (a) TLC and (b) FRC lung scans.
Figure 7.
Examples of segmentation results generated with methods M 4D, M 4DregAB, and M 4DregBA.
5.2. Computing Time
Segmentation with M 3D took 13.21 minutes on average for TLC and FRC data sets combined (TLC: 6.73 minutes, FRC: 6.48 minutes). Method M 4D required 12.22 minutes per 4D case, on average. Compared to M 3D, the reduction in computing time was primarily achieved due to synergies of 4D processing. Approaches M 4DregAB and M 4DregAB took 29.49 minutes per 4D case, on average, where the registration procedure contributed to about 20 minutes of computing time.
6. Discussion
The main advantage of our 4D approach M 4D is that it utilizes both lung volumes acquired at different respirator states for segmentation during all main processing stages, which is in contrast to the standard M 3D method and 4D variants M 4DregAB and M 4DregBA. The results presented in Section 5 clearly demonstrate this advantage.
6.1. Comparison of M 4D with M 3D
When compared to the 3D variant, statistically significant lung segmentation performance improvements, independent of test set, respiratory state, and performance metric, were observed (Tables 1 and 2). This is also clearly demonstrated by the examples shown in Figure 5. As shown in Tables 1 and 2, the observed gain in segmentation accuracy with M 4D was larger for cases with lung disease (test sets S asthma, S COPD, and S mix) compared to normal cases (test set S normal). The better segmentation performance of M 4D is expected, because it addresses several weaknesses of M 3D like problems with model initialization, which can cause the model to converge locally to other structures than lung boundaries. As Figure 6 as well as Tables 1 and 2 show, gains achieved with M 4D are higher for lungs imaged at FRC, which are generally more difficult to segment. Also, 4D processing reduces the computing time by 7.5% compared to sequential 3D processing.
6.2. Comparison of M 4D with M 4DregAB and M 4DregBA
Overall, segmentation performance of M 4D and M 4DregAB was found to be equivalent (Table 3), while the comparison between M 4D and M 4DregBA (Table 4) showed a statistically significant improvement for our proposed M 4D approach. Also, compared to M 4DregAB and M 4DregBA, our M 4D method showed a reduction in computing time by 58.6%. Thus, it is preferable to M 4DregAB and M 4DregBA, especially when the exact respiratory states are unknown and picking a lung scan with lower lung volume (exhale) as starting point (Volume A in Figure 1(b)) could potentially adversely impact segmentation performance. Figure 7 depicts examples where either M 4DregAB or M 4DregBA produces a local segmentation error, but M 4D avoids such problems.
6.3. Possible Improvements and Extensions
As can be seen in Figure 6, the proposed approach reduces the number and/or severity of outlier cases. However, some room for improvement still exists, which we will address in future work. For example, a better FRC model initialization would help in further improving overall segmentation performance of 3D and 4D methods, but we expect that M 4D would still perform better, because it utilizes both scans for model matching, which offers increased robustness.
Our method can be expanded to handle processing of more than two lungs scans at the same time. This can be done by extending (3) and (4) accordingly. Another advantage is that M 4D does not require any prior knowledge of the breathing state of the lungs in individual CT scans, because it does not make any assumptions about respiratory state (e.g., breathing sequence). An example for processing longitudinal lung CT scans in the context of cancer treatment planning/assessment is provided in Figure 8. Note that, due to lung disease (cancer), patient compliance with the utilized imaging protocol (e.g., acquisition at TLC) cannot be assumed.
Figure 8.
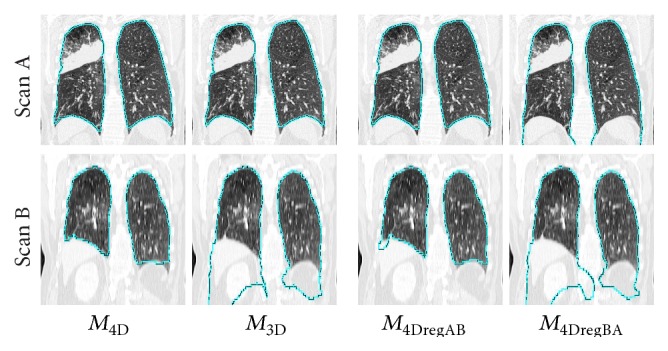
Comparison of results of methods M 4D, M 3D, M 4DregAB, and M 4DregBA on a longitudinal CT volume pair. The time between scans A and B was 19 months, and the imaging protocol was quite different.
7. Conclusions
In this paper, we have presented a 4D lung segmentation approach that utilizes a new 4D robust active shape model matching method and provided an evaluation of this method on a diverse set of 76 TLC and FRC lung scan pairs. In addition, a detailed comparison with its 3D lung segmentation counterpart as well as two variants of 4D registration based lung segmentation methods was performed, demonstrating the advantages of our approach in terms of segmentation performance and/or computing time. By avoiding any assumptions about the respiratory state of the imaged lungs, our approach provides flexibility and is applicable to pairs of TLC and FRC scans, other dynamic 4D lung CT scans, and longitudinal CT studies. Thus, the developed method is suited for applications like cancer treatment planning or assessment of other lung diseases like emphysema.
Acknowledgments
Gurman Gill contributed to the revision of this paper at Sonoma State University, CA. The authors thank Dr. Milan Sonka and Dr. Eric Hoffman at the University of Iowa for providing OSF code and image data, respectively. This work was supported in part by NIH Grant R01HL111453.
Conflict of Interests
The authors declare that there is no conflict of interests regarding the publication of this paper.
References
- 1.Underberg R. W. M., Lagerwaard F. J., Cuijpers J. P., Slotman B. J., de Koste J. R. V. S., Senan S. Four-dimensional CT scans for treatment planning in stereotactic radiotherapy for stage I lung cancer. International Journal of Radiation Oncology Biology Physics. 2004;60(4):1283–1290. doi: 10.1016/j.ijrobp.2004.07.665. [DOI] [PubMed] [Google Scholar]
- 2.Wielpütz M. O., Eberhardt R., Puderbach M., Weinheimer O., Kauczor H.-U., Heussel C. P. Simultaneous assessment of airway instability and respiratory dynamics with low-dose 4D-CT in chronic obstructive pulmonary disease: a technical note. Respiration. 2014;87(4):294–300. doi: 10.1159/000357448. [DOI] [PubMed] [Google Scholar]
- 3.Guerrero T., Sanders K., Castillo E., et al. Dynamic ventilation imaging from four-dimensional computed tomography. Physics in Medicine and Biology. 2006;51(4):777–791. doi: 10.1088/0031-9155/51/4/002. [DOI] [PubMed] [Google Scholar]
- 4.Kabus S., Klinder T., Murphy K., Ginneken B. V., Lorenz C., Pluim J. P. W. Evaluation of 4D-CT lung registration. In: Yang G.-Z., Hawkes D., Rueckert D., Noble A., Taylor C., editors. Medical Image Computing and Computer-Assisted Intervention—MICCAI 2009. Vol. 5761. Berlin, Germany: Springer; 2009. pp. 747–754. (Lecture Notes in Computer Science). [DOI] [PubMed] [Google Scholar]
- 5.Ehrhardt J., Werner R., Schmidt-Richberg A., Handels H. Statistical modeling of 4D respiratory lung motion using diffeomorphic image registration. IEEE Transactions on Medical Imaging. 2011;30(2):251–265. doi: 10.1109/tmi.2010.2076299. [DOI] [PubMed] [Google Scholar]
- 6.Hu S., Hoffman E. A., Reinhardt J. M. Automatic lung segmentation for accurate quantitation of volumetric X-ray CT images. IEEE Transactions on Medical Imaging. 2001;20(6):490–498. doi: 10.1109/42.929615. [DOI] [PubMed] [Google Scholar]
- 7.Kuhnigk J.-M., Dicken V., Zidowitz S., et al. New tools for computer assistance in thoracic CT. Part 1. Functional analysis of lungs, lung lobes, and bronchopulmonary segments. Radiographics. 2005;25(2):525–536. doi: 10.1148/rg.252045070. [DOI] [PubMed] [Google Scholar]
- 8.Korfiatis P., Skiadopoulos S., Sakellaropoulos P., Kalogeropoulou C., Costaridou L. Combining 2D wavelet edge highlighting and 3D thresholding for lung segmentation in thin-slice CT. British Journal of Radiology. 2007;80(960):996–1004. doi: 10.1259/bjr/20861881. [DOI] [PubMed] [Google Scholar]
- 9.Armato S. G., III, Sensakovic W. F. Automated lung segmentation for thoracic CT: impact on computer-aided diagnosis. Academic Radiology. 2004;11(9):1011–1021. doi: 10.1016/j.acra.2004.06.005. [DOI] [PubMed] [Google Scholar]
- 10.Leader J. K., Zheng B., Rogers R. M., et al. Automated lung segmentation in X-ray computed tomography: development and evaluation of a heuristic threshold-based schem. Academic Radiology. 2003;10(11):1224–1236. doi: 10.1016/s1076-6332(03)00380-5. [DOI] [PubMed] [Google Scholar]
- 11.Sluimer I., Prokop M., van Ginneken B. Toward automated segmentation of the pathological lung in CT. IEEE Transactions on Medical Imaging. 2005;24(8):1025–1038. doi: 10.1109/tmi.2005.851757. [DOI] [PubMed] [Google Scholar]
- 12.van Rikxoort E. M., de Hoop B., Viergever M. A., Prokop M., van Ginneken B. Automatic lung segmentation from thoracic computed tomography scans using a hybrid approach with error detection. Medical Physics. 2009;36(7):2934–2947. doi: 10.1118/1.3147146. [DOI] [PubMed] [Google Scholar]
- 13.Pu J., Paik D. S., Meng X., Roos J., Rubin G. D. Shape ‘break-and-repair’ strategy and its application to automated medical image segmentation. IEEE Transactions on Visualization and Computer Graphics. 2011;17(1):115–124. doi: 10.1109/tvcg.2010.56. [DOI] [PMC free article] [PubMed] [Google Scholar]
- 14.Sun S., Bauer C., Beichel R. Automated 3D segmentation of lungs with lung cancer in CT data using a novel robust active shape model approach. IEEE Transactions on Medical Imaging. 2012;31(2):449–460. doi: 10.1109/tmi.2011.2171357. [DOI] [PMC free article] [PubMed] [Google Scholar]
- 15.Gill G., Beichel R. R. Advances in Visual Computing. Vol. 8887. Springer; 2014. Segmentation of lungs with interstitial lung disease in CT scans: a TV-L1 based texture analysis approach; pp. 511–520. (Lecture Notes in Computer Science). [DOI] [Google Scholar]
- 16.Wilms M., Ehrhardt J., Handels H. Medical Image Computing and Computer-Assisted Intervention—MICCAI 2012: 15th International Conference, Nice, France, October 1–5, 2012, Proceedings, Part II. Vol. 7511. Berlin, Germany: Springer; 2012. A 4d statistical shape model for automated segmentation of lungs with large tumors; pp. 347–354. (Lecture Notes in Computer Science). [DOI] [PubMed] [Google Scholar]
- 17.Perperidis D., Mohiaddin R., Edwards P., Rueckert D. Segmentation of cardiac MR and CT image sequences using model-based registration of a 4D statistical model. Medical Imaging 2007: Image Processing; February 2007; San Diego, Calif, USA. p. 9. [DOI] [Google Scholar]
- 18.Lekadir K., Merrifield R., Yang G.-Z. Outlier detection and handling for robust 3-D active shape models search. IEEE Transactions on Medical Imaging. 2007;26(2):212–222. doi: 10.1109/tmi.2006.889726. [DOI] [PubMed] [Google Scholar]
- 19.Sun S., Sonka M., Beichel R. R. Graph-based 4D lung segmentation in CT images with expert-guided computer-aided refinement. Proceedings of the IEEE 10th International Symposium on Biomedical Imaging (ISBI ’13); April 2013; San Francisco, Calif, USA. pp. 1312–1315. [DOI] [Google Scholar]
- 20.Bauer C., Eberlein M., Beichel R. R. Graph-based airway tree reconstruction from chest CT scans: evaluation of different features on five cohorts. IEEE Transactions on Medical Imaging. 2015;34(5):1063–1076. doi: 10.1109/tmi.2014.2374615. [DOI] [PMC free article] [PubMed] [Google Scholar]
- 21.Gill G., Bauer C., Beichel R. R. A method for avoiding overlap of left and right lungs in shape model guided segmentation of lungs in CT volumes. Medical Physics. 2014;41(10) doi: 10.1118/1.4894817.101908 [DOI] [PMC free article] [PubMed] [Google Scholar]
- 22.Sonka M., Hlavac V., Boyle R. Image Processing, Analysis, and Machine Vision. Toronto, Canada: Thompson Learning; 2008. [Google Scholar]
- 23.Blair R. C., Karniski W. An alternative method for significance testing of waveform difference potentials. Psychophysiology. 1993;30(5):518–524. doi: 10.1111/j.1469-8986.1993.tb02075.x. [DOI] [PubMed] [Google Scholar]


