

Abstract
This study investigated the hypothesis that controlled media mixing will enhance tissue formation and increase mechanical properties of anatomically-shaped tissue engineered menisci. Bovine meniscal fibrochondrocytes were seeded in 2% w/v alginate, cross-linked with 0.02 g/mL CaSO4, and injected into molds of menisci. Engineered menisci were incubated for up to 6 weeks. A mixing media bioreactor was designed to ensure proper mixing of culture medium while protecting constructs from the spinning impeller. Impeller speeds were calibrated to produce Reynolds number (Re) of 0.5, 2.9, 5.8, 10.2, and 21.8. Constructs were divided an tested in confined compression and in tension to determine the equilibrium and tensile moduli, respectively. Media stimulation resulted in a 2 to 5 fold increase in mechanical properties and a 2 to 3 fold increase in matrix accumulation in constructs over 6 weeks in culture. Benefits from mixing stimulation for collagen accumulation and compressive modulus appeared to peak near Re 2.9, and decreased with increased mixing intensity. This study suggests that fluid mixing can be optimized to enhance mechanical properties of anatomically-shaped engineered constructs.
Keywords: Tissue Engineering, meniscus, alginate, media mixing stimulation
1. Introduction
Meniscal lesions are frequent injuries that lead to degeneration of knee articular cartilage [1]. Cadaveric meniscal allografts remain a preferred method of treatment [2], but this approach suffers from the scarcity of donor tissue and the risk of disease transmission. Moreover, size matching is of high importance because geometry is crucial for proper functional performance [3, 4]. Collectively, these factors have spurred interest in meniscal tissue engineering (TE).
Current meniscal TE efforts have focused on the repair of focal defects through the use of stem cells [5, 6] and scaffold materials [7, 8]. There have also been efforts to characterize the behavior of meniscal fibrochondrocytes and how these cells generate extracellular matrix (ECM) in scaffolds with simple geometry, including agarose [9], alginate [10], chitosan-graft-poly(N-isopropylacrylamide) [11], ploy (ε-caprolactone) [12], polyglycolic acid (PGA) [9], polyethylene terephthalate [13], and poly(L -lactic acid) [14]. Few studies have attempted to engineer whole menisci [15-17], due to the large size and the challenges associated with replicating the complex geometry.
Many biomaterials have been used to engineer small tissue samples, few can be formed into a prescribed geometry, especially an anatomical one such as the meniscus. Fewer still, can be combined with cells and formed into a desired shape while maintaining cell viability. Recently, the generation of anatomically-shaped engineered menisci based on MRI and μCT images was made possible using alginate combined with tissue injection molding [15, 18]. These studies were encouraging, but the implants had heterogeneous matrix distribution and mechanical properties that were significantly worse than those of native tissue. Producing constructs that mimic the mechanical properties of native tissue still remains a challenge.
Controlled media mixing is widely used to stimulate TE constructs seeded with articular chondrocytes (AC) [19-22] and has been used with meniscal fibrochondrocytes [13, 23]. Several studies demonstrated that mixing bioreactors increase the amount of extracellular matrix (ECM) 3 to 9 fold and mechanical properties 3 to 4 fold for TE cartilage [9, 13, 20-22]. Media mixing stimulation is relatively simple to implement compared to direct compressive or tensile stimulation.
Based on the large size and unusual geometry of anatomically-shaped TE menisci, significant gradients in nutrient transport and ECM composition likely exist [15]. We hypothesized that media mixing will enhance transport of nutrients and ECM around and inside of TE constructs, improving the amount and homogeneity of ECM assembly. To test this hypothesis, we developed a bioreactor to control the extent of media mixing and determined how mixing affected the spatial pattern of ECM assembly and mechanical properties in anatomically shaped TE menisci.
2. Materials and methods
2.1. Molded constructs
Molds for generating anatomically-shaped TE menisci were made as previously described [15, 24]. Briefly, bovine meniscal fibrochondrocytes were isolated from freshly slaughtered 1 to 3 day old calves by 0.3% collagenase digestion. Cells were then seeded into sterile 2% w/v low viscosity high G-content alginate at 50×106 cells/mL. The alginate-cell suspension was combined with 0.02 g/mL CaSO4 and injected into either silastic impression molds of bovine menisci or μCT/MRI-based ABS plastic molds of ovine menisci. Molds were allowed to post-crosslink in 60 mM CaCl2 for 20 minutes so that gels could be removed intact. Silastic impression molds produced menisci with a volume of 4.5 to 5.0 mL (large volume constructs), while ovine molds volume ranged from 1.5 to 1.8 mL (small volume constructs).
2.2. Culture environment
A total of 25 small volume and 19 large volume constructs were cultured statically to compare spatial differences between the two groups. Larger volume constructs exhibited detectable spatial heterogeneity in both mechanical and biochemical properties, so these were chosen as the focus for mixing bioreactor studies. 51 molded constructs were cultured in a mixing media bioreactor consisting of a plastic delrin ring with stainless steel wire mesh to support the meniscal construct over a magnetic stir bar (Fig. 1 A&B). Mixing intensity was quantified by the Reynolds number (Re); Re < 10 was assumed to produce laminar flow (i.e., relatively low mixing), and Re > 10 was assumed to produce turbulent flow (i.e., high mixing). Re was calculated using established models of flow through a grid [19, 25, 26]. In these models, fluid flow through the grid, in our case a wire mesh, attenuates eddy waves generated by the oscillations of the stir bar (Fig. 1C). Re was calculated as: where ρ was the fluid density (1 g/mL), ℓ was the mesh pore size (38 μm), μ was the fluid viscosity (0.001 Pa·s), ω was the angular velocity (varied from 1 to 15.7 rad/s) and L was the stir bar length (varied from 14 to 38 mm). Mixing intensity was altered by changing stir bar length and angular velocity (Table 1).
Figure 1.

(A) Bottom view of mixing media bioreactor with magnetic impeller and a white delrin plastic ring. (B) Engineered menisci resting on stainless steel wire mesh that is attached to the delrin ring. (C) Grid flow model of turbulent flow generated by the magnetic impeller where eddies are attenuated by the fine wire mesh producing a more steady flow.
Table 1.
For each mixing intensity represented by a Reynolds number, listed is the respective magnetic stir bar length, the number of rotations per minute (RPM), and the resulting type of flow in the mixing media bioreactor.
| Re # | Stir Bar Length (cm) | RPM | Flow Mode |
|---|---|---|---|
| 0.5 | 1.4 | 10 | Laminar |
| 2.9 | 2.5 | 30 | Laminar |
| 5.8 | 3.8 | 40 | Laminar |
| 10.2 | 3.8 | 70 | Turbulent |
| 21.8 | 3.8 | 150 | Turbulent |
Samples were cultured at Re 0.5 (n = 9), Re 2.9 (n = 9), Re 5.8 (n = 12), Re 10.2 (n = 12), and Re 21.8 (n = 9). All constructs were incubated in DMEM with 10% FBS, 100 U/mL penicillin, 100 μg/mL streptomycin, 0.1 mM non-essential amino acids, 50 μg/mL ascorbate, and 0.4 mM L-proline medium for up to 6 weeks.
2.3. Sample preparation
Upon removal from culture, the menisci were photographed then cut to expose and photograph the cross section. 2 sets of 6mm × 1mm plugs were cut from the face, center and bottom (Fig. 2) and used for mechanical analysis. Excess surrounding tissue from respective spatial locations was used for biochemistry; this tissue was weighed to obtain the wet weight (WW), frozen, lyophilized, then weighed again to obtain the dry weight (DW), and digested in papain for biochemical analysis [27].
Figure 2.
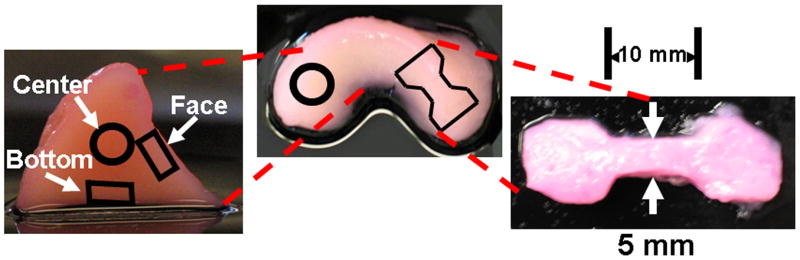
(Left) Spatial locations of biopsy plugs taken for confined compression and biochemical analysis. (Right) Sample dog bone of engineered tissue taken for tensile testing. The test area dimensions are 10 mm × 5mm × 2mm.
2.4. Mechanical analysis
As described previously [24, 28] equilibrium modulus was determined under confined compression via stress relaxation tests by imposing 10 × 50 μm steps on the gel discs and fitting resultant loads to a poroelastic model [29] (EnduraTech; Electroforce (ELF) 3200 System, Minnetonka, MN).
Dog bones for tensile testing were cut from the same construct (Fig. 2). Samples were tested to failure at a strain rate of 0.75%/s, slow enough to assume quasi-static loading and ensure failure at the central test region, not at the grips [30]. The tensile modulus was calculated as the slope of the linearly elastic region of the stress-strain curve, using linear correlation analysis [30].
2.4. Biochemistry
A modified DMMB dye assay at pH 1.5 [31] was performed to determine GAG content in both TE constructs and culture media. The hydroxyproline assay was used to measure total collagen content [32]. DNA content was measured via Hoechst dye assay [27]. Data were not normalized to DNA content due to significant deceases in DNA content for constructs exposed to mixing media stimulation. Instead, all data were normalized to wet weight.
2.5. Histology
Cross-sections of molded constructs were fixed in 10% buffered formalin with 1mM CaCl2 to prevent gel solubilization [33]. Fixed sections were then stained with Safranin-O to observe GAG formation and picrosirius red to observe collagen localization. The latter were viewed with polarized light to observe collagen fiber organization.
2.6. Statistics
Data were analyzed by 2-way ANOVA using Bonferroni t-test for post-hoc analysis. All statistical analyses were implemented with Sigmastat version 3.0, and all data are expressed as mean ±SD.
3. Results
3.1. Construct appearance and composition
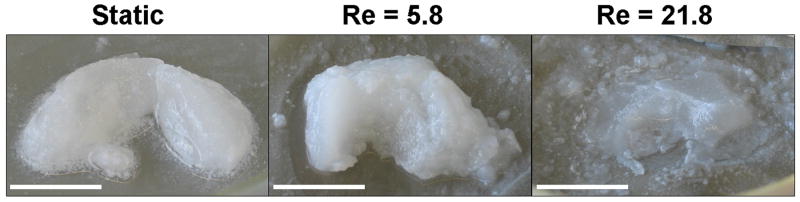
All groups of engineered constructs retained shape for the duration of culture (Fig. 3, column 1). Large volume static samples at 6 weeks exhibited a dense region of tissue formation at the center of the cross-sections (Fig. 3, columns 1&2). Visual inspection of cross-sections at 6 weeks showed an increase in tissue homogeneity with increased mixing intensity. As mixing intensity increased, the constructs contained a darker and more opaque center compared to static samples (Fig. 3, column 2). Safranin O staining at 6 weeks indicated a large increase in GAG accumulation for all groups (Fig. 3, column 3). Collagen accumulation at 6 weeks was not uniform across mixing intensities. Static samples and those at lower mixing intensities (Re of 0.5 and 2.9) showed accumulation of small fiber bundles, while the highest mixing intensity, Re 21.8, did not (Fig. 3, column 4).
Figure 3.

Photographs of (column 1) intact implants, (column 2) cross-sectional views, (column 3) tissue sections stained with Safranin-O at 200× original magnification and (column 4) tissue sections stained with picrosirius red at 200× original magnification for engineered cartilage at 0.29 weeks and 6 weeks for static and mixing intensities of Re 0.5, Re 2.9, Re 21.8. Scale bars represent (column 1) 10mm, (column 2) 2mm, and (column 3&4) 100 μm. Arrows point to collagen fiber bundles.
3.2. Comparison between large volume and small volume constructs
To compare the heterogeneity, we examined constructs spatially at the bottom, center, and face locations (Fig. 4, columns 2&3). We also compared overall construct performance by averaging the 3 locations (Fig. 4, column 1). Both small and large volume constructs were near the initial target seeding density of 0.4 μg DNA/mg WW (Fig. 4 row 1), but DNA content in small volume constructs was significantly lower than in large volume constructs for all three time points (P < 0.01). Neither large nor small volume constructs showed any significant differences between the bottom, center, or face locations for any time point, except for large constructs at 6 weeks. At 6 weeks, large constructs had significantly higher DNA content in the bottom compared to the center and face (P < 0.05).
Figure 4.

Plots of DNA content (row 1), collagen content (row 2), GAG content (row 3), and compressive modulus (row 4) comparing large and small volume constructs (column 1) and looking at the individual spatial properties for each volume size (column 2&3 respectively). For column 1 a “ ” denotes significant differences with respect to 0.29 weeks culture time in large volume constructs, a “
 ” denotes difference in small volume constructs, and a “Δ” denotes differences between small and large volume constructs. For columns 2 and 3 a “
 ” denotes significant differences with respect to 0.29 weeks culture time in the bottom location, a “” denotes differences in the center location, a “#” denotes differences in the face locations with time, and a “Δ” denotes differences between bottom, center, or face locations for a given time point. Data represented as mean ±SD and P < 0.05.
No significant difference in collagen content was found between small and large constructs across all time points (Fig. 4, row 2). Large volume constructs had a significant increase in collagen content at 6 weeks (P < 0.001), while small constructs had significant increases in collagen at both 2 and 6 weeks (P < 0.01). No detectable difference in collagen content was found with location for either large or small volume constructs.
GAG content in both small and large constructs had increased at 2 and 6 weeks compared to 0 week controls (P < 0.001). Large volume constructs at 6 weeks had significantly higher GAG content than small constructs (P < 0.05) (Fig. 4, row 3). Large constructs showed spatial variation in GAG content at later times. Specifically, GAG content was higher on the bottom compared to other locations (P < 0.01).
Compressive equilibrium modulus (Fig. 4, row 4) increased for both small and large constructs at later time points (P < 0.001). Small constructs were stiffer in compression compared to large constructs at 2 and 6 weeks (P < 0.01). At later time points, large constructs showed spatial variation with a higher compressive modulus at the center compared to the bottom (P < 0.05).
Large constructs tended to have larger differences between locations compared to small constructs particularly for DNA and GAG contents. As a result, all mixing media comparisons were conducted using large volume constructs.
3.3. Effect of mixing intensity
Mixing decreased DNA at all intensities (P < 0.001) (Fig. 5). The decrease was a function of mixing intensity, with higher intensities causing more DNA loss (P < 0.001).
Figure 5.

DNA content, GAG content, and collagen content found in engineered constructs (column 1) and cumulative release to the culture medium (column 2) for different mixing intensities. For column 1 a “Δ” denotes a significant difference with respect to 0.29 weeks cultures unless otherwise specified within a given mixing intensity, a “” denotes significant differences compared to all other 0.29 weeks values of different mixing intensities unless otherwise specified, a “” denotes a difference compares to all other 2 weeks values, and a “ ” denotes a difference compared to all other 6 weeks values. In column 2 a “Δ” denotes a significant difference between media values for that given time point, and the remainder denote differences between respective time points for a given mixing intensity: “
 ” = static, “” = Re 0.5, “
 ” = Re 2.9, “
 ” = Re 5.8, “
 ” = 10.2, and “
 ” = Re 21.8. For symbols not accompanied by bars signifies a significantly higher concentration than all other time points. Data presented as mean ±SD and P < 0.05.
Despite the loss of DNA, at 6 weeks all mixing intensities increased GAG content (P < 0.001) (Fig. 5). Re 21.8 had a 2 to 3 fold increase in GAG content compared to all other groups (P < 0.001). Collagen content at 6 weeks followed a similar trend; all groups showed an increase with the exception of Re 21.8 (P < 0.001) (Fig. 5). The highest mixing intensity hindered collagen accumulation. Collagen content peaked at Re 5.8 for 6 weeks of culture, a 2 fold increase compared to static controls (P < 0.05).
The media were analyzed biochemically because of the possibility that increasing mixing intensity could extract cells and ECM from engineered constructs to the media (Fig. 5). Cumulative DNA content accumulation in the media was greatest for static and at Re 0.5 while all other mixing intensity groups were similar. For all culture groups except Re 10.2, a large initial DNA release to the media occurred at 1 week (P < 0.05), followed by minimal DNA release. For the static and Re 0.5 culture group, DNA accumulation in the media continued to increase throughout culture.
GAG lost to the media was lowest for static cultures and greatest for Re 5.8 and Re 10.2 (Fig. 5). At week 1, significantly more GAG was lost to the media from Re 10.2 constructs compared to any other group (P < 0.001), while Re 5.8 constructs had significantly higher GAG accumulation in the media than static media samples at weeks 2 and 3 (P < 0.01). Collagen accumulation in the media followed a similar trend as GAG content, with static and Re 0.5 having the lowest amounts of collagen in the media (Fig. 5). Throughout all 6 weeks of culture Re 5.8 and Re 10.2 had significantly higher amounts of collagen found in the media than any other culture group (P < 0.01).
3.4. Mechanical analysis
Compressive equilibrium modulus increased 2 to 5 fold during the course of 6 week culture (Fig. 6). This increase was most prominent (4 to 5 fold, P < 0.05) for Re ≤ 2.9 and less pronounced for Re 5.8, 10.2, and 21.8.
Figure 6.

Compressive equilibrium modulus and tensile modulus for different mixing intensities across culture time. A “Δ” denotes significant difference compares to 0.29 weeks respective mixing intensity groups unless otherwise denoted. A, “” denotes a difference between Re 0.5 and 2.9 within 2 week groups and “” denotes a difference with the top 3 mixing intensities within 6 weeks values of different mixing intensities unless otherwise specified. Data presented as mean ±SD and P < 0.05.
Higher mixing intensities (Re 5.8 and 21.8) had a 3 to 4 fold increase compared to lower intensities (Re 0.5 and 2.9) (P < 0.05) (Fig. 6) on tensile modulus. However, increases did not continue with culture time. Re 5.8 (P < 0.05) and above tended to have a consistent decrease in tensile modulus at 6 weeks compared to 0 and 2 week samples. Re 2.9 had a significant increase in tensile modulus at 6 weeks compared to 2 week constructs (P < 0.05).
3.5. Spatial comparison between mixing intensities
Differences in spatial accumulation of matrix were observed between culture conditions (Fig. 7). With mixing GAG accumulation increased to a great degree with the highest intensity (Re 21.8) (Fig. 7, row 3 column 3). Most of the GAG was concentrated at the face of Re 21.8 constructs significantly more so than in the bottom and center locations (P < 0.01). While static samples had significantly more GAG located at the bottom compared to the center at 2 weeks (P < 0.01), other mixing intensities (with the exception of Re 21.8) became more homogeneous in GAG concentration throughout culture (data not shown for Re 5.8 and Re 10.2).
Figure 7.

Spatial properties for DNA content (row 1), collagen content (row 2), GAG content (row 3) and compressive modulus (row 4) for Re 0.5 (column 1), Re 2.9 (column 2), and Re 21.8 (column 3). A “” denotes significant difference compared to 0.29 weeks in the bottom location, a “” denotes a difference compared to 0.29 weeks in the center location, a “#” denotes a difference compared to 0.29 weeks in the face locations, and a “Δ” denotes differences between bottom, center, or face locations for a given time point. Data represented as mean ±SD and P < 0.05.
Similar trends were found for equilibrium compressive modulus (Fig. 7, row 4). Static samples at 6 weeks had a significantly higher modulus at the center (P < 0.05). Mixing intensities of Re 0.5, Re 2.9, and Re 5.8 all had significant increases in modulus by 6 weeks, but no significant difference was found with location across all culture times. Mixing intensities Re 10.2 and Re 21.8 did not increase compressive modulus globally or for any individual location, and as such was not significantly different among locations with time. Locations that did have significant increases in modulus at 6 weeks included Re 0.5 center, Re 2.9 center, and Re 5.8 bottom (all P < 0.05, data no shown).
Collagen content in mixed media had high variance throughout the construct (Fig. 7, row 2). No spatial differences were detected for any mixing group except for Re 21.8, which had low collagen throughout. At 2 weeks, Re 21.8 constructs had significantly higher collagen content in the bottom than in the face (P < 0.05), but no location showed a significant increase with time. At 6 weeks statically cultured constructs had significant increases in collagen content with respect to 0.29 week cultures across all spatial locations (P < 0.001), as did Re 0.5 (P < 0.05). Re 2.9 only had a significant increase at 6 weeks at the bottom location (P < 0.05), Re 5.8 at both the bottom and face locations (P < 0.05), and Re 10.2 at the bottom and center locations (P < 0.05).
None of the mixing media groups showed any significant spatial differences in DNA content throughout culture (Fig. 7, row 1). However, as previously stated, static constructs had significantly higher DNA content in the bottom compared to the center and face at 6 weeks (P < 0.05). All mixing media locations showed uniform decreases in DNA content at 2 and 6 weeks compared to the 0.29 week time point (P < 0.01).
4. Discussion
We investigated the hypothesis that media mixing will enhance transport of nutrients and ECM around and inside of TE meniscal constructs, improving the amount and homogeneity of ECM assembly. We found that the process of ECM assembly in injection molded TE menisci was significantly altered by culture in a mixing bioreactor (Figs. 5-7). The primary effects were to redistribute ECM, forming a tissue that was more spatially homogeneous than static controls, with the exception of the highest mixing intensity (Fig. 7). However, mixing also enhanced the loss of ECM to the culture media compared to static controls (Fig. 5) and detrimentally affected compressive modulus at higher intensities (Fig. 6). These results demonstrate the ability to modulate spatial heterogeneity of TE menisci and also show that mixing media stimulation was not uniformly beneficial across all mixing intensities.
Spatial properties were of interest because both ovine and bovine menisci have a unique shape and a larger volume than the types of constructs used in other studies. Prior TE meniscal and cartilage studies focused on small simple geometries ranging in volume from 0.06 to 1.8 mL [9, 13, 20], while we used anatomically shaped constructs ranging from 1.5 to 5.0 mL. The larger volume could result in different nutrient transport and ECM production behavior. Static cultures showed that large volume constructs had larger differences in their spatial profile compared to smaller constructs (Fig. 4). As a result large constructs were used to study the effect of mixing media stimulation. Trends found by averaging all locations showed that small and large constructs were similar across all biochemical and mechanical measures (Fig. 4, column 1), though compressive modulus was higher in smaller constructs, possibly related to the additional crosslinking step needed to remove constructs from molds. Post-crosslinking with CaCl2 creates a more rigid skin at the surface of meniscal constructs that thickens with exposure time. While time was kept constant for both large and small constructs, the thickness of the skin with post-crosslinking represented a larger fraction of the cross-sectional area of small constructs and thus would explain higher compressive properties.
Temporal patterns in ECM accumulation were similar in large and small volume constructs (Fig. 4, columns 2&3). The only difference was that larger constructs tended to have larger spatial differences, as evidenced by the visual heterogeneity seen at the cross sections (Fig. 3, column 2). As observed previously [15] the TE menisci appear to grow ECM from the center out. Since larger constructs have a larger volume to fill, the spatial heterogeneity in biochemical composition and mechanical properties is more evident. As a result, we used large volume constructs to better examine the effect of mixing media stimulation on these anatomical TE menisci.
We used mixing media stimulation because of positive results found in prior studies using this type of stimulation of articular cartilage [19-22]. The observed 2 to 3 fold increase in matrix accumulation and 1.2 to 4 fold increase in mechanical properties correspond to findings in the literature. The most surprising trend was the large loss of DNA content with media mixing (Figs. 5&7). Increasing mixing intensity increased the loss of DNA content in the constructs, but did not increase the amount found in the media (Fig. 5). In fact, increasing mixing intensity resulted in decreased DNA content in the media. The lower DNA content with higher mixing intensities could be due to cell destruction as a result of the spinning impeller (Fig. 1 A). The loss of DNA content in alginate constructs could be due to cells being washed out as a result of increased fluid flow from media mixing. This behavior was observed in studies with PEG gels in a rotating wall bioreactor [9]. GAG content did not change with mixing except for the large increase at the highest intensity (Re 21.8) (Fig. 5), but this large increase did not result in an expected increase in compressive modulus and the trend was towards decreasing tensile modulus for higher mixing intensities by week 6. GAG and collagen loss to the media was increased as a result of mixing intensity particularly for Re 5.8 and Re 10.2 constructs. The observed loss in collagen with no improvement in mechanical properties was also seen in engineered agarose gels from Aufderheid et al [9], in which GAG loss at later time points was attributed to the lack of collagen assembly in constructs.
The observed increase in ECM homogeneity with mixing (Fig. 7) is consistent to findings by Neves et al. who observed enhanced homogeneity in TE fibrocartilage [13]. However, collagen accumulation remained highly localized with a specific region of the tissue (Fig. 3). The lack of organization could be due to the inability of collagen to bind to alginate and remain in the construct long enough to be organized into a cohesive matrix that would resemble native tissue. The redistribution of ECM away from the center observed at the highest mixing intensity agrees with bi-zonal findings by Marsano et al [20]. The increased fluid flow could have stimulated cells at the surface, increasing GAG production. However, GAG was more likely produced at the center and was pulled to the surface as a result of turbulence with mixing. Loss of GAG to the media as a result of fluid flow is further supported by the significant DNA loss in constructs and observed cell loss histologically, which occurred more at the surface.
Due to the high GAG content localized at the face, but no change in compressive modulus, we speculate that other mechanisms were responsible for the changes in mechanical properties in mixing media samples. The higher mixing intensity could have increased the rate of degradation of the alginate scaffold and removed the newly formed matrix. Our data are supported by an alginate degradation study that compared unseeded alginate meniscal gels under static, Re 5.8, and Re 21.8 mixing intensities in PBS supplemented with .2g/L of CaCl2 to mimic calcium concentration in DMEM (See appendix). We found that over the course of 3 weeks increasing the mixing intensity resulted in a significant decrease in construct weight and more obvious alterations of meniscal shape. This is in great contrast to what was observed in cell seeded constructs, suggesting that there exists some cell matrix interaction that aided in maintaining geometry throughout 6 weeks of culture for all mixing intensities.
5. Conclusions
This study began with the hypothesis that mixing media stimulation would enhance construct development. We found that mixing does affect ECM accumulation in large volume anatomically shaped TE menisci. The largest effect of mixing was the redistribution of ECM and the enhanced homogeneity in large volume constructs. However, mixing stimulation was not uniformly beneficial as indicated by DNA and ECM loss to the media and increased rate of scaffold degradation. But intermediate intensities appear to exist that can be optimally beneficial for construct growth.
Acknowledgments
The authors would like to thank the following funding sources: The Alfred P. Sloan Foundation, AO/ASOF Foundation, and Cornell BME NSF GK-12 program.
Appendix
To test the hypothesis that mixing intensity increased the rate of degradation of alginate hydrogels, we cultured acellular 2% w/v alginate hydrogels cross-linked with 0.02 g/mL CaSO4. Constructs were cultured for up to 3 weeks in PBS supplemented with .2g/L of CaCl2 to mimic the calcium concentration in DMEM. Upon removal from culture at 3 weeks, mixing intensity was found to have had a detrimental effect on overall shape fidelity (Appendix Fig. 1). Wet weights (WW) of constructs throughout culture showed (Appendix Fig. 2) that all samples tended to swell in the first week, especially static samples (P < 0.001). Significant decreases in WW also occurred with time for all 3 culture groups, with the largest being for the highest mixing intensity (P < 0.05). At the later time points, 17 and 21 days, significantly more WW mass was lost with each increase in mixing intensity (P < 0.05).
Appendix Figure 1.
Photographs of a cellular alginate gels after 3 weeks of culture in static, Re 5.8 and Re 21.8 mixing intensities. Visually it can be seen that increasing mixing intensity has a large effect on overall shape on constructs. Scale bars represent 10mm.
Appendix Figure 2.

Plot of wet weight mass for acellular alginate hydrogels over 21 days of culture. A “” denotes a significant difference for static samples compared to 0 day unless otherwise specified, a “” denotes a difference for Re 5.8 compared to 0 day, a “#” denotes differences in Re 21.8 compared to 0 day, and a “Δ” denotes differences between static, Re 5.8, or Re 21.8 for a given time point. Data represented as mean ±SD and P < 0.05.
References
- 1.Peters G, Wirth CJ. The current state of meniscal allograft transplantation and replacement. The Knee. 2003 Mar;10(1):19–31. doi: 10.1016/s0968-0160(02)00139-4. [DOI] [PubMed] [Google Scholar]
- 2.McDermott ID, Sharifi F, Bull AM, Gupte CM, Thomas RW, Amis AA. An anatomical study of meniscal allograft sizing. Knee Surg Sports Traumatol Arthrosc. 2004 Mar;12(2):130–135. doi: 10.1007/s00167-003-0366-7. [DOI] [PubMed] [Google Scholar]
- 3.Meakin JR, Shrive NG, Frank CB, Hart DA. Finite element analysis of the meniscus: the influence of geometry and material properties on its behaviour. The Knee. 2003 Mar;10(1):33–41. doi: 10.1016/s0968-0160(02)00106-0. [DOI] [PubMed] [Google Scholar]
- 4.Dienst M, Greis PE, Ellis BJ, Bachus KN, Burks RT. Effect of lateral meniscal allograft sizing on contact mechanics of the lateral tibial plateau: an experimental study in human cadaveric knee joints. The American journal of sports medicine. 2007 Jan;35(1):34–42. doi: 10.1177/0363546506291404. [DOI] [PubMed] [Google Scholar]
- 5.Pabbruwe MB, Kafienah W, Tarlton JF, Mistry S, Fox DJ, Hollander AP. Repair of meniscal cartilage white zone tears using a stem cell/collagen-scaffold implant. Biomaterials. Jan 4; doi: 10.1016/j.biomaterials.2009.12.023. [DOI] [PubMed] [Google Scholar]
- 6.Horie M, Sekiya I, Muneta T, Ichinose S, Matsumoto K, Saito H, et al. Intra-articular Injected synovial stem cells differentiate into meniscal cells directly and promote meniscal regeneration without mobilization to distant organs in rat massive meniscal defect. Stem cells (Dayton, Ohio) 2009 Apr;27(4):878–887. doi: 10.1634/stemcells.2008-0616. [DOI] [PubMed] [Google Scholar]
- 7.Fox DB, Luther JK, Whitener D. An in vitro model to assess mechanisms and efficacy of a cellular conduit for treatment of avascular meniscal injuries. In vitro cellular & developmental biology. 2008 Jul-Aug;44(7):185–188. doi: 10.1007/s11626-008-9111-3. [DOI] [PubMed] [Google Scholar]
- 8.Becker R, Wirz D, Wolf C, Gopfert B, Nebelung W, Friederich N. Measurement of meniscofemoral contact pressure after repair of bucket-handle tears with biodegradable implants. Archives of orthopaedic and trauma surgery. 2005 May;125(4):254–260. doi: 10.1007/s00402-004-0739-5. [DOI] [PubMed] [Google Scholar]
- 9.Aufderheide AC, Athanasiou KA. Comparison of scaffolds and culture conditions for tissue engineering of the knee meniscus. Tissue engineering. 2005 Jul-Aug;11(7-8):1095–1104. doi: 10.1089/ten.2005.11.1095. [DOI] [PubMed] [Google Scholar]
- 10.Collier S, Ghosh P. Effects of transforming growth factor beta on proteoglycan synthesis by cell and explant cultures derived from the knee joint meniscus. Osteoarthritis and cartilage / OARS, Osteoarthritis Research Society. 1995 Jun;3(2):127–138. doi: 10.1016/s1063-4584(05)80045-7. [DOI] [PubMed] [Google Scholar]
- 11.Chen JP, Cheng TH. Thermo-responsive chitosan-graft-poly(N-isopropylacrylamide) injectable hydrogel for cultivation of chondrocytes and meniscus cells. Macromolecular bioscience. 2006 Dec 8;6(12):1026–1039. doi: 10.1002/mabi.200600142. [DOI] [PubMed] [Google Scholar]
- 12.Baker BM, Mauck RL. The effect of nanofiber alignment on the maturation of engineered meniscus constructs. Biomaterials. 2007 Apr;28(11):1967–1977. doi: 10.1016/j.biomaterials.2007.01.004. [DOI] [PMC free article] [PubMed] [Google Scholar]
- 13.Neves AA, Medcalf N, Brindle KM. Influence of stirring-induced mixing on cell proliferation and extracellular matrix deposition in meniscal cartilage constructs based on polyethylene terephthalate scaffolds. Biomaterials. 2005 Aug;26(23):4828–4836. doi: 10.1016/j.biomaterials.2004.12.002. [DOI] [PubMed] [Google Scholar]
- 14.Gunja NJ, Athanasiou KA. Effects of hydrostatic pressure on leporine meniscus cell-seeded PLLA scaffolds. J Biomed Mater Res A. 2009 Mar 12; doi: 10.1002/jbm.a.32451. [DOI] [PubMed] [Google Scholar]
- 15.Ballyns JJ, Gleghorn JP, Niebrzydowski V, Rawlinson JJ, Potter HG, Maher SA, et al. Image-guided tissue engineering of anatomically shaped implants via MRI and micro-CT using injection molding. Tissue Eng Part A. 2008 Jul;14(7):1195–1202. doi: 10.1089/ten.tea.2007.0186. [DOI] [PubMed] [Google Scholar]
- 16.Ballyns JJ, Cohen D, Malone E, Maher SA, Potter HG, Wright TM, et al. An Optical Method for Evaluation of Geometric Fidelity for Anatomically Shaped Tissue Engineered Constructs. Tissue Eng Part C Methods. 2009 Sep 29; doi: 10.1089/ten.tec.2009.0441. [DOI] [PMC free article] [PubMed] [Google Scholar]
- 17.Kang SW, Son SM, Lee JS, Lee ES, Lee KY, Park SG, et al. Regeneration of whole meniscus using meniscal cells and polymer scaffolds in a rabbit total meniscectomy model. J Biomed Mater Res A. 2006 Sep 1;78(3):659–671. doi: 10.1002/jbm.a.30904. [DOI] [PubMed] [Google Scholar]
- 18.Ballyns JJ, Bonassar LJ. Image-Guided Tissue Engineering. Journal of cellular and molecular medicine. 2009 doi: 10.1111/j.1582-4934.2009.00836.x. In Press. [DOI] [PMC free article] [PubMed] [Google Scholar]
- 19.Gooch KJ, Kwon JH, Blunk T, Langer R, Freed LE, Vunjak-Novakovic G. Effects of mixing intensity on tissue-engineered cartilage. Biotechnology and bioengineering. 2001 Feb 20;72(4):402–407. doi: 10.1002/1097-0290(20000220)72:4<402::aid-bit1002>3.0.co;2-q. [DOI] [PubMed] [Google Scholar]
- 20.Marsano A, Wendt D, Raiteri R, Gottardi R, Stolz M, Wirz D, et al. Use of hydrodynamic forces to engineer cartilaginous tissues resembling the non-uniform structure and function of meniscus. Biomaterials. 2006 Dec;27(35):5927–5934. doi: 10.1016/j.biomaterials.2006.08.020. [DOI] [PubMed] [Google Scholar]
- 21.Bueno EM, Bilgen B, Barabino GA. Wavy-walled bioreactor supports increased cell proliferation and matrix deposition in engineered cartilage constructs. Tissue engineering. 2005 Nov-Dec;11(11-12):1699–1709. doi: 10.1089/ten.2005.11.1699. [DOI] [PubMed] [Google Scholar]
- 22.Bueno EM, Bilgen B, Barabino GA. Hydrodynamic parameters modulate biochemical, histological, and mechanical properties of engineered cartilage. Tissue Eng Part A. 2009 Apr;15(4):773–785. doi: 10.1089/ten.tea.2008.0081. [DOI] [PubMed] [Google Scholar]
- 23.Marsano A, Vunjak-Novakovic G, Martin I. Towards tissue engineering of meniscus substitutes: selection of cell source and culture environment. Conf Proc IEEE Eng Med Biol Soc. 2006;1:3656–3658. doi: 10.1109/IEMBS.2006.259748. [DOI] [PubMed] [Google Scholar]
- 24.Chang SC, Rowley JA, Tobias G, Genes NG, Roy AK, Mooney DJ, et al. Injection molding of chondrocyte/alginate constructs in the shape of facial implants. J Biomed Mater Res. 2001 Jun 15;55(4):503–511. doi: 10.1002/1097-4636(20010615)55:4<503::aid-jbm1043>3.0.co;2-s. [DOI] [PubMed] [Google Scholar]
- 25.O'Hern TJ, Torczynski JR. Reynolds number dependence of the drag coefficient for laminar flow through fine-scale photoetched screens. Experiments in Fluids. 1993;15(1):75–81. [Google Scholar]
- 26.Cherry RS, Papoutsakis ET. Hydrodynamic effects on cells in agitated tissue culture reactors. Bioprocess Engineering. 1986;1(1):29–41. [Google Scholar]
- 27.Kim YJ, Sah RL, Doong JY, Grodzinsky AJ. Fluorometric assay of DNA in cartilage explants using Hoechst 33258. Analytical biochemistry. 1988 Oct;174(1):168–176. doi: 10.1016/0003-2697(88)90532-5. [DOI] [PubMed] [Google Scholar]
- 28.Gleghorn JP, Jones AR, Flannery CR, Bonassar LJ. Boundary mode frictional properties of engineered cartilaginous tissues. European cells & materials. 2007;14:20–28. doi: 10.22203/ecm.v014a02. discussion 28-29. [DOI] [PubMed] [Google Scholar]
- 29.Kim YJ, Bonassar LJ, Grodzinsky AJ. The role of cartilage streaming potential, fluid flow and pressure in the stimulation of chondrocyte biosynthesis during dynamic compression. Journal of biomechanics. 1995 Sep;28(9):1055–1066. doi: 10.1016/0021-9290(94)00159-2. [DOI] [PubMed] [Google Scholar]
- 30.Drury JL, Dennis RG, Mooney DJ. The tensile properties of alginate hydrogels. Biomaterials. 2004 Jul;25(16):3187–3199. doi: 10.1016/j.biomaterials.2003.10.002. [DOI] [PubMed] [Google Scholar]
- 31.Enobakhare BO, Bader DL, Lee DA. Quantification of sulfated glycosaminoglycans in chondrocyte/alginate cultures, by use of 1,9-dimethylmethylene blue. Analytical biochemistry. 1996 Dec 1;243(1):189–191. doi: 10.1006/abio.1996.0502. [DOI] [PubMed] [Google Scholar]
- 32.Neuman RE, Logan MA. The determination of hydroxyproline. The Journal of biological chemistry. 1950 May;184(1):299–306. [PubMed] [Google Scholar]
- 33.Nakamura K, Kawaguchi H, Aoyama I, Hanada K, Hiyama Y, Awa T, et al. Stimulation of bone formation by intraosseous application of recombinant basic fibroblast growth factor in normal and ovariectomized rabbits. J Orthop Res. 1997 Mar;15(2):307–313. doi: 10.1002/jor.1100150222. [DOI] [PubMed] [Google Scholar]