

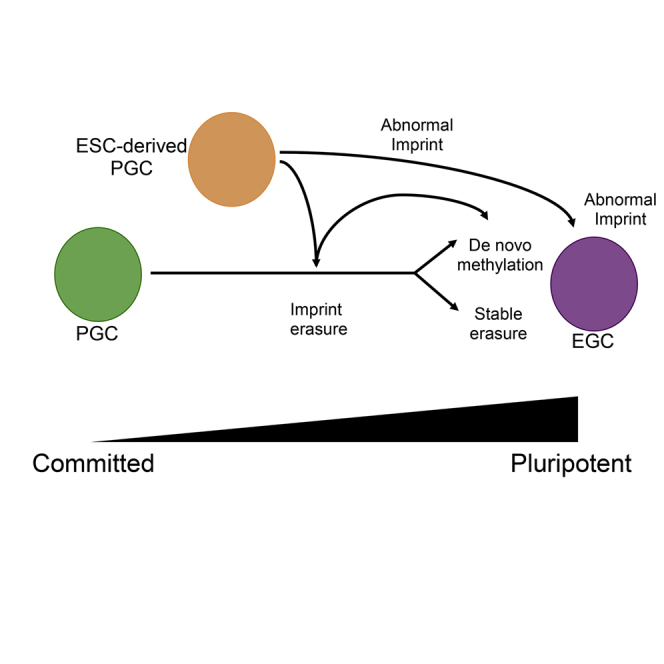
Summary
Primordial germ cells (PGCs) are fate restricted to differentiate into gametes in vivo. However, when removed from their embryonic niche, PGCs undergo reversion to pluripotent embryonic germ cells (EGCs) in vitro. One of the major differences between EGCs and embryonic stem cells (ESCs) is variable methylation at imprinting control centers (ICCs), a phenomenon that is poorly understood. Here we show that reverting PGCs to EGCs involved stable ICC methylation erasure at Snrpn, Igf2r, and Kcnqot1. In contrast, the H19/Igf2 ICC undergoes erasure followed by de novo re-methylation. PGCs differentiated in vitro from ESCs completed Snrpn ICC erasure. However, the hypomethylated state is highly unstable. We also discovered that when the H19/Igf2 ICC was abnormally hypermethylated in ESCs, this is not erased in PGCs differentiated from ESCs. Therefore, launching PGC differentiation from ESC lines with appropriately methylated ICCs is critical to the generation of germline cells that recapitulate endogenous ICC erasure.
Graphical Abstract
Highlights
-
•
The dynamics of ICC demethylation during reversion of PGCs to EGCs are revealed
-
•
Germline cells differentiated from ESCs exhibit unstable ICC demethylation
-
•
Germline cells differentiated from ESCs are more similar to EGCs than PGCs
In this article, Clark and colleagues show that germ cells differentiated in vitro from ESCs share a transcriptional relationship with both PGCs from the embryo and pluripotent EGCs. Using a new methylation-erasure assay based on isolated PGCs from the embryo, the authors show that in-vitro-differentiated PGCs are unable to stably maintain imprint erasure.
Introduction
Nuclear reprogramming of somatic cells using genetic modification and overexpression of pluripotent transcription factors is essential for creating induced pluripotent stem cells (iPSCs) in vitro (Takahashi and Yamanaka, 2006). An alternate approach that does not entail genetic modification involves primordial germ cells (PGCs) from the embryo, followed by culture-induced reversion into embryonic germ cell (EGC) lines. Both EGCs and iPSCs transcriptionally resemble undifferentiated embryonic stem cells (ESCs) in vitro, and, similar to ESCs, EGCs derived by PGC reversion in vitro have the capacity to contribute to chimeras with germline transmission (Labosky et al., 1994; Leitch et al., 2013b; Matsui et al., 1992; Resnick et al., 1992; Sharova et al., 2007; Stewart et al., 1994; Takahashi and Yamanaka, 2006). Despite these similarities, one of the major epigenetic differences with EGCs and iPSCs is variable methylation at imprinting control centers (ICCs).
Competency for PGC reversion to EGCs in the mouse embryo is found during a 6-day window starting from the time of PGC specification at embryonic day 7.5 (E7.5) through E13.5 after PGCs have settled in the genital ridge (Labosky et al., 1994; Leitch et al., 2013b, 2013c; Matsui et al., 1992; Resnick et al., 1992; Shim et al., 2008; Stewart et al., 1994; Tada et al., 1998). During this time, the germline undergoes a unique two-stage DNA demethylation event. In the first stage, which is completed soon after specification (at around E8.0), cytosine methylation is removed genome-wide from more than 50% of cytosines in a CG sequence context (Seisenberger et al., 2012). Methylated regions that are protected in the first stage include ICCs, some gonadal stage germline genes, particularly those involved in meiosis, as well as endogenous retroviruses (Guibert et al., 2012; Hajkova et al., 2002; Seisenberger et al., 2012; Vincent et al., 2013). In the second stage, which extends from E9.5 to E13.5, cytosine methylation in PGCs is removed in a time and locus-specific manner, with E13.5 PGCs considered the most hypomethylated germline epigenetic ground state. This includes removing (also referred to as erasing) methylation from ICCs in preparation for establishing new methylated marks on DNA in a sex-specific manner (Guibert et al., 2012; Hajkova et al., 2002; Kagiwada et al., 2013; Seisenberger et al., 2012).
Cytosine methylation in EGC lines has been studied extensively and the prevailing hypothesis is that ICCs are generally hypomethylated. However, close analysis reveals that ICC cytosine methylation is extremely variable, not only between lines but also between ICC sites within a given line (Labosky et al., 1994; Leitch et al., 2013a; McLaren and Durcova-Hills, 2001; Shim et al., 2008; Shovlin et al., 2008; Tada et al., 1998). This variability has led to three major hypotheses for cytosine methylation dynamics during PGC reversion to EGCs. The first hypothesis is that EGC lines reflect the epigenetic status of the PGCs in the embryo from which they were originally derived. The second hypothesis is that PGCs undergo incomplete cytosine methylation erasure, and thus the variable status in established EGC lines is due to heterogeneously terminated demethylation. The third hypothesis is that PGCs undergo demethylation as well as de novo methylation during the process of reverting from PGCs to EGCs.
In order to support or reject the hypotheses above, a critical analysis of PGCs immediately before, during, and after the process of reversion into EGCs is required. Understanding ICC methylation erasure and/or establishment provides a powerful opportunity to uncover basic principles of cytosine demethylation, stabilization of the hypomethylated state, and establishment of cytosine methylation in a locus-specific manner.
Results
Reversion of PGCs to EGCs Is Initially Associated with Germline Differentiation
In order to understand the initial events in EGC derivation, we first cultured E9.5 PGCs for 4 days under EGC derivation conditions, and we examined the timing of pioneering colony formation (Figure 1). The EGC derivation medium was based on a formulation for short-term maintenance of cultured E11.5 PGCs (Farini et al., 2005), and it contained fetal bovine serum (FBS) plus seven additional components as follows: fibroblast growth factor 2 (FGF2); chemokine (C-X-C Motif) ligand 12 (CXCL12), also called SDF1; stem cell factor (SCF), also called KIT-ligand; bone morphogenetic protein 4 (BMP4); leukemia inhibitory factor (LIF); forskolin; and N-acetyl cysteine (NAC). Therefore, for simplicity, the medium is referred to as 7-factor (7F). PGCs were sorted from the dorsal region of E9.5 embryos by crossing CD1 females to Oct4-IRES-Gfp males (Figure 1A). Bisulfite (BS) treatment, of DNA isolated from GFP-positive PGCs and GFP-negative somatic cells, followed by PCR (BS-PCR) and sequencing of clones revealed that the Snrpn and H19/Igf2 ICCs contained both methylated and unmethylated alleles, similar to previous reports (Figure 1B; Vincent et al., 2011). For EGC derivation, the GFP-positive PGCs were collected by sorting and then cultured on an acellular polyethylene terephthalate (PET) membrane to allow germ cell attachment without a protein substrate (Figure 1C). Sorted PGCs attached to the membrane within the first day of 7F culture, and most PGCs exhibited round (arrowhead) morphology (Figure 1C). On day 2, some PGCs acquired an elongated shape (arrows). These round and elongated PGCs remained as single cells on day 3, with small pioneering colonies first appearing between day 3 and day 4 (Figure 1C).
Figure 1.

PGCs Cultured Ex Vivo Generate Colonies within 4 Days
(A) FACS plot showing gate for isolating GFP+ PGCs at E9.5. SSC, side scatter.
(B) BS-PCR followed by cloning and sequencing for Snrpn and H19/Igf2 ICCs in sorted GFP+ PGCs and GFP− somatic cells (Soma) at E9.5.
(C) E9.5 PGCs cultured in 7F for 4 days. Arrowheads, round PGCs; arrows, elongated PGCs; circled area, a pioneering PGC colony.
(D) Whole-mount stain of E9.5 embryo for MVH (green) and OCT4 (red).
(E) Adult testis containing MVH+ OCT4− germ cells. Arrows point to a representative MVH+ OCT4− cell.
(F) Immunofluorescence for MVH on day 4 of culture in 7F medium. Arrows indicate cytoplasmic staining.
(G) Isotype (IgG) control. Arrows indicate background signal.
(H) Quantification of MVH+ cells on day 4 of culture in 7F medium (n = 1 biological replicate with 19 cells counted in six fields).
(I) Live imaging of GFP+ E9.5 PGCs on day 4 of culture in 7F medium. Arrowheads, single cell; circled areas, colonies.
Scale bars represent 10 μm (D–G) and 50 μm (C and I).
To determine whether colony formation was associated with PGC differentiation, we evaluated expression of the germline-specific protein called mouse vasa homolog (MVH). This protein is negative in PGCs at E9.5 and first becomes detectable in the germline from E10.5 to E11.5 (Toyooka et al., 2000). Immunofluorescence staining of embryos at E9.5 for OCT4 and MVH revealed that OCT4-positive (red) PGCs were negative for MVH (green) (Figure 1D). Adult testis containing MVH-positive germ cells was used as a positive control (Figure 1E). On the fourth day of culture in 7F medium, immunofluorescence staining with the anti-MVH antibody revealed that a large fraction of cultured PGCs expressed MVH protein in the cytoplasm (Figure 1F). In contrast, non-specific background signal was detected when using an isotype-matched primary antibody as a negative control (Figure 1G and quantified in Figure 1H). To confirm that cultured PGCs are OCT4 positive and originated from the Oct4-IRES-Gfp-sorted germline cells, we performed live imaging on day 4 and showed that 98% of PGCs expressed GFP (Figure 1I). This result indicates that the majority of E9.5 PGCs differentiate into MVH-positive germline cells within the first 4 days of 7F culture ex vivo, and that pioneering colony formation occurs between day 3 and day 4.
To determine whether 7F-cultured PGCs are capable of generating EGC lines, we trypsinized the cultured PGCs, and plated the cells on mouse embryonic fibroblasts (MEFs) in mouse ESC media containing serum plus LIF. Within the first 4 days of plating, dome-shaped colonies of GFP-positive cells emerged, which were passaged as single cells in trypsin to generate self-renewing colonies of GFP-positive EGC lines (Figure 2A). To evaluate germline identity, we examined MVH protein expression by immunofluorescence and discovered that MVH protein was no longer detectable (Figure 2B). As a positive control, we transiently transfected EGCs with a plasmid constitutively expressing the open reading frame of VASA, and we performed immunofluorescence with the anti-MVH antibody where signal could be detected in transfected cells (Figure 2C). Cell surface immunophenotyping demonstrated that the majority of OCT4-positive cells were also positive for the mouse pluripotent stem cell marker stage-specific embryonic antigen 1 (SSEA1) (Figure 2D). We quantified double-positive cells in three independently derived EGC lines, and we found that, in all three lines, the majority of Oct4-gfp cells are also SSEA1 positive (Figure 2E). We also performed teratoma analysis to examine pluripotency and discovered that the EGCs derived from 7F-cultured PGCs were capable of teratoma formation, with tumors displaying evidence of ectoderm, mesoderm, and endoderm (Figure 2F).
Figure 2.

Ex Vivo Cultured PGCs Revert to Pluripotency and Lose MVH Expression
(A) Image of GFP+ EGC colonies derived from E9.5 PGCs cultured in 7F medium.
(B) OCT4+ EGCs are negative for MVH protein as determined by immunofluorescence.
(C) Positive control using anti-MVH antibody on EGCs transfected with a transgene (t) expressing VASA.
(D) Representative flow plot for stage-specific embryonic antigen 1 (SSEA1) and GFP expression by EGCs.
(E) Quantification of SSEA1 and GFP double-positive cells in three independently derived EGC lines (n = 3 biological replicates of each).
(F) Teratoma analysis to test for pluripotency. EGCs derived from 7F-cultured PGCs were injected into three mice; 100% of mice exhibited teratomas with evidence of endoderm (left), mesoderm (middle), and ectoderm (right) by histology.
Scale bars represent 50 μm (A) and 20 μm (B, C, and F).
Differential ICC Methylation in EGC Lines
To evaluate DNA methylation, we chose three independently derived EGC lines and performed BS-PCR followed by cloning and sequencing for Snrpn and H19/Igf2 ICCs (Figure 3A). In order to prevent contamination with feeder cells, we used fluorescence-activated cell sorting (FACS) to isolate GFP and SSEA1 double-positive cells using the gates shown in Figure 2D prior to analysis. BS-PCR analysis of the sorted cells revealed that the Snrpn ICC is hypomethylated in all EGC lines, with one line (D10-7) exhibiting some DNA methylation (18% methylated CpGs). In contrast, the H19/Igf2 ICC was almost completely methylated in every EGC line, regardless of whether the EGC line was male or female (Figure 3A and quantified in Figure 3B), indicating that the memory of embryo gender (male or female) was lost with EGC derivation. This is because, if XX EGC lines remembered their origin as being from female embryos, they should have remained hypomethylated at the paternally methylated H19/Igf2 ICC after imprinting erasure.
Figure 3.

EGCs Derived from E9.5 PGCs Exhibit Locus-Specific De Novo Methylation at H19/Igf2 but Not Snrpn, Igf2r, or Kcnq1ot1 ICCs
(A) Three independent EGC lines generated from GFP+ cells isolated from individual embryos. Genotype of the EGC lines is shown as female (XX) or male (XY). Open circles, unmethylated CGs; closed circles, methylated CGs.
(B) Quantification of percentage CpG methylation levels in three EGC lines (mean and SEM).
(C) Four EGC sublines were generated from pooled GFP-positive PGCs from two litters of embryos at E9.5. Individual EGC colonies from the parental line were picked at passage 6 and expanded to generate the sublines for BS-PCR analysis at passage 10.
(D) Quantification of percentage CpG methylation in four EGC sublines (mean and SEM).
(E) BS-PCR for Igf2r and Kcnq1ot1 ICCs in the indicated EGC lines.
Significance in (B) and (D) was calculated using a one-way ANOVA followed by Tukey’s multiple comparison test. Significance was accepted at < 0.05.
To expand our analysis, we also evaluated sublines of EGCs by picking individual colonies at passage 6 from a mixed EGC line. This line (called EGC-1) was generated by combining and sorting embryos at E9.5 prior to plating all the pooled PGCs on a single PET membrane in 7F medium. DNA methylation in the EGC sublines was evaluated four passages after picking EGC colonies (passage 10 total after plating on MEFs in serum + LIF). Similar to independently derived EGC lines (where the EGC lines were established from individual embryos), the sublines also were hypomethylated at the Snrpn ICC, while being hypermethylated at the H19/Igf2 ICC (Figure 3C and quantified in Figure 3D). We noted that one subline (K13) had 39% CpG methylation at the Snrpn ICC, whereas the other sublines ranged from 9%–14%, indicating some variability among lines. We also examined two additional ICCs, the Igf2 receptor (Igf2r) and Kcnq1ot1, and discovered that, similar to Snrpn, these ICCs were demethylated in EGCs (Figure 3E). Taken together, we discovered that Snrpn, Igf2r, and Kcnq1ot1 ICCs are stably hypomethylated in EGC lines derived from E9.5 PGCs. In contrast, the H19/Igf2 ICC was consistently hypermethylated regardless of the sex of the embryo from which the PGCs were isolated.
ICC Erasure Occurs within the First 4 Days of Culture in 7F
To determine how these unique methylation states at the Snrpn and H19/Igf2 ICCs are achieved, we evaluated DNA methylation using BS-PCR every day for the first 4 days of culture in 7F medium, and we discovered that erasure occurred within the first 4 days at both the Snrpn and H19/Igf2 ICCs (Figure 4A). In contrast, ESCs cultured in 7F did not erase methylation (Figure 4A).
Figure 4.

Ex Vivo Culture of PGCs Results in ICC Erasure within the First 4 Days
(A) The dynamics of cytosine demethylation at the Snrpn and H19/Igf2 ICCs during a 4-day culture of E9.5 PGCs in 7F medium (n = 1 biological series with ten or more independent clones per time point). Methylation erasure was shown in two biological replicates. ESCs cultured under the same conditions do not lose cytosine methylation at the Snrpn ICC. Open circles, unmethylated CGs; closed circles, methylated CGs.
(B) Snrpn and H19/Igf2 ICCs are hypomethylated at day 6 and day 8 of culture (n = 1 biological series with ten or more independent clones per time point).
(C) Real-time PCR for the de novo methyltransferases Dnmt3a, Dnmt3b, and Dnmt3l (n = 2 biological replicates each of E9.5 PGCs, day 4 PGCs cultured in 7F, and EGCs).
To evaluate stability of the hypomethylated state with further culture, we examined PGCs at day 6 and day 8 in 7F medium (Figure 4B). We discovered that the Snrpn ICC remained hypomethylated at day 6 with an increase in CpG methylation at day 8 (Figure 4B). Similarly, the H19/Igf2 ICC was hypomethylated at day 6 of culture, however, by day 8, fully methylated alleles of H19/Igf2 were identified (Figure 4B).
To determine whether re-methylation was associated with changes in expression of de novo methyltransferases, we performed real-time PCR for Dnmt3a, Dnmt3b, and Dnmt3l using E9.5 PGCs as a control. We discovered that, on day 4 of 7F culture, a 9-fold increase in Dnmt3l was observed followed by an increase in Dnmt3b in the EGC line (Figure 4C). Levels of Dnmt3a did not change. Therefore, the increase in DNA methylation at the H19/Igf2 ICC in EGCs is accompanied by an increase in the expression of the de novo methylation machinery beginning with the derepression of Dnmt3l.
PGCs Differentiated from ESCs Share Similarities with E9.5 PGCs and EGCs
Given that culture of E9.5 PGCs in 7F medium leads to sustained hypomethylation of the Snrpn ICC, we reasoned that this could be used as an assay to evaluate Snprn ICC erasure from PGCs differentiated in vitro from ESCs. To test this, we used two different approaches for generating PGCs (Figure 5A). Both methods result in the differentiation of PGCs that are globally hypomethylated while still exhibiting DNA methylation at ICCs, suggesting an identity close to E9.5–E10.5 PGCs in the embryo (Hayashi et al., 2012; Vincent et al., 2013). For the majority of our experiments, we used an ESC line called Blimp1-mVENUS, Stella-CFP (BVSC), which is a double reporter ESC line in which Blimp1 and Stella expression are reported by transgenes driving the expression of cell-membrane-targeted VENUS (mVENUS) and CFP, respectively (Hayashi et al., 2011). All germline differentiation experiments with the BVSC ESC line were performed between passage 21 and passage 25.
Figure 5.

ESC-Derived PGCs Are Transcriptionally Distinct from E9.5 PGCs and EGCs
(A) Schematic representation of the approach used to differentiate PGCs from ESCs.
(B) Phase contrast (left) and BVSC double-positive cells (right) in the EB or aggregate. BVSC double-positive cells are positive for endogenous STELLA by immunofluorescence.
(C) FACS plot for BVSC PGCLCs or iPGCs.
(D) RNA-seq and PCA of PGCLCs (n = 2 biological replicates), iPGCs (n = 2 biological replicates), EGCs (n = 2 biological replicates), and E9.5 Oct4-Gfp-positive PGCs (n = 2 biological replicates).
(E–G) Average gene expression in fragments per kilobase of exon per million (FPKM) of selected genes in each sample shown (n = 2 biological replicates in technical duplicate).
Scale bars in (B) represent 20 μm. See also Figure S1 and Tables S1, S2, and S3.
BVSC ESC lines are traditionally cultured in the naive ground state, which is a basal medium containing an inhibitor of glycogen synthase kinase 3 and an inhibitor of mitogen-activated protein kinase (2 inhibitors or 2i) plus LIF (Ying et al., 2008). ESCs cultured in 2i + LIF are used to generate PGCs in a two-step protocol, with the first step involving a 2-day differentiation into epiblast-like cells (EpiLCs) followed by aggregation as floating culture in the presence of cytokines. This approach generates PGC-like cells (PGCLCs) (Hayashi et al., 2012). The second approach involves culturing BVSC ESC lines in classic ESC culture conditions on MEFs in medium containing serum + LIF. From this state, the BVSC ESCs are differentiated spontaneously as embryoid bodies (EBs) in hanging drops (Vincent et al., 2013). This second approach creates in vitro PGCs (iPGCs).
To confirm PGC identity with in vitro differentiation, we stained EBs or aggregates for the germline marker STELLA (also called DPPA3), and we demonstrated that BVSC-positive cells also are positive for STELLA protein (Figure 5B). To characterize the in-vitro-differentiated germline cells, we performed FACS to isolate the mVENUS/CFP double-positive putative germline population (Figure 5C), and we performed RNA sequencing (RNA-seq) to compare PGCLCs, iPGCs, EGCs, and E9.5 PGCs sorted from the Oct4-IRES-Gfp mouse. Principal component analysis (PCA) revealed that the EB and aggregate method of ESC differentiation generates germline cells (iPGCs or PGCLCs) that are closely related to each other, yet are distinct from EGCs and E9.5 PGCs from the embryo (Figure 5D; Tables S1 and S2). Analysis of the tripartite signature for PGC specification, namely Prdm14, Prdm1 (Blimp1), and Tfap2c, as well as Dppa3 (Stella), revealed no difference relative to E9.5 PGCs sorted from the embryo, consistent with a germline identity (Figures 5E and 5F). In contrast, in-vitro-differentiated PGCs repressed Lats2 and expressed Dnmt3l at levels more typical of EGCs (Figure 5G), with Dnmt3b in iPGCs and PGCLCs intermediate between E9.5 PGCs and EGCs. Furthermore, Dnmt3a and Dnmtl were expressed in all samples, with Uhrf1 mRNA consistently higher in iPGCs, PGCLCs, and EGCs relative to E9.5 PGCs (Figure S1A). This suggests that PGCs differentiated from ESCs share transcriptional properties with both PGCs and EGCs.
To evaluate the global transcriptional relationship in an unbiased way, we performed unsupervised hierarchical clustering of the eight RNA-seq libraries, and we found that the transcriptome of ESC-derived PGCs, regardless of differentiation approach, was more closely related to the transcriptome of EGCs than to E9.5 PGCs (Figure S1B). Gene ontology (GO) analysis of differentially expressed genes among groups revealed categories including protein transport, embryonic development, cell signaling, cell cycle, and transcription (Figure S1C; Table S3). Notably, E9.5 PGCs exhibited a unique enrichment of genes involved in transcription, RNA splicing, and cell-cycle regulation (group 8). In contrast, PGCLCs exhibited enrichment of genes associated with protein catabolic process and RAS signal transduction (groups 3 and 4). In iPGCs, which were overall closely related to PGCLCs, unique categories could still be identified. Specifically iPGCs had elevated expression of embryonic development genes (group 2). Taken together, our RNA-seq analysis indicates that iPGCs and PGCLCs share a common transcriptional program with E9.5 PGCs sorted from the embryo. However, using unbiased clustering, we discovered an overall closer relationship with EGCs than with E9.5 PGCs, including aberrant upregulation of RNAs involved in de novo and maintenance DNA methylation. Given these properties, we hypothesize that methylation reprogramming in PGCs derived from ESCs may be different from E9.5 PGCs sorted from the embryo.
To address this, we assayed DNA methylation at the Snprn and H19/Igf2 ICCs in undifferentiated ESCs and germline cells at day 6 of differentiation (Figures 6A and 6B). Our results showed that the Snrpn ICC had on average 45% methylation in the undifferentiated state and 49% methylation in the iPGCs and PGCLCs (Figure 6B). In contrast, we discovered that the H19/Igf2 ICC was abnormally hypermethylated in undifferentiated ESCs, regardless of whether they were cultured in 2i + LIF or serum + LIF (Figure 6A).
Figure 6.

ESC-Derived PGCs Exhibit Unstable Imprint Erasure
(A) Snrpn and H19/Igf2 ICC methylation in undifferentiated BVSC ESCs cultured in serum + LIF on MEFs or in 2i + LIF (n = 1 biological series with nine or more independent clones per time point).
(B) Snrpn and H19/Igf2 ICC methylation in BVSC-positive iPGCs or PGCLCs (n = 1 biological series with ≥12 independent clones per time point).
(C) Average percentage CpG methylation at the Snrpn ICC in EGC lines derived from iPGCs, PGCLCs, or PGCs (n = 3–4 biological replicates per group).
(D) Snrpn ICC methylation during the first 4 days of 7F culture starting with iPGCs or PGCLCs (n = 1 biological series with ten or more independent clones per time point).
(E) Average percentage CpG methylation at the H19/Igf2 ICC in EGC lines derived from iPGCs, PGCLCs, or PGCs (n = 3–4 biological replicates per group).
(F) H19/Igf2 ICC methylation during the first 4 days of 7F culture starting with iPGCs or PGCLCs (n = 1 biological series with eight or more independent clones per time point). Open circles, unmethylated CGs; closed circles, methylated CGs.
Significance among three groups in (C) and (E) was calculated using a one-way ANOVA followed by Tukey’s multiple comparison test. Note that the methylation percentages for EGCs derived from E9.5 PGCs in (C) and (E) are the same as those in Figure 3D. See also Figure S2.
Given the Snrpn ICC methylation pattern was similar to PGCs from the embryo, we next evaluated whether the Snrpn ICC was hypomethylated in EGC lines derived from ESC-derived PGCs. Our results showed that EGC lines derived from PGCLCs were hypomethylated at the Snrpn ICC (Figure 6C). In contrast EGC lines derived from iPGCs exhibited on average 50% methylation. This suggests that iPGCs are either not capable of erasing methylation from the Snrpn ICC or that the erased state is not stable (Figure 6C). To address this, we examined the Snrpn ICC in iPGCs and PGCLCs during the first 4 days of culture in 7F medium (Figure 6D). Our results showed that the Snprn ICC underwent demethylation within the first 4 days of 7F culture when starting from either iPGCS or PGCLCs (Figure 6D). To confirm this result, we evaluated additional ESC lines (called R1 and V6.5), and we isolated iPGCs at day 6 of differentiation using the SSEA1/cKIThigh sorting approach in Vincent et al. (2011; Figure S2). These results showed that erasure of CpG methylation from the Snrpn ICC is a characteristic feature of in vitro PGC differentiation. However, unlike PGCs from the embryo, which remain stably hypomethylated at this ICC, the PGCs differentiated from ESCs regained CpG methylation within 24 hr of the erasure point in all cases. The reason why the PGCLCs subsequently lose DNA methylation again at the Snrpn ICC between 7F culture and EGC derivation is unclear.
Starting germ cell differentiation with ESCs containing an abnormally hypermethylated H19/Igf2 ICC leads to a complex DNA methylation phenotype. In EGC lines derived from iPGCs, the methylation levels remain high; however, we noted a significant loss of methylation at the H19 ICC in the EGC lines derived from PGCLCs (Figure 6E). Furthermore, in the first 4 days of 7F medium, no obvious methylation erasure occurred (Figure 6F). Therefore, the methylation loss observed in EGCs derived from PGCLCs may correspond to erosion of the abnormally hypermethylated state at H19/Igf2 ICC, and this also may imply erosion of DNA methylation at the Snrpn ICC in EGC lines derived from PGCLCs.
Discussion
In this study we have addressed a long-standing question in the field regarding methylation erasure at ICCs during reversion of PGCs to EGCs in vitro. We discovered that initiating reprogramming from E9.5 PGCs results in erasure of cytosine methylation from ICCs within the first 4 days of in vitro culture, therefore rejecting the notion that established EGC lines represent the epigenetic state of PGCs from which they were derived. Furthermore, our data suggest that the first 4 days of PGC culture resemble the dynamics of ICC methylation erasure normally observed in the mouse embryo (Hackett et al., 2013; Yamaguchi et al., 2012, 2013). Therefore, we propose that the 7F PGC culture system is an important new model for understanding mechanisms of locus-specific cytosine demethylation in the germline. In particular in future studies, this model could be used to address the locus-specific removal of cytosine methylation downstream of oxidation (Hackett et al., 2013; Yamaguchi et al., 2012, 2013), activation-induced cytidine deaminase (Popp et al., 2010), or base excision repair (Ciccarone et al., 2012; Kawasaki et al., 2014), the outcomes of which will be important to stem cell biology and reprogramming in general.
All PGCs differentiated from ESCs in our study, regardless of differentiation approach or sorting strategy, were capable of implementing ICC erasure at the Snprn ICC. However, unlike E9.5 PGCs from the embryo, the hypomethylated state at this ICC was unstable, and in every case re-methylation was initiated within 24 hr. This cannot be explained by the natural course of germline development, as wild-type XY germline cells in vivo never re-methylate the Snprn ICC following erasure, and all ESC lines used in this study were XY. Our hypothesis is that germline cells differentiated from mouse ESCs in vitro exhibit a lower barrier to EGC reversion and this is accompanied by abnormal expression of genes encoding proteins required for DNA methylation. The RNA-seq analysis supports this hypothesis given that both iPGCs and PGCLCs enter the 7F medium experiment with a transcriptional program that is more closely related to EGCs. However, we cannot rule out the possibility of heterogeneity in the EGC derivation system, leading to selective growth of cells with particular methylated signatures. One way to address this in the future would be to perform single-cell methylation sequencing.
Correct erasure and removal of methylation from ICCs in the germline needs to be seriously considered if the entire process of PGC differentiation into gametes is to be successfully attempted in vitro. Male and female PGCLCs have been differentiated successfully into terminally differentiated germ cells capable of fertilization, but only after transplantation of the PGCLCs into a gonadal niche (Hayashi et al., 2011, 2012). The differentiation of functional germline cells using this approach is a remarkable achievement and one of the few in-vitro-differentiated cell types proven successful in functional assays. However, not all PGCLCs are capable of differentiation within the niche after transplantation, with many germ cells dying for unknown reasons (Hayashi et al., 2011, 2012). Furthermore, offspring born after fertilizing PGCLC-derived male germ cells are not always healthy, with some mice dying prematurely with head and neck tumors (Hayashi et al., 2011). In the case of PGCLC-derived oocytes, a high proportion do not extrude the second polar body upon fertilization, leading to abnormal 3-pronuclear embryos (Hayashi et al., 2012). Therefore, there is still much to be understood about the process of differentiating high-quality gametes in vitro and in vivo, and our study would suggest that methylation erasure at ICCs is one of the vulnerable developmental transitions prone to error.
In future studies it will be important to determine whether gonadal niche cells protect in-vitro-differentiated germline cells from aberrant acquisition of DNA methylation and to suppress the potential for EGC reversion, which could lead to germ cell tumors following transplantation. Finally, our data highlight the importance of initiating PGC differentiation from ESCs with a normal epigenome. Abnormal hypermethylation of the H19/Igf2 ICC has been reported in Rhesus macaque ESC lines as well as human ESCs (Mitalipov et al., 2007; Park et al., 2009). Our work demonstrates that abnormal hypermethylation of the H19/Igf2 ICC in undifferentiated ESCs is not erased in the ESC-to-PGC differentiation model, and failure to correctly erase methylation in the germline will pose a significant problem to the generation of high-quality gametes in the future.
Experimental Procedures
Animals
All animal experiments were performed following guidelines from the Care and Use of Laboratory Animals (Animal Welfare Assurance A3196-01). CD1 females were purchased from Charles River Laboratories, and the Oct4-IRES-Gfp knockin mice were a kind gift from Konrad Hochedlinger (Lengner et al., 2007). Male SCID mice for teratoma experiments were obtained from the University of California, Los Angeles (UCLA) Humanized Mouse Core Laboratory.
ESC Lines
The R8 Blimp1-mVENUS and Stella-CFP (BVSC) ESC line was a kind gift from Mitinori Saitou of Kyoto University and was first published in Hayashi et al. (2011). All experiments with the R8 BVSC ESC lines were conducted between passage 21 and passage 25. The R1 B5/EGFP (see JAX FVB.Cg-Tg [CAG-EGFP] B5Nagy/J) ESC line was kindly provided by Luisa Iruela-Arispe at UCLA, and this experiment was conducted at passage 22. The V6.5 ESC line was a kind gift from Robert Blelloch at the University of California, San Francisco, and this cell line was evaluated from passage 28 to passage 30. All ESC lines were genotyped as XY.
FACS
Time-mated embryos were collected at E9.5 in 10% FBS on ice, and dorsal regions were dissociated with 0.05% trypsin for 5–7min at 37°C. The cell suspension was resuspended in 1% BSA, strained through a 40-μM cell strainer (BD Falcon), and 1 μg/ml DAPI was added as the viability dye. GFP-positive PGCs were sorted using a FacsARIA (Becton Dickinson) into DMEM high glucose supplemented with 30% FBS. The compensation controls included unstained cells as well as single-color controls for GFP and DAPI.
For the majority of experiments, embryos within litters were pooled prior to FACS and approximately 1,000–1,500 PGCs were plated onto one PET membrane. The calculated yield of PGCs per embryo at E9.5 was estimated to be between 150 and 250 PGCs. Some experiments were performed using PGCs sorted from single embryos without pooling in order to separate PGCs based on sex of the embryo. Sexing of embryos was performed on DNA extracted from heads using PCR with the following primer set: SMCX-1, 5′-CCGCTGCCAAATTCTTTGG-3′; and SMCY-1, 5-TGAAGCTTTTGGCTTTGAG-3′. In males, two bands are present at around 300 bp, whereas in females only one band (the upper band) is detected.
FACS to isolate cultured cells (EGCs and ESC-differentiated PGCs) for molecular analysis was performed on single-cell suspensions in PBS containing 1% BSA; 7-AAD was used to exclude dead cells. When needed, primary and secondary antibody incubations were performed on ice for 10–20 min. Specifically, ScKhigh iPGCs were stained for c-KIT (553352, BD Biosciences) and for SSEA1 (MC-480, Developmental Studies Hybridoma Bank [DSHB]) as previously described (Vincent et al., 2013). Secondary antibodies were anti-rat-PE for cKIT (112-116-143, Jackson ImmunoResearch) and anti-mouse-Cy5 (115-495-044, Jackson ImmunoResearch). Compensation controls included unstained or secondary antibody-only controls and single-color controls for 7AAD, PE, and Cy5. Oct4-Ires-Gfp EGCs were stained using the anti-SSEA1 (MC-480, DSHB) antibody with an anti-mouse IgM-Cy5 secondary antibody (115-175-044, Jackson ImmunoResearch). Cells were sorted based on Cy5/GFP double-positive signals. Compensation controls included unstained and secondary antibody-only controls and single-color controls for GFP and Cy5. PGCLC and BVSC iPGCs were sorted based on mVenus and CFP fluorescence. The compensation controls included unstained and single-color 7AAD, GFP (for Venus), and Pacific Blue (for CFP). Data were analyzed using FlowJo software (Tree Star).
PGC Culture in 7F Medium
Sorted PGCs were cultured in 7F medium, which was based on the formulation of Farini et al. (2005) without the addition of retinoic acid. Therefore, 7F medium contains the following: 15% FBS (Hyclone), DMEM high glucose (Gibco), 1× non-essential amino acids (Gibco), 0.1 mM 2-mercaptoethanol (Gibco), 0.25 mM pyruvate (Gibco 100 mM), 1× PSG (100 U/ml penicillin, 100 μg/ml streptomycin, 292 μg/ml L-glutamine [Gibco]), 50 ng/ml SCF (PeproTech), 10 ng/ml bFGF (Biological Resources Branch of the Frederick National Laboratory for Cancer Research), 10 ng/ml SDF1 (R&D Systems), 25 ng/ml human BMP4 (R&D Systems), 500 U/ml LIF (Millipore), 5 μM forskolin (Sigma), and 1 mg/ml N-acetyl-L-cysteine (Sigma). Cells were plated directly on 0.4-μM PET membranes (BD Falcon) in 24-well plates and cultured at 37°C with 5% CO2 with daily medium changes. For some downstream experiments, cultured PGCs were detached from the membrane with 0.05% trypsin for 5 min at 37°C.
ESC and EGC Culture and ESC Differentiation
ESC and EGC growth in serum + LIF on MEFs and EB differentiation were performed as described previously (Vincent et al., 2011). Maintenance of BVSC ESCs in 2i + LIF on laminin followed by EpiLC induction and PGCLC generation in aggregates were performed as described previously (Hayashi et al., 2011).
BS Sequencing
BS treatment followed by PCR and sequencing of clones were performed as described previously for Snprn (Hargan-Calvopina et al., 2015), H19/Igf2 (Kagiwada et al., 2013), Igf2r (Lucifero et al., 2002), and Kcnq1ot1 (Sharif et al., 2007).
RNA-Seq
Total RNA was extracted from E9.5 endogenous PGCs, iPGCs, PGCLCs, and EGCs using QIAGEN RNeasy Micro Kit (QIAGEN) and eluted in 8 μl of Rnase-free water. Two biological replicate samples were used with the following start cell numbers: E9.5 PGCs (∼250 cells), iPGCs (1,500 cells), PGCLCs (300–500 cells), and EGCs (two independent lines, EGC4 and EGC7, each at 500 cells). RNA was amplified and converted to cDNA using the Ovation RNA-Seq System V2 (NuGEN). cDNA was diluted to 130 μl using TE buffer (Tris [pH 8.0] 10 mM, 15568-025 and EDTA 0.1 mM, 15575, both from Invitrogen), transferred to Snap-Cap MicroTUBEs with AFA fiber (520015, Covaris), and sonicated to DNA fragments within the 200-bp range using a Covaris S2 sonicator according to the manufacturer’s instructions (duty cycle 10%, intensity 5, cycles per burst 200, and time 180 s). Subsequently, libraries were generated using the Encore Rapid Library System according to the manufacturer’s instructions. Library concentration was estimated using a Kapa library quantification kit (4827) according to the manufacturer’s instructions on a ViiA 7 Real-time PCR System (Invitrogen). Libraries were run using 50-bp single-end reads on the HiSeq 2500 System (Illumina). Eight libraries were multiplexed and run in two lanes. ERCC RNA Spike-In Mix (4456740, Invitrogen) was used according to the manufacturer’s instructions.
RNA-Seq Data Analysis
Reads with low quality and reads containing sequencing adapters were first filtered out before mapping raw reads (single end, 50 bp in length) to the Mus musculus reference genome (GRCm38/mm10) with the gapped aligner Tophat 2 (Kim et al., 2013), allowing up to two mismatches. Only uniquely aligned reads were collected. In total for all libraries sequenced, on average 13.9 million reads for each sample were mapped uniquely (corresponding to an overall mappability of 70%) and used for further analysis.
External RNA Controls Consortium (ERCC) standards were calculated to have an average observed and expected correlation of R = 0.93. Transcript expression levels were quantified in FPKM (fragments per kilobase of exon per million reads mapped) units using Cufflinks (version 2.2.1). The FPKM values of repeats were calculated according to coding transcripts. We filtered out genes with FPKM < 0.5 in all groups. The multiple testing errors were corrected by the false discovery rate (FDR). In addition to the FDR of < 0.05, we considered differentially expressed genes as having >2-fold difference. The heatmap in Figure S1 was generated (p ≤ 0.01, FDR < 0.05, fold change > 2) using the default settings with the function “heatmap.2” in the gplots package of R. FPKM values are centered and scaled by subtracting the mean of the row from every FPKM value and then dividing the resulting FPKM values by the SD of the row.
Unsupervised hierarchical clustering was performed to examine the correlation and linkage of samples using R. In the process of clustering, we employed “complete” as the agglomeration method and the Pearson product-moment correlation coefficient as the distance metric. The PCA was performed on normalized read counts of all samples to compare gene expression under different developmental stages using the “princomp” function in R. In this analysis, we selected 1,000 top-ranked genes based on their variations across all samples using the function “rowVars” in R matrixStats package. PCA revealed that our samples were clearly distinguishable by both the first, second, and third principal component. GO term analysis was performed with the Database for Annotation, Visualization, and Integrated Discovery (DAVID) (Huang da et al., 2009).
Immunofluorescence and Microscopy
Unless otherwise indicated, 4% paraformaldehyde (PFA) in PBS was used as a fixative, 10% FBS/0.05% Tween20 was used as a blocking agent, and 0.2% Tween20 was used for washing. Primary antibody incubations were carried out overnight at 4°C. Secondary antibody incubations were for 1 hr at room temperature. After washing, samples were imaged in Prolong Antifade Reagent with DAPI (Invitrogen). For E9.5 embryos and adult testes, whole-mount immunofluorescence was performed after fixing in 4% PFA. Primary antibodies were incubated overnight at 4°C using anti-OCT4 (1:100; sc8628, Santa Cruz Biotechnology) and anti-mouse VASA homolog (1:100; ab13840, Abcam); secondary antibodies also were stained in block solution overnight at 4°C. For MVH staining of cultured E9.5 PGCs, cells were harvested from the membrane and attached to a poly-L-lysine-coated coverslips before fixing for 15 min in 4% PFA at room temperature. Permeabilization was performed with 0.5% Triton X-100, followed by an overnight incubation in anti-MVH (1:100; ab13840, Abcam) or rabbit IgG. For iPGC and PGCLC aggregates, whole-mount immunofluorescence was performed after fixing in 4% PFA followed by permeabilizing in 1% Triton X-100 in PBS plus 2 mg/ml Collagenase type IV. Primary antibody anti-STELLA (1:100) (sc67249, Santa Cruz) was incubated overnight at 4°C and secondary antibody Cy5 anti-rabbit (1:200) was stained in 0.3% Triton X-100 in PBS for 2 hr at room temperature. All cells and aggregates were imaged with an LSM 780 confocal microscope (Zeiss) using ZEN 2011 software.
Teratoma Assays
Teratomas were generated in the testis as previously described (Conway et al., 2009; Lindgren et al., 2011). Briefly, SCID mice were injected with 1 × 10⁶ EGCs re-suspended in 50 μl BD Matrigel (BD Biosciences) per testis. The testes were removed 4 weeks later, processed in paraffin for sectioning, and stained with H&E for histological analysis.
Real-Time PCR
PGCs and iPGCs were sorted into RLT buffer (QIAGEN) and their RNA isolated using the RNeasy Micro Kit (QIAGEN). EGCs were sorted using SSEA1/GFP prior to RNA isolation. Reverse transcription was performed with Superscript RT II (Invitrogen) and the following Taqman gene expression assays were used for real-time PCR: Dnmt3a, Dnmt3b, and Dnmt3l. Ct values were normalized to Gapdh and expressed as a fold change relative to E9.5 PGC.
Statistics
For comparisons among three groups, one-way ANOVA was performed followed by Tukey’s multiple comparison test. Significance was accepted at p < 0.05. All error bars shown are mean and SEM.
Author Contributions
M.O.-E. designed and performed the experiments and wrote the manuscript. Z.L., K.N., L.H., J.H.-C., S.A.L., P.J., and J.Y. designed and performed the experiments. A.T.C. designed and oversaw all experiments, maintained all University compliance and reporting requirements, wrote the manuscript, and obtained the research funding.
Acknowledgments
The authors thank the UCLA BSCRC flow cytometry core for flow and FACS assistance and the BSCRC High Throughput Sequencing Core for Sequencing. The authors also thank Dr. Rachel Kim for help with the teratoma and picking EGC colonies as well as Dr. Silvia Diaz Perez for help with immunofluorescence. The BVSC ESC line was a kind gift from Dr. Mitinori Saitou (Kyoto University). This work was supported by an R01 grant from the NIH (NIH/NICHD R01HD058047) awarded to A.T.C. and a Research Award from the Eli and Edythe Broad Center of Regenerative Medicine and Stem Cell Research. M.O.-E. was supported by a minority supplement to R01HD058047.
Published: August 13, 2015
Footnotes
This is an open access article under the CC BY-NC-ND license (http://creativecommons.org/licenses/by-nc-nd/4.0/).
Supplemental Information includes two figures and three tables and can be found with this article online at http://dx.doi.org/10.1016/j.stemcr.2015.07.006.
Accession Numbers
The accession number for the sequencing data reported in this paper is GEO: GSE69354.
Supplemental Information
Pairwise differentially expressed genes among E9.5 PGCs, EGCs, PGCLCs, and iPGCs are listed.
Top 100 (50 up and 50 down) pairwise differentially expressed genes among E9.5 PGCs, EGCs, PGCLCs, and iPGCs are listed.
Top 20 categories of GO analysis for pairwise differentially expressed genes among E9.5 PGCs, EGCs, PGCLCs, and iPGCs are listed.
References
- Ciccarone F., Klinger F.G., Catizone A., Calabrese R., Zampieri M., Bacalini M.G., De Felici M., Caiafa P. Poly(ADP-ribosyl)ation acts in the DNA demethylation of mouse primordial germ cells also with DNA damage-independent roles. PLoS ONE. 2012;7:e46927. doi: 10.1371/journal.pone.0046927. [DOI] [PMC free article] [PubMed] [Google Scholar]
- Conway A.E., Lindgren A., Galic Z., Pyle A.D., Wu H., Zack J.A., Pelligrini M., Teitell M.A., Clark A.T. A self-renewal program controls the expansion of genetically unstable cancer stem cells in pluripotent stem cell-derived tumors. Stem Cells. 2009;27:18–28. doi: 10.1634/stemcells.2008-0529. [DOI] [PMC free article] [PubMed] [Google Scholar]
- Farini D., Scaldaferri M.L., Iona S., La Sala G., De Felici M. Growth factors sustain primordial germ cell survival, proliferation and entering into meiosis in the absence of somatic cells. Dev. Biol. 2005;285:49–56. doi: 10.1016/j.ydbio.2005.06.036. [DOI] [PubMed] [Google Scholar]
- Guibert S., Forné T., Weber M. Global profiling of DNA methylation erasure in mouse primordial germ cells. Genome Res. 2012;22:633–641. doi: 10.1101/gr.130997.111. [DOI] [PMC free article] [PubMed] [Google Scholar]
- Hackett J.A., Sengupta R., Zylicz J.J., Murakami K., Lee C., Down T.A., Surani M.A. Germline DNA demethylation dynamics and imprint erasure through 5-hydroxymethylcytosine. Science. 2013;339:448–452. doi: 10.1126/science.1229277. [DOI] [PMC free article] [PubMed] [Google Scholar]
- Hajkova P., Erhardt S., Lane N., Haaf T., El-Maarri O., Reik W., Walter J., Surani M.A. Epigenetic reprogramming in mouse primordial germ cells. Mech. Dev. 2002;117:15–23. doi: 10.1016/s0925-4773(02)00181-8. [DOI] [PubMed] [Google Scholar]
- Hargan-Calvopina J., Cook H., Vincent J.J., Nee K., Clark A.T. The aorta-gonad-mesonephros organ culture recapitulates 5hmC reorganization and replication-dependent and independent loss of DNA methylation in the germline. Stem Cells Dev. 2015;24:1536–1545. doi: 10.1089/scd.2014.0410. [DOI] [PMC free article] [PubMed] [Google Scholar]
- Hayashi K., Ohta H., Kurimoto K., Aramaki S., Saitou M. Reconstitution of the mouse germ cell specification pathway in culture by pluripotent stem cells. Cell. 2011;146:519–532. doi: 10.1016/j.cell.2011.06.052. [DOI] [PubMed] [Google Scholar]
- Hayashi K., Ogushi S., Kurimoto K., Shimamoto S., Ohta H., Saitou M. Offspring from oocytes derived from in vitro primordial germ cell-like cells in mice. Science. 2012;338:971–975. doi: 10.1126/science.1226889. [DOI] [PubMed] [Google Scholar]
- Huang da W., Sherman B.T., Lempicki R.A. Systematic and integrative analysis of large gene lists using DAVID bioinformatics resources. Nat. Protoc. 2009;4:44–57. doi: 10.1038/nprot.2008.211. [DOI] [PubMed] [Google Scholar]
- Kagiwada S., Kurimoto K., Hirota T., Yamaji M., Saitou M. Replication-coupled passive DNA demethylation for the erasure of genome imprints in mice. EMBO J. 2013;32:340–353. doi: 10.1038/emboj.2012.331. [DOI] [PMC free article] [PubMed] [Google Scholar]
- Kawasaki Y., Lee J., Matsuzawa A., Kohda T., Kaneko-Ishino T., Ishino F. Active DNA demethylation is required for complete imprint erasure in primordial germ cells. Sci. Rep. 2014;4:3658. doi: 10.1038/srep03658. [DOI] [PMC free article] [PubMed] [Google Scholar]
- Kim D., Pertea G., Trapnell C., Pimentel H., Kelley R., Salzberg S.L. TopHat2: accurate alignment of transcriptomes in the presence of insertions, deletions and gene fusions. Genome Biol. 2013;14:R36. doi: 10.1186/gb-2013-14-4-r36. [DOI] [PMC free article] [PubMed] [Google Scholar]
- Labosky P.A., Barlow D.P., Hogan B.L. Mouse embryonic germ (EG) cell lines: transmission through the germline and differences in the methylation imprint of insulin-like growth factor 2 receptor (Igf2r) gene compared with embryonic stem (ES) cell lines. Development. 1994;120:3197–3204. doi: 10.1242/dev.120.11.3197. [DOI] [PubMed] [Google Scholar]
- Leitch H.G., McEwen K.R., Turp A., Encheva V., Carroll T., Grabole N., Mansfield W., Nashun B., Knezovich J.G., Smith A. Naive pluripotency is associated with global DNA hypomethylation. Nat. Struct. Mol. Biol. 2013;20:311–316. doi: 10.1038/nsmb.2510. [DOI] [PMC free article] [PubMed] [Google Scholar]
- Leitch H.G., Nichols J., Humphreys P., Mulas C., Martello G., Lee C., Jones K., Surani M.A., Smith A. Rebuilding pluripotency from primordial germ cells. Stem Cell Reports. 2013;1:66–78. doi: 10.1016/j.stemcr.2013.03.004. [DOI] [PMC free article] [PubMed] [Google Scholar]
- Leitch H.G., Tang W.W., Surani M.A. Primordial germ-cell development and epigenetic reprogramming in mammals. Curr. Top. Dev. Biol. 2013;104:149–187. doi: 10.1016/B978-0-12-416027-9.00005-X. [DOI] [PubMed] [Google Scholar]
- Lengner C.J., Camargo F.D., Hochedlinger K., Welstead G.G., Zaidi S., Gokhale S., Scholer H.R., Tomilin A., Jaenisch R. Oct4 expression is not required for mouse somatic stem cell self-renewal. Cell Stem Cell. 2007;1:403–415. doi: 10.1016/j.stem.2007.07.020. [DOI] [PMC free article] [PubMed] [Google Scholar]
- Lindgren A.G., Natsuhara K., Tian E., Vincent J.J., Li X., Jiao J., Wu H., Banerjee U., Clark A.T. Loss of Pten causes tumor initiation following differentiation of murine pluripotent stem cells due to failed repression of Nanog. PLoS ONE. 2011;6:e16478. doi: 10.1371/journal.pone.0016478. [DOI] [PMC free article] [PubMed] [Google Scholar]
- Lucifero D., Mertineit C., Clarke H.J., Bestor T.H., Trasler J.M. Methylation dynamics of imprinted genes in mouse germ cells. Genomics. 2002;79:530–538. doi: 10.1006/geno.2002.6732. [DOI] [PubMed] [Google Scholar]
- Matsui Y., Zsebo K., Hogan B.L. Derivation of pluripotential embryonic stem cells from murine primordial germ cells in culture. Cell. 1992;70:841–847. doi: 10.1016/0092-8674(92)90317-6. [DOI] [PubMed] [Google Scholar]
- McLaren A., Durcova-Hills G. Germ cells and pluripotent stem cells in the mouse. Reprod. Fertil. Dev. 2001;13:661–664. doi: 10.1071/rd01080. [DOI] [PubMed] [Google Scholar]
- Mitalipov S., Clepper L., Sritanaudomchai H., Fujimoto A., Wolf D. Methylation status of imprinting centers for H19/IGF2 and SNURF/SNRPN in primate embryonic stem cells. Stem Cells. 2007;25:581–588. doi: 10.1634/stemcells.2006-0120. [DOI] [PubMed] [Google Scholar]
- Park T.S., Galic Z., Conway A.E., Lindgren A., van Handel B.J., Magnusson M., Richter L., Teitell M.A., Mikkola H.K., Lowry W.E. Derivation of primordial germ cells from human embryonic and induced pluripotent stem cells is significantly improved by coculture with human fetal gonadal cells. Stem Cells. 2009;27:783–795. doi: 10.1002/stem.13. [DOI] [PMC free article] [PubMed] [Google Scholar]
- Popp C., Dean W., Feng S., Cokus S.J., Andrews S., Pellegrini M., Jacobsen S.E., Reik W. Genome-wide erasure of DNA methylation in mouse primordial germ cells is affected by AID deficiency. Nature. 2010;463:1101–1105. doi: 10.1038/nature08829. [DOI] [PMC free article] [PubMed] [Google Scholar]
- Resnick J.L., Bixler L.S., Cheng L., Donovan P.J. Long-term proliferation of mouse primordial germ cells in culture. Nature. 1992;359:550–551. doi: 10.1038/359550a0. [DOI] [PubMed] [Google Scholar]
- Seisenberger S., Andrews S., Krueger F., Arand J., Walter J., Santos F., Popp C., Thienpont B., Dean W., Reik W. The dynamics of genome-wide DNA methylation reprogramming in mouse primordial germ cells. Mol. Cell. 2012;48:849–862. doi: 10.1016/j.molcel.2012.11.001. [DOI] [PMC free article] [PubMed] [Google Scholar]
- Sharif J., Muto M., Takebayashi S., Suetake I., Iwamatsu A., Endo T.A., Shinga J., Mizutani-Koseki Y., Toyoda T., Okamura K. The SRA protein Np95 mediates epigenetic inheritance by recruiting Dnmt1 to methylated DNA. Nature. 2007;450:908–912. doi: 10.1038/nature06397. [DOI] [PubMed] [Google Scholar]
- Sharova L.V., Sharov A.A., Piao Y., Shaik N., Sullivan T., Stewart C.L., Hogan B.L., Ko M.S. Global gene expression profiling reveals similarities and differences among mouse pluripotent stem cells of different origins and strains. Dev. Biol. 2007;307:446–459. doi: 10.1016/j.ydbio.2007.05.004. [DOI] [PMC free article] [PubMed] [Google Scholar]
- Shim S.W., Han D.W., Yang J.H., Lee B.Y., Kim S.B., Shim H., Lee H.T. Derivation of embryonic germ cells from post migratory primordial germ cells, and methylation analysis of their imprinted genes by bisulfite genomic sequencing. Mol. Cells. 2008;25:358–367. [PubMed] [Google Scholar]
- Shovlin T.C., Durcova-Hills G., Surani A., McLaren A. Heterogeneity in imprinted methylation patterns of pluripotent embryonic germ cells derived from pre-migratory mouse germ cells. Dev. Biol. 2008;313:674–681. doi: 10.1016/j.ydbio.2007.11.007. [DOI] [PubMed] [Google Scholar]
- Stewart C.L., Gadi I., Bhatt H. Stem cells from primordial germ cells can reenter the germ line. Dev. Biol. 1994;161:626–628. doi: 10.1006/dbio.1994.1058. [DOI] [PubMed] [Google Scholar]
- Tada T., Tada M., Hilton K., Barton S.C., Sado T., Takagi N., Surani M.A. Epigenotype switching of imprintable loci in embryonic germ cells. Dev. Genes Evol. 1998;207:551–561. doi: 10.1007/s004270050146. [DOI] [PubMed] [Google Scholar]
- Takahashi K., Yamanaka S. Induction of pluripotent stem cells from mouse embryonic and adult fibroblast cultures by defined factors. Cell. 2006;126:663–676. doi: 10.1016/j.cell.2006.07.024. [DOI] [PubMed] [Google Scholar]
- Toyooka Y., Tsunekawa N., Takahashi Y., Matsui Y., Satoh M., Noce T. Expression and intracellular localization of mouse Vasa-homologue protein during germ cell development. Mech. Dev. 2000;93:139–149. doi: 10.1016/s0925-4773(00)00283-5. [DOI] [PubMed] [Google Scholar]
- Vincent J.J., Li Z., Lee S.A., Liu X., Etter M.O., Diaz-Perez S.V., Taylor S.K., Gkountela S., Lindgren A.G., Clark A.T. Single cell analysis facilitates staging of Blimp1-dependent primordial germ cells derived from mouse embryonic stem cells. PLoS ONE. 2011;6:e28960. doi: 10.1371/journal.pone.0028960. [DOI] [PMC free article] [PubMed] [Google Scholar]
- Vincent J.J., Huang Y., Chen P.Y., Feng S., Calvopiña J.H., Nee K., Lee S.A., Le T., Yoon A.J., Faull K. Stage-specific roles for tet1 and tet2 in DNA demethylation in primordial germ cells. Cell Stem Cell. 2013;12:470–478. doi: 10.1016/j.stem.2013.01.016. [DOI] [PMC free article] [PubMed] [Google Scholar]
- Yamaguchi S., Hong K., Liu R., Shen L., Inoue A., Diep D., Zhang K., Zhang Y. Tet1 controls meiosis by regulating meiotic gene expression. Nature. 2012;492:443–447. doi: 10.1038/nature11709. [DOI] [PMC free article] [PubMed] [Google Scholar]
- Yamaguchi S., Shen L., Liu Y., Sendler D., Zhang Y. Role of Tet1 in erasure of genomic imprinting. Nature. 2013;504:460–464. doi: 10.1038/nature12805. [DOI] [PMC free article] [PubMed] [Google Scholar]
- Ying Q.L., Wray J., Nichols J., Batlle-Morera L., Doble B., Woodgett J., Cohen P., Smith A. The ground state of embryonic stem cell self-renewal. Nature. 2008;453:519–523. doi: 10.1038/nature06968. [DOI] [PMC free article] [PubMed] [Google Scholar]
Associated Data
This section collects any data citations, data availability statements, or supplementary materials included in this article.
Supplementary Materials
Pairwise differentially expressed genes among E9.5 PGCs, EGCs, PGCLCs, and iPGCs are listed.
Top 100 (50 up and 50 down) pairwise differentially expressed genes among E9.5 PGCs, EGCs, PGCLCs, and iPGCs are listed.
Top 20 categories of GO analysis for pairwise differentially expressed genes among E9.5 PGCs, EGCs, PGCLCs, and iPGCs are listed.