Abstract
We report the design and synthesis of self-assembling dual-modality molecular probes containing both a fluorophore for optical imaging and a metal ion chelator for imaging with MRI or radionuclide methods. These molecular probes can spontaneously associate into spherical nanoparticles under physiological conditions. We demonstrate the use of these supramolecular nanoprobes for live-cell optical imaging, as well as their potential use as MRI contrast agents after complexation with gadolinium. Our results suggest that self-assembly into supramolecular nanoprobes presents an effective means to enhance and tune the relaxivities of molecular probes.
Self-assembly of a simple molecular building unit can yield complex supramolecular architectures with new functions that the individual unit does not carry.1 This strategy has been used to create a plethora of interesting nanoscopic and microscopic morphologies from block copolymers,2–4 small molecular amphiphiles,1,5,6 peptides,7–12 proteins,13 and DNA.14,15 The specific control over the size, shape, surface chemistry, and degradation kinetics provides supramolecular nanostructures with the unique capacity for use as carriers to deliver therapeutic or diagnostic agents.16–19 In this carrier–cargo approach, the self-assembling units are typically biocompatible and biodegradable but biologically inert molecules that do not possess any function beyond ensuring the specific delivery and controlled release of the functional units. On the other hand, the functional molecules to be delivered, e.g. drugs, or molecular probes, are not expected to contribute to the self-assembly process. Here we report the use of dual-modality molecular imaging probes to directly create self-assembling supramolecular nanoprobes with the capacity for both optical and magnetic resonance (MR) imaging.
Nanoparticles that have been used to image cancers have several advantages over individual molecular probes.20–24 First, nanoparticles can be accumulated at tumor sites through the enhanced permeability and retention (EPR) effect,25,49 which consequently increases the signal-to-noise ratio.26 Second, nanoparticles can generate signal amplification and enhance the sensitivity.27 Third, nanoparticles can be a platform for multiple functions, with components either incorporated within or through surface modification, which could enable superior pharmacokinetics and/or active targeting.28,29 Here we report the design and synthesis of supramolecular dual-modality nanoprobes by self-assembly of amphiphilic building blocks containing a fluorophore and a metal ion chelator. In the context of molecular imaging, each imaging modality offers its own advantages and disadvantages in terms of sensitivity, spatial resolution and depth of tissue penetration.30,31 Optical imaging with the fluorescence aspect of the probe has high sensitivity, while MR is widely used clinically for detection and therapeutic monitoring of cancer.32 Multi-modality probes could provide complementary information, enabling both pre-operative staging and real-time, image-guided surgery for the management of cancer.33–35 In this work, we demonstrated live-cell fluorescence imaging of self-assembled nanoprobes in KB-3-1 human cervical cancer cells and assessed their feasibility to serve as contrast agents for MR imaging.
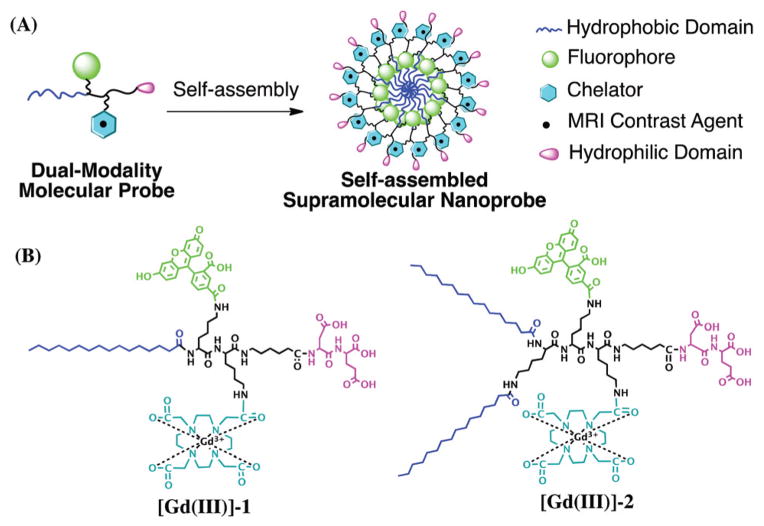
The self-assembly illustration of two dual-modality amphiphilic probes, [Gd(III)]-1 and [Gd(III)]-2, and their molecular structures are shown in Scheme 1. The amphiphilic nature of probes 1 and 2 stems from incorporation of both hydrophobic n-alkyl chains on the N-termini and the hydrophilic domain on the C-termini. The fluorophore 5-carboxyfluorescein (5-FAM) and MR contrast moiety – the gadolinium complex of 1,4,7,10-tetraazacyclododecane-1,4,7,10-tetraacetic acid (Gd-DOTA) – were introduced through a reaction with a lysine residue present on the probe and the activated ester of the corresponding imaging agent. The amphiphilicity of these two probes is expected to enable them to spontaneously self-assemble into nanostructures in an aqueous environment, forming core–shell micelles with a hydrophobic core and hydrophilic moieties outside. The negatively charged dipeptide and the flexible linker on the C-terminal also improve the solubility, preventing aggregation and non-specific association with proteins and cells.
Scheme 1.
(A) Rational design of self-assembling, dual-modality molecular probes containing four essential elements: a hydrophobic domain to promote self-assembly in aqueous environments, a fluorophore for optical imaging, a chelator to enable complexation with metals, such as gadolinium (Gd) for MR contrast, and a hydrophilic headgroup. These amphiphilic molecules are designed to self-assemble into spherical nanoparticles. (B) Chemical structures of the two probes used in the study: [Gd(III)]-1 and [Gd(III)]-2.
Probes 1 and 2 were synthesized using a standard Fmoc-based solid phase peptide synthesis protocol using selectively protected lysine residues for functional group incorporation (details can be found in Fig. S1 in the ESI†). The chelation of probes 1 and 2 with Gd3+ was conducted in water at pH 10–11 and at 80 °C for 2 hours in the presence of an excess of GdCl3.36,37 Gadolinium complexes were purified using reverse-phase HPLC to remove excess gadolinium salt, and the products were characterized using mass spectrometry and analytical HPLC (Fig. S2†). Due to the coordination of Gd3+ to carboxylic acid groups on the chelator, DOTA, the negative charge on DOTA was partially neutralized to ensure longer retention times on HPLC of the complexes compared to the un-complexed substrate.
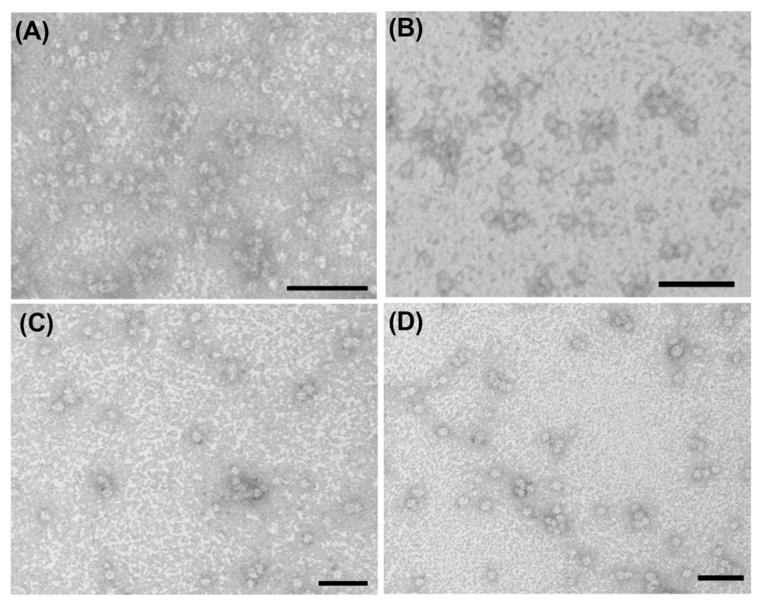
Transmission electron microscopy (TEM) was used to characterize the morphology of the self-assembled nanostructures in PBS at pH 7.4. Representative TEM images of 1 and 2 and their gadolinium complexes [Gd(III)]-1 and [Gd(III)]-2 at 500 μM in PBS are shown in Fig. 1. The dominant features are uniformly distributed nanospheres with average diameters of 7.8 ± 1.2 nm, 8.2 ± 1.0 nm, 10.9 ± 1.9 nm and 10.7 ± 1.4 nm for 1, 2, [Gd(III)]-1 and [Gd(III)]-2, respectively. The amphiphilic nature of these molecules suggests that the nanospheres observed in the TEM images are likely core–shell micelles. The diameters of 1 and 2 are approximately twice those of their respective extended chain lengths, which are 4.7 and 5.0 nm, respectively. The diameter of nanospheres formed from 2 is slightly larger than that of 1 possibly due to the extra lysine residue in 2. The difference of micelle sizes after complexation likely results from a change in the ionic charge status. Upon complexation, DOTA is partially neutralized and thus the repulsion between the headgroups would be reduced, so that more amphiphilic molecules can pack to fit into a spherical shape.38 It is possible that at much higher concentrations other morphologies such as cylindrical micelles could be accessed as a result of minimizing system free energy to achieve an optimal headgroup area.
Fig. 1.
TEM images of self-assembled probes 1 (A), 2 (B), [Gd(III)]-1 (C) and [Gd(III)]-2 (D) at 500 μM in PBS at pH 7.4. TEM samples stained using a 2 wt% uranyl acetate aqueous solution to enhance the imaging contrast. Scale bars are 50 nm.
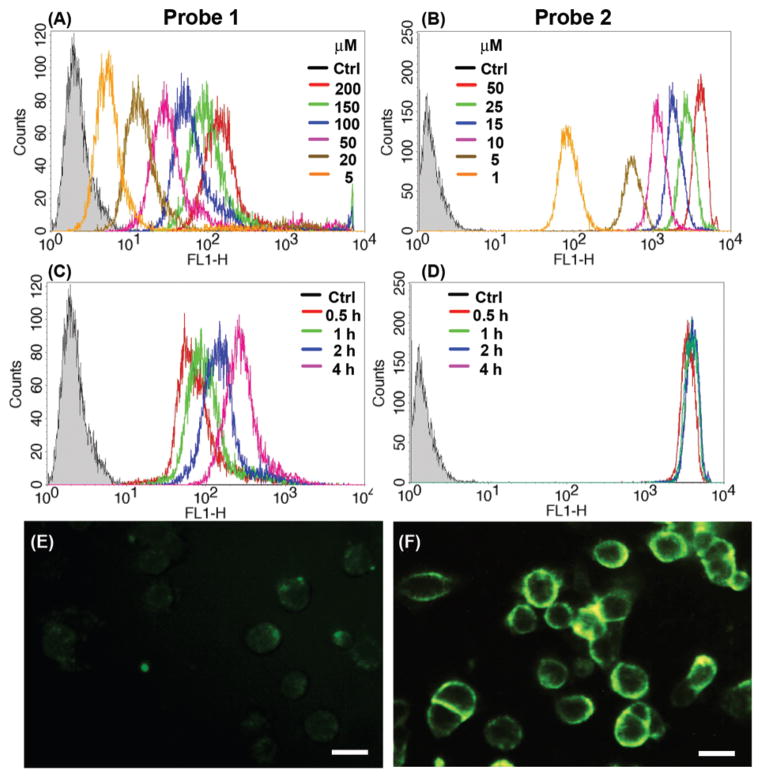
Cellular uptake studies were carried out to evaluate the feasibility of live-cell fluorescence imaging using KB-3-1 human cervical cancer cells incubated with probes 1 and 2. Flow cytometry histograms indicate that cellular uptake of both probes was time and concentration dependent (Fig. 2(A)–(D)). The geometric mean of the signal intensity of 1 increased with the sample concentration and incubation time, while for 2 the signal intensity of cells reached a plateau after one hour and slightly decreased at longer incubation times and at higher sample concentrations (Fig. S3 and S4†). That decrease in the fluorescence intensity may be due to fluorescence quenching after signal saturation upon the highly efficient cellular uptake of 2. Fluorescence images of KB-3-1 cells after 2 hours of incubation with 1 (200 μM) and 2 (50 μM), with concentrations higher than their respective critical micelle concentrations (CMC) (vide infra), are shown in Fig. 2(E) and (F). The images indicate that the insertion of 2 into the cell membrane is much more efficient than that of 1, which was quantified via flow cytometry (Fig. S5†). Probe 2, although studied at a lower concentration of 50 μM, showed approximately 25-fold higher cellular uptake than 1 when studied at the higher concentration of 200 μM. It should be noted that although the concentrations of 1 and 2 used in these experiments were well above their respective CMC values, the solutions actually comprised a mixture of monomers with assembled micelles due to the dynamic nature of supramolecular assemblies. The dramatic difference in the cellular uptake efficiency suggests that it is the chemical structure of the monomers (one hydrocarbon vs. two hydrocarbons) that draws the contrast in cell membrane accumulation and cellular internalization. Since both molecules are expected to be negatively charged under physiological conditions, cellular uptake should occur primarily by virtue of membrane insertion through the hydrophobic alkyl chains, which have previously been used to modify the N-terminal of cell penetrating peptides in gene and drug delivery systems.39–42 Therefore, it is reasonable that, with two alkyl chains on the N-terminal, 2 demonstrated higher cellular uptake than 1. Confocal imaging (Fig. S6†) showed that 1 had entered the cytosol, while 2 was mainly membrane-bound. Cytotoxicity studies of 1 and 2 were carried out using sulforhodamine B (SRB) staining.43 As shown in Fig. S7,† almost no effects on the cell viability were observed at concentrations up to 200 μM for 1 and 50 μM for 2 after incubation for 20 hours.
Fig. 2.
Representative flow cytometry histograms of KB-3-1 cells incubated with 1 and 2 to demonstrate the concentration and time dependence. (A) Probe 1 (0–200 μM) and (B) probe 2 (0–50 μM) for 2 hour incubation. (C) Probe 1 (200 μM) and (D) probe 2 (50 μM) for 0.5, 1, 2 and 4 hour incubation. Representative fluorescence images of KB-3-1 cells after incubation with probe 1 (200 μM) (E) and probe 2 (50 μM) (F) for 2 hours. Scale bars are 20 μm.
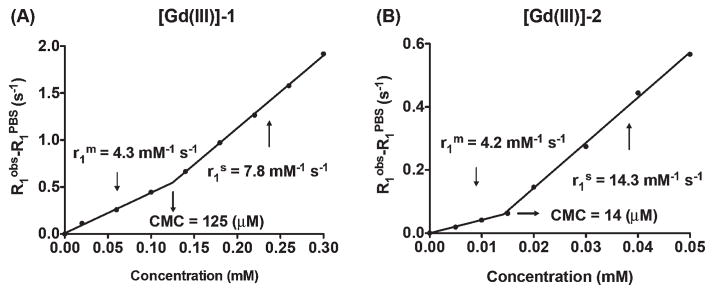
Proton T1 relaxation times were measured to study the relaxivities of the metallated versions of 1 and 2. MRI of different concentrated solutions of [Gd(III)]-1 and [Gd(III)]-2 in PBS at pH 7.4 was performed on an Aspect M2 1T MRI scanner (Shoham, Israel) at room temperature. A standard inversion recovery sequence was used for the T1 measurements. MR images for 13 and 10 different values of TI (time of inversion), ranging from 15 to 4500 ms and 50 to 6000 ms, were acquired for [Gd(III)]-1 and [Gd(III)]-2, respectively. As shown in Fig. 3(A) and (B), enhancement of relaxation rates (s−1) over PBS is plotted against probe concentrations (mM). Relaxivities of the monomer ( ) and self-assembled nanoprobes ( ) were determined from the slopes of linear fits. The CMCs were calculated based on two relaxivities, as described in the ESI,† giving rise to 125 and 14 μM for [Gd(III)]-1 and [Gd(III)]-2, respectively. When the probe concentration fell below the CMC, the contribution to enhancement of the relaxation rate was mainly from the non-assembled, monomeric molecular contrast agent. As soluble molecules, the nature of [Gd(III)]-1 and [Gd(III)]-2 was similar, therefore the measured monomer relaxivities of 4.3 and 4.2 mM−1 s−1 for [Gd(III)]-1 and [Gd(III)]-2 were comparable to those of other single molecular Gd-DOTA contrast agents reported, ranging from 3.5 to 4.8 mM−1 s−1.44
Fig. 3.

The plots of the reciprocals of the T1 relaxation time versus concentrations of [Gd(III)]-1 (A) and [Gd(III)]-2 (B) in PBS at pH 7.4 (25 °C, 1 T). Longitudinal relaxivities r1 were determined from the slope of the linear fits. The CMC of each probe was calculated based on relaxivities of the monomer ( ) and self-assembled nanoprobes ( ).
We found that the self-assembly of molecular contrast agents into supramolecular nanoprobes could significantly enhance the water proton relaxation rates. Micelle relaxivities of 7.8 and 14.3 mM−1 s−1 were obtained for [Gd(III)]-1 and [Gd(III)]-2, respectively. Given their supramolecular nature, these self-assembled nanoprobes are in a dynamic equilibrium with the monomeric molecular contrast agents (monomers), but the monomer concentration would remain constant at concentrations above the CMC.38 The relaxivity of self-assembled micelles measured above the CMC represents the relaxivity of the self-assembled nanostructures.45 [Gd(III)]-2 exhibited a greater increase in micelle relaxivity over monomer relaxivity than that of [Gd(III)]-1. This difference can be well explained by the denser packing of [Gd(III)]-2 in the micellar state because it contains two hydrophobic alkyl tails, which led to a larger aggregation number and a higher total mass for [Gd(III)]-2 micelles than that of [Gd(III)]-1 micelles. The higher molar mass of micelles of [Gd(III)]-2 slows the micelle rotational correlation time greater than for [Gd(III)]-1, which is known to increase the relaxivity of contrast agents.46–48 These results demonstrate that higher relaxivity can be achieved via self-assembly of nanoprobes to serve as MR contrast agents that are superior to the individual molecular probes. This increase in relaxivity can be engineered through careful design of the components of the self-assembling nanostructures.
The CMCs of 1 and 2 were also determined through fluorescence measurements. For both 1 and 2, maximum emission fluorescence intensities increased approximately linearly with increasing concentrations initially and then decreased when the concentrations increased further (Fig. S8†). The transition of the emission maximum occurred at concentrations above 130 μM and 15 μM for 1 and 2, respectively, consistent with the CMC values measured from the aforementioned MR studies. Those transitions can be attributed to the formation of self-assembled nanostructures. When monomers self-assemble into micelles, the fluorophore is packed within and partially quenched and the fluorescence signal plateaus with increasing concentration. The decrease of the fluorescence signal was due to both the inner filter effects at high concentrations and the scattering from the increased number of micelles. In addition, peak positions of emission spectra of both probes exhibited red shifts with increasing concentration, and the shifts occurred to a greater extent above the CMC, indicating the local environmental change of the 5-FAM fluorophore. The CMC value of 2 was lower than that of 1, simply because 2 is more hydrophobic, which can drive self-assembly at lower concentrations and also yield more stable supramolecular structures in an aqueous environment.
Conclusions
In summary, we report the synthesis of two amphiphilic dual-modality nanoprobes, each containing a fluorophore and a Gd-DOTA complex, which self-assemble into supramolecular nanostructures. Live-cell imaging studies suggest that these nanoprobes can effectively label cells with the assistance of their incorporated alkyl chains. The negatively charged surface of the resulting micelles causes no cytotoxicity at concentrations higher than the CMC for either nanoprobe. Self-assembly of the probes into nanostructures increased the probe relaxivity, potentially providing superior contrast agents to conventional, unimolecular probes. All of these properties are controlled by design rules incorporated into the component building blocks. Our results demonstrated that multi-modality probes can be designed to self-assemble into supramolecular nanostructures that have imaging properties superior to those of the independent components. Synthesis of nanoprobes with different sizes, shapes and surface modifications as well as in vivo evaluation of the resulting constructs are under way. And clearly, since supramolecular assemblies are a function of the assembly conditions, their stability in circulation and responsiveness to environmental changes would pose a great challenge in the fundamental design of supramolecular nanoprobes.
Supplementary Material
Acknowledgments
We thank the National Science Foundation (DMR 1255281), National Institutes of Health (U54CA151838), and W. W. Smith Charitable Trust for support of the project. We thank Dr Michael McMahon in the Radiology Department, Johns Hopkins University for helpful discussion on the MRI studies.
Footnotes
Electronic supplementary information (ESI) available: Experimental methods, materials, synthesis schemes, sample characterization, fluorescence measurements, cellular uptake and MRI experimental details. See DOI: 10.1039/c5nr01518a
References
- 1.Aida T, Meijer EW, Stupp SI. Science. 2012;335:813–817. doi: 10.1126/science.1205962. [DOI] [PMC free article] [PubMed] [Google Scholar]
- 2.Gadt T, Ieong NS, Cambridge G, Winnik MA, Manners I. Nat Mater. 2009;8:144–150. doi: 10.1038/nmat2356. [DOI] [PubMed] [Google Scholar]
- 3.Bates FS, Hillmyer MA, Lodge TP, Bates CM, Delaney KT, Fredrickson GH. Science. 2012;336:434–440. doi: 10.1126/science.1215368. [DOI] [PubMed] [Google Scholar]
- 4.Cui H, Chen Z, Zhong S, Wooley KL, Pochan DJ. Science. 2007;317:647–650. doi: 10.1126/science.1141768. [DOI] [PubMed] [Google Scholar]
- 5.Kuang Y, Shi J, Li J, Yuan D, Alberti KA, Xu Q, Xu B. Angew Chem, Int Ed. 2014;53:8104–8107. doi: 10.1002/anie.201402216. [DOI] [PMC free article] [PubMed] [Google Scholar]
- 6.Lin R, Cui H. Curr Opin Chem Eng. 2015;7:75–83. [Google Scholar]
- 7.Ramakers BEI, van Hest JCM, Lowik D. Chem Soc Rev. 2014;43:2743–2756. doi: 10.1039/c3cs60362h. [DOI] [PubMed] [Google Scholar]
- 8.Trent A, Marullo R, Lin B, Black M, Tirrell M. Soft Matter. 2011;7:9572. [Google Scholar]
- 9.Cui H, Webber MJ, Stupp SI. Biopolymers. 2010;94:1–18. doi: 10.1002/bip.21328. [DOI] [PMC free article] [PubMed] [Google Scholar]
- 10.Sathaye S, Zhang H, Sonmez C, Schneider JP, MacDermaid CM, Von Bargen CD, Saven JG, Pochan DJ. Biomacromolecules. 2014;15:3891–3900. doi: 10.1021/bm500874t. [DOI] [PMC free article] [PubMed] [Google Scholar]
- 11.Kumar VA, Taylor NL, Shi S, Wang BK, Jalan AA, Kang MK, Wickremasinghe NC, Hartgerink JD. ACS Nano. 2015;9:860–868. doi: 10.1021/nn506544b. [DOI] [PMC free article] [PubMed] [Google Scholar]
- 12.Pires RA, Abul-Haija YM, Costa DS, Novoa-Carballal R, Reis RL, Ulijn RV, Pashkuleva I. J Am Chem Soc. 2015;137:576–579. doi: 10.1021/ja5111893. [DOI] [PubMed] [Google Scholar]
- 13.Kelly JW. Curr Opin Struct Biol. 1998;8:101–106. doi: 10.1016/s0959-440x(98)80016-x. [DOI] [PubMed] [Google Scholar]
- 14.Rothemund PWK. Nature. 2006;440:297–302. doi: 10.1038/nature04586. [DOI] [PubMed] [Google Scholar]
- 15.Pearce TR, Kokkoli E. Soft Matter. 2015;11:109–117. doi: 10.1039/c4sm01332h. [DOI] [PubMed] [Google Scholar]
- 16.Bae Y, Fukushima S, Harada A, Kataoka K. Angew Chem, Int Ed. 2003;42:4640–4643. doi: 10.1002/anie.200250653. [DOI] [PubMed] [Google Scholar]
- 17.Haag R. Angew Chem, Int Ed. 2004;43:278–282. doi: 10.1002/anie.200301694. [DOI] [PubMed] [Google Scholar]
- 18.Preslar AT, Parigi G, McClendon MT, Sefick SS, Moyer TJ, Haney CR, Waters EA, MacRenaris KW, Luchinat C, Stupp SI, Meade TJ. ACS Nano. 2014;8:7325–7332. doi: 10.1021/nn502393u. [DOI] [PMC free article] [PubMed] [Google Scholar]
- 19.Hu CMJ, Fang RH, Luk BT, Zhang LF. Nat Nanotechnol. 2013;8:933–938. doi: 10.1038/nnano.2013.254. [DOI] [PMC free article] [PubMed] [Google Scholar]
- 20.Cai WB, Chen XY. Small. 2007;3:1840–1854. doi: 10.1002/smll.200700351. [DOI] [PubMed] [Google Scholar]
- 21.Schipper ML, Iyer G, Koh AL, Cheng Z, Ebenstein Y, Aharoni A, Keren S, Bentolila LA, Li JQ, Rao JH, Chen XY, Banin U, Wu AM, Sinclair R, Weiss S, Gambhir SS. Small. 2009;5:126–134. doi: 10.1002/smll.200800003. [DOI] [PMC free article] [PubMed] [Google Scholar]
- 22.Chapman S, Dobrovolskaia M, Farahani K, Goodwin A, Joshi A, Lee H, Meade T, Pomper M, Ptak K, Rao J, Singh R, Sridhar S, Stern S, Wang A, Weaver JB, Woloschak G, Yang L. Nano Today. 2013;8:454–460. doi: 10.1016/j.nantod.2013.06.001. [DOI] [PMC free article] [PubMed] [Google Scholar]
- 23.Zhang P, Cheetham AG, Lock LL, Li Y, Cui H. Curr Opin Biotechnol. 2015;34C:171–179. doi: 10.1016/j.copbio.2015.01.009. [DOI] [PMC free article] [PubMed] [Google Scholar]
- 24.Hu CMJ, Fang RH, Luk BT, Zhang LF. Nanoscale. 2014;6:65–75. doi: 10.1039/c3nr05444f. [DOI] [PubMed] [Google Scholar]
- 25.Wang AZ, Langer R, Farokhzad OC. Annu Rev Med. 2012;63:185–198. doi: 10.1146/annurev-med-040210-162544. [DOI] [PubMed] [Google Scholar]
- 26.Gao J, Xu B. Nano Today. 2009;4:37–51. [Google Scholar]
- 27.Chien MP, Thompson MP, Gianneschi NC. Chem Commun. 2011;47:167. doi: 10.1039/c0cc02291h. [DOI] [PubMed] [Google Scholar]
- 28.Dawidczyk CM, Kim C, Park JH, Russell LM, Lee KH, Pomper MG, Searson PC. J Controlled Release. 2014;187:133–144. doi: 10.1016/j.jconrel.2014.05.036. [DOI] [PMC free article] [PubMed] [Google Scholar]
- 29.Xie J, Lee S, Chen XY. Adv Drug Delivery Rev. 2010;62:1064–1079. doi: 10.1016/j.addr.2010.07.009. [DOI] [PMC free article] [PubMed] [Google Scholar]
- 30.Jennings LE, Long NJ. Chem Commun. 2009:3511–3524. doi: 10.1039/b821903f. [DOI] [PubMed] [Google Scholar]
- 31.Lee S, Chen X. Mol Imaging. 2009;8:87–100. [PubMed] [Google Scholar]
- 32.Brindle K. Nat Rev Cancer. 2008;8:94–107. doi: 10.1038/nrc2289. [DOI] [PubMed] [Google Scholar]
- 33.Banerjee SR, Pullambhatla M, Byun Y, Nimmagadda S, Foss CA, Green G, Fox JJ, Lupold SE, Mease RC, Pomper MG. Angew Chem, Int Ed. 2011;50:9167–9170. doi: 10.1002/anie.201102872. [DOI] [PMC free article] [PubMed] [Google Scholar]
- 34.Olson ES, Jiang T, Aguilera TA, Nguyen QT, Ellies LG, Scadeng M, Tsien RY. Proc Natl Acad Sci U S A. 2010;107:4311–4316. doi: 10.1073/pnas.0910283107. [DOI] [PMC free article] [PubMed] [Google Scholar]
- 35.Whitney MA, Crisp JL, Nguyen LT, Friedman B, Gross LA, Steinbach P, Tsien RY, Nguyen QT. Nat Biotechnol. 2011:1–7. doi: 10.1038/nbt.1764. [DOI] [PMC free article] [PubMed] [Google Scholar]
- 36.Desreux JF. Inorg Chem. 1980;19:1319–1324. [Google Scholar]
- 37.Meyer D, Schaefer M, Bonnemain B. Invest Radiol. 1988;23:S232–S235. doi: 10.1097/00004424-198809001-00048. [DOI] [PubMed] [Google Scholar]
- 38.Israelachvili JN. Intermolecular and Surface Forces. Academic Press; 2011. [Google Scholar]
- 39.Futaki S, Ohashi W, Suzuki T, Niwa M, Tanaka S, Ueda K, Harashima H, Sugiura Y. Bioconjugate Chem. 2001;12:1005–1011. doi: 10.1021/bc015508l. [DOI] [PubMed] [Google Scholar]
- 40.Khalil IA, Futaki S, Niwa M, Baba Y, Kaji N, Kamiya H, Harashima H. Gene Ther. 2004;11:636–644. doi: 10.1038/sj.gt.3302128. [DOI] [PubMed] [Google Scholar]
- 41.Chen ZP, Zhang PC, Cheetham AG, Moon JH, Moxley JW, Lin YA, Cui HG. J Controlled Release. 2014;191:123–130. doi: 10.1016/j.jconrel.2014.05.051. [DOI] [PubMed] [Google Scholar]
- 42.Zhang PC, Lock LL, Cheetham AG, Cui HG. Mol Pharm. 2014;11:964–973. doi: 10.1021/mp400619v. [DOI] [PMC free article] [PubMed] [Google Scholar]
- 43.Vichai V, Kirtikara K. Nat Protocols. 2006;1:1112–1116. doi: 10.1038/nprot.2006.179. [DOI] [PubMed] [Google Scholar]
- 44.Caravan P, Ellison JJ, McMurry TJ, Lauffer RB. Chem Rev. 1999;99:2293–2352. doi: 10.1021/cr980440x. [DOI] [PubMed] [Google Scholar]
- 45.Nicolle GM, Toth E, Eisenwiener KP, Macke HR, Merbach AE. J Biol Inorg Chem. 2002;7:757–769. doi: 10.1007/s00775-002-0353-3. [DOI] [PubMed] [Google Scholar]
- 46.Bull S, Guler M, Bras R, Meade T, Stupp S. Nano Lett. 2005;5:1–4. doi: 10.1021/nl0484898. [DOI] [PubMed] [Google Scholar]
- 47.Caravan P, Farrar CT, Frullano L, Uppal R. Contrast Media Mol Imaging. 2009;4:89–100. doi: 10.1002/cmmi.267. [DOI] [PMC free article] [PubMed] [Google Scholar]
- 48.Ghosh A, Haverick M, Stump K, Yang X, Tweedle MF, Goldberger JE. J Am Chem Soc. 2012;134:3647–3650. doi: 10.1021/ja211113n. [DOI] [PMC free article] [PubMed] [Google Scholar]
- 49.Matsumura Y, Maeda H. Cancer Res. 1986;46:6387–6392. [PubMed] [Google Scholar]
Associated Data
This section collects any data citations, data availability statements, or supplementary materials included in this article.


