

Abstract
Background
The purpose of this study was to evaluate if a physician/pharmacist collaborative model would be implemented as determined by improved blood pressure (BP) control in primary care medical offices with diverse geographic and patient characteristics and whether long-term BP control could be sustained.
Methods and Results
Prospective, cluster-randomized trial of 32 primary care offices stratified and randomized to: control, 9-month intervention (brief), 24-month intervention (sustained). We enrolled 625 subjects with uncontrolled hypertension; 54% from racial/ethnic minority groups, and 50% with diabetes or chronic kidney disease (CKD). The primary outcome of BP control at 9 months was 43% in intervention offices (n=401) compared to 34% in the control group (n=224) (adjusted odds ratio [OR] 1.57 [95% CI 0.99–2.50], p = 0.059). The adjusted difference in mean systolic/diastolic BP between the intervention and control groups for all subjects at 9 months was −6.1/−2.9 mm Hg (p =0.002 and p=0.005, respectively), and it was −6.4/−2.9 mm Hg (p=0.009 and p=0.044, respectively) in subjects from racial or ethnic minorities. BP control and mean BP were significantly improved in subjects from racial minorities in intervention offices at 18 and 24 months (p=0.048 to p<0.001) compared to the control group.
Conclusions
While the results of the primary outcome (BP control) were negative, the key secondary endpoint (mean BP) was significantly improved in the intervention group. Thus, the findings for secondary endpoints suggest that team-based care utilizing clinical pharmacists was implemented in diverse primary care offices and BP was reduced in subjects from racial minority groups.
Clinical Trial Registration Information
Keywords: hypertension management, pharmacist management, blood pressure control
INTRODUCTION
Physician-pharmacist collaboration has been an effective strategy to improve BP in primary care.1, 2 Our team has developed an effective model of physician-pharmacist collaboration studied in carefully controlled efficacy studies.3–6 The most recent meta-analysis7 and systematic review8 have re-confirmed that pharmacist interventions can significantly improve BP. The authors of the meta-analysis evaluated 39 randomized controlled trials in 14,224 patients and found pharmacist interventions reduced systolic BP −7.6 mm Hg (95% CI: −9.0 to −6.3 mm Hg) compared to usual care. These authors concluded that pharmacist interventions were highly effective but that comparative effectiveness studies with longer duration of follow-up are still needed to determine the most efficient methods of implementation.7 Of note, most studies reported prior to 2008 when the present study was designed, would be described as efficacy studies conducted under optimal conditions and often included only one or two offices with a small number of intervention pharmacists. It is not known if our intervention would be implemented in typical primary care offices when evaluated in an effectiveness trial under more routine care conditions. It is also unclear if pharmacist interventions are as effective in under-represented minority populations when compared to Caucasians. Finally, it is not clear if there is a sustained effect after discontinuation of the intervention.9–11
The purpose of the Collaboration Among Pharmacists and physicians To Improve Outcomes Now (CAPTION)12 study was to evaluate if the intervention 1) could be implemented in a large number of medical offices, 2) had a sustained effect once it was discontinued, and 3) was effective in minority populations. CAPTION was an implementation trial designed to evaluate the comparative effectiveness of a short or longer pharmacist intervention with usual care.
METHODS
The CAPTION study was a prospective, multi-center trial in 32 medical offices from 15 states. A main requirement of each office was that an onsite clinical pharmacist must have practiced in the office. The pre-planned goal was to recruit at least 40% minority patients, particularly African-Americans and Hispanics. All subjects signed informed consent and were assigned to an intervention or control group by virtue of their medical office randomization. Offices were stratified based on the level of pharmacy services at baseline (low vs. high) and percent minorities (<44% vs. ≥44%) and then randomized to one of three groups: 1) a 9-month pharmacist intervention (brief intervention, [BI]), 2) a 24-month pharmacist intervention (sustained, [SI]), or 3) a control group that received usual care. Both intervention groups were designed to receive the identical intervention for the first 9 months, at which time the brief intervention was discontinued and the sustained intervention was designed to be continued for 24 months. Subjects in the control group received usual care. SCs conducted identical study visits and data collection procedures in all 3 groups including research BP measurements at baseline, 6, 9, 12, 18 and 24 months. The study design, baseline data, description of the sites, and how office personnel were trained can be found in the supplement and previous publications.12, 13 The study was approved by the University of Iowa Institutional Review Board (IRB) and the IRBs overseeing the individual sites.
We used a validated survey instrument to score clinical pharmacy services prior to the intervention.14 This survey determined the degree to which pharmacists provided direct patient care, managed medications, ordered laboratory tests and documented their activities in the medical record. Scores could range from 0–150 and were similar to previous findings.14, 15 Offices with a great deal of direct patient management scored high (114–143), while pharmacists who provided mostly “hallway consultations” and education scored low (19–113). Specific scores for individual offices can be found in the Supplement.
Pharmacists in control offices were instructed to avoid intervention for study participants with hypertension, but they could provide usual care “curbside consultations” if physicians specifically asked questions. Control offices participated in an alternative distracter intervention for patients with asthma.16
The proposed intervention included medical record review by the pharmacist and a structured interview with the subject, including: 1) a medication history; 2) an assessment of knowledge of BP medications, dosages and timing, and potential side effects; 3) and other barriers to BP control (e.g., side effects, non-adherence). The model recommended a telephone call at 2 weeks, structured face-to-face visits at baseline, 1, 2, 4, 6 and 8 months and additional visits if BP remained uncontrolled. Because this was an implementation trial, we did not require strict adherence to the model in an effort to replicate actual clinical practice, but all pharmacist visits were tracked. The pharmacist created a care plan with recommendations for the physician to adjust therapy.3, 4, 17 Most pharmacist communication with the physician was face-to-face but some were via email. Recommendations to physicians were based on JNC-7, and the BP goals were:18 <140/90 mm Hg for uncomplicated hypertension or <130/80 mm Hg for patients with diabetes or CKD. The pharmacists did not follow algorithms or protocols other than JNC-7. Physicians were free to accept or reject any recommendation or modify the plan. Recommendations to patients focused on medication education, improving adherence, and strategies to implement lifestyle modifications.
The grant provided funding for a study coordinator (SC) (RN, LPN or MA) employed in each office who recruited subjects and collected study data. SCs came to the University of Iowa and were provided day-long structured training on data collection and use of the web-based data entry system designed by the DCC.12, 19 One investigator (BLC) trained SCs on proper BP measurement using an automated Omron HEM 907-XL device and proper techniques.4, 20, 21
The recruitment process is described in the Supplement. Subjects were eligible if they were English or Spanish speaking, over 18 years of age with uncontrolled BP as measured by the SC on the baseline visit.
The SC measured BP in the sitting position after appropriate rest using a standard research technique at baseline, 6, 9, 12, 18 and 24-months.4, 20, 21 The BP was measured once using the automated device but this value was not used for the official research BP. Two additional BPs were obtained a minute apart and were averaged if they were within 4 mm Hg. If more than 4 mm different, another BP was obtained and the two closest values were averaged using previous research procedures.20 The SC collected the following at baseline: height, weight, and pulse, the duration of HTN, presence of other cardiovascular risk factors, symptoms and adverse drug reactions, socio-demographics, co-morbidities, current medications and dose. Subjects self-reported race. Medication adherence was evaluated using validated 4-item instrument that asked about difficulties taking BP medications.22, 23 Each yes response was given one point. Good adherence was defined as 0–1 and poor adherence as 2–4. Scripted questionnaires were administered by bilingual SCs or translators if subjects spoke only Spanish.
Trained study monitors from the DCC visited each office to review the completeness and accuracy of the data by comparing the medical records and the web-based database. All discrepancies were corrected. The study monitors also re-certified each SC in BP measurement at each yearly monitoring visit.
Data Analysis
The study aims and hypotheses, based on a previous efficacy study conducted by our research team,3 can be found in the Supplement. The primary objective of the study was to determine if subjects in clinics randomized to the intervention groups (both intervention groups combined at 9 months since the intervention was identical at that time) achieved better BP control than subjects in offices randomized to the control group. The primary endpoint was the dichotomous variable of BP control at 9 months (controlled or uncontrolled).12 BP control was defined according to whether a subject had diabetes or CKD at baseline. If neither was reported at baseline, CKD was considered to be present if the calculated glomerular filtration rates (GFR) from the two most recent creatinine tests were below 60 ml/min/1.73m2 using a standard formula.24 For subjects with diabetes/CKD at baseline, BP control was defined as an average SBP<130 mmHg and diastolic BP<80 mmHg. For subjects with neither condition, BP control was defined as having average SBP<140 mmHg and diastolic BP<90 mmHg.
The primary analysis used a non-linear mixed effects model with the logit link function to estimate the log-odds of BP control in the intervention group (two combined intervention groups) relative to the control group over time. The model incorporated the observed BP control variable at both the 6 and 9 month visits. The odds ratio (OR) of BP control at 9 months was then estimated using the appropriate linear contrast of the model parameter estimates. The office random effects were assumed to be normally distributed and have a compound symmetric covariance structure. The nested within subject random effects were assumed to have a first order auto-regressive [AR(1)] covariance structure. We examined potential confounding variables at baseline, and performed sensitivity analyses to adjust for any covariates that differed across treatment groups.
We also considered three a priori interactions between intervention groups and three variables describing provider level characteristics: two theory of planned behavior scores (separate scores assessing physician and pharmacist attitudes towards the intervention) and the clinic pharmacy structure (classified as high or low). These separate analyses were based on the same model described above, with the exception that terms were added to address the two-way interaction between the intervention groups and provider level characteristics. If the interactions were not significant, but the provider characteristics were related to outcome, sensitivity analyses were reported to assess the impact of intervention after adjustment for these relevant provider characteristics.
The primary analysis was based on the intention-to-treat (ITT) principle, with all subjects analyzed in the group to which their office was randomized. For the primary analysis, subjects who did not provide a BP measurement at a particular visit were assumed to not have controlled BP. However, we also performed a series of sensitivity analyses, using only subjects with observed data (no imputation) and using a last observation carried forward approach, to determine the potential dependence of the results of the primary analysis on the missing values.
Sample Size Calculation
A prior study found BP control rates of 25% versus 60% at 6 months, with an observed intraclass correlation coefficient (ICC) estimate of 0.0012.4 Based on the assumption that BP control would continue to improve in the control group from 6 to 9 months, we chose to power the study to detect an increase in BP control rates from 35% in the control group to 60% in the intervention groups for minority subjects with a 5% level test (alpha) using the method described by Donner et al.25 To be conservative, we also assumed an ICC value of 0.002 for the sample size calculations. Assuming 40% of subjects in each group were minorities, the calculations suggested 648 subjects in 27 offices would be needed. For the primary comparison at 9 months, this provided 90% power to detect a difference in BP control rates of 35% versus 50% in the total population.
Interim Monitoring
A Data and Safety Monitoring Board (DSMB) assessed two interim reviews of study outcomes using a Lan-DeMets alpha spending function approach with O’Brien-Fleming stopping boundaries to assess efficacy, and conditional power to assess futility. The DSMB approved a Statistical Analysis Plan (SAP) describing all pre-planned analyses prior to the presentation of any interim data.
Secondary Analyses (9 Months)
A secondary objective was to determine if subjects in offices randomized to the combined intervention groups achieved lower mean BP than subjects in the control group at 9 months. Separate analyses were conducted for both systolic and diastolic BP, and used a linear mixed model with random effects for office and subject within office to estimate the difference in mean BP for subjects in the two intervention groups relative to the control group. As with the primary analysis, the center random effects were assumed to be normally distributed and have a compound symmetric covariance structure, and the nested within subject errors were assumed to have an AR(1) covariance structure.
An additional secondary objective was to determine if subjects from minority populations in offices randomized to the intervention groups achieved higher BP control rates and lower mean BP levels than minority subjects in the control group at 9 months. This was assessed in the same manner as described above, except the models included additional terms for minority strata and the interaction between interventions and minority strata. Final results were reported separately for both minority and non-minority subjects from the model that includes the interaction.
Secondary Analyses (After 9 Months)
Another secondary objective was to assess whether clinics randomized to the intervention groups maintained higher BP control rates and lower mean BP levels than the control group at 12, 18, and 24 months. These analyses used models similar to those in the primary analyses, with the exception that the two intervention groups were no longer combined (since the groups were only identical with respect to the intervention during the first 9 months of the study). To allow the difference in BP control rates and mean BP levels to differ across time points of interest, interaction terms between intervention groups and time points were included in the model. Differences for BP control rates and mean BP levels for the three pairwise comparisons of interest were assessed separately within each time point using an appropriate linear contrast of the model parameter estimates. During the last year of the trial, funding constraints by the sponsor required the study to end earlier than planned but this did not affect the 9 or 12 month time points. Due to the early closure of the study, there were a number of enrolled subjects whose 18 and/or 24 month follow-up visits fell after the date of study closure. Missing data for all visits scheduled prior to and including 06/28/2013 were imputed in the same manner as above for the 9-month primary analysis (assumed BP uncontrolled). For missing visits schedule to occur after 06/28/2013, the data were not considered “missing” for the purposes of this analysis, no imputation was performed, and that observation was excluded from the analysis. These decisions concerning early termination and proposed data analyses modifications were reviewed and approved by the DSMB.
A final secondary objective was to determine if subjects from minority populations in offices randomized to the intervention groups achieved higher BP control rates and lower mean BP levels than minority subjects in the control group. This was assessed in the same manner as described above, except the models included additional terms for minority strata, the relevant two-way interactions with minority strata, and the three-way interaction between minority strata, intervention group, and time. The final results were reported separately by time point for both minority and non-minority subjects from the model that includes the interaction.
Safety
All reported serious adverse events (SAEs) were evaluated by two medical safety monitors, and classified as at least potentially related to the intervention and/or unanticipated. The medical safety monitors and DSMB reviewed blinded tabulated summaries of cumulative SAEs at regular intervals during the study.
Results
Recruitment began March 2010 and the last subject completed the trial June 2013. Clinic stratification, randomization and subjects consented (n=1053) are displayed in Figure 1. While there appear to be differences in the consent rate, many of the eligible subjects were not approached once a clinic met its enrollment targets. At enrollment, 402 (38%) were excluded for controlled BP when measured by the SCs, 8 for excessive BP and 25 for other reasons (e.g. failed mental status examination [10], untreated sleep apnea [4], arm too large for cuff [2], recent MI, angina, stroke, heart failure, renal failure or elevated liver tests [6], not a patient in the study office [1], declined mental status examination [1] or withdrew consent [1]). The remaining 625 subjects entered the trial with complete data in 100%, 86%, 82%, 78% and 79% at the baseline, 9, 12, 18 and 24-month visits, respectively.
Figure 1.
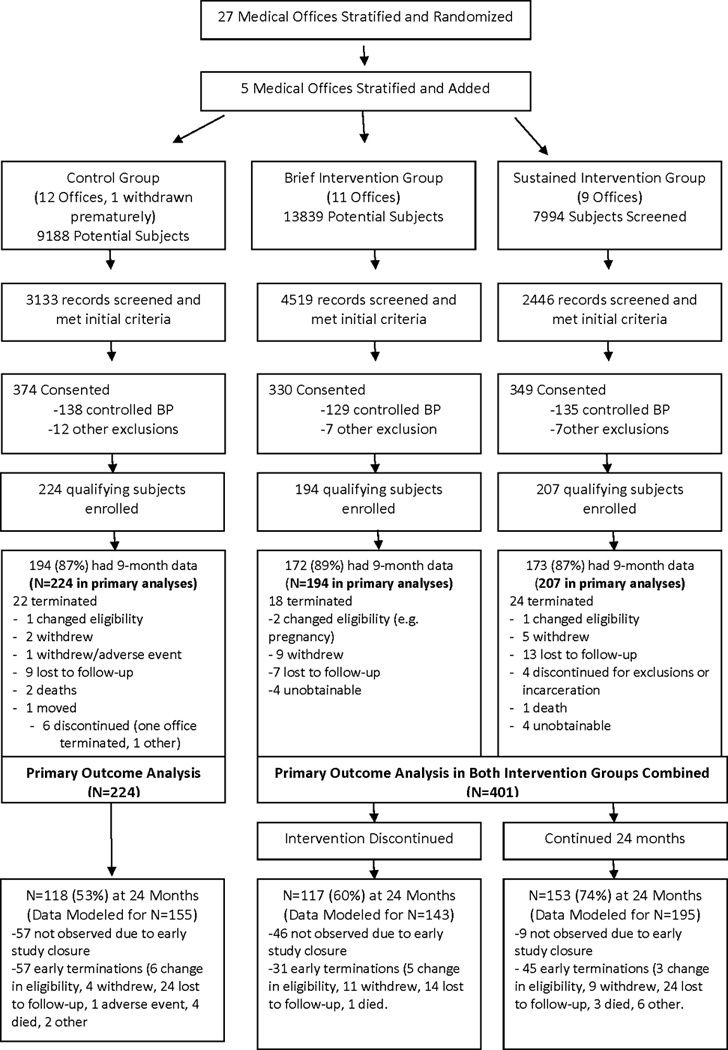
Distribution of Study Subjects
Over half of the enrolled subjects were minorities (Table 1), the majority of which were African American (n=239) or Hispanic (n=89). Many subjects had annual incomes ≤$25,000 (49%) or had Medicaid (14%) or free care/self-pay (11%). Notably, 314 (50%) had diabetes or CKD. The three study arms were comparable at baseline, with the exception subjects in the BI arm were significantly more likely to be married and to have private insurance (Table 1). Baseline BP levels, comorbidities, medication adherence scores, and number of antihypertensive medications were similar across all three study arms (Table 2). Pharmacist encounters averaged 0.58/subject/month and 0.50/subject/month in the BI and SI groups, respectively, during the first 9 months. The average encounters were 0.07/month in the BI compared to 0.26/month in the SI between the 9–24 months confirming that the intended differences between these groups was achieved.
Table 1.
Baseline Demographics
| Variable | Brief† | Sustained‡ | Control |
|---|---|---|---|
| (N=194) | (N=207) | (N=224) | |
| N (Pct.) | N (Pct.) | N (Pct.) | |
| Gender | |||
| Male | 75 (38.7%) | 82 (39.6%) | 91 (40.6%) |
| Female | 119 (61.3%) | 125 (60.4%) | 133 (59.4%) |
| Race/Ethnicity | |||
| Non-Hispanic Caucasian | 95 (49.0%) | 73 (35.3%) | 111 (49.6%) |
| Minority | 94 (48.5%) | 132 (63.8%) | 111 (49.6%) |
| Declined to answer/missing | 5 (2.6%) | 2 (1.0%) | 2 (0.9%) |
| Education | |||
| <= 12 Years | 101 (52.1%) | 118 (57.0%) | 109 (48.7%) |
| > 12 Years | 92 (47.4%) | 89 (43.0%) | 113 (50.4%) |
| Missing | 1 | 0 | 2 |
| Marital status | |||
| Married | 114 (58.8%) | 82 (39.6%) | 106 (47.3%) |
| Not married | 79 (40.7%) | 125 (60.4%) | 118 (52.7%) |
| Missing | 1 | 0 | 0 |
| Age (years) | |||
| Mean (SD) | 61.8 (12.4) | 57.8 (11.8) | 61.8 (13.7) |
| Weight (kg) | |||
| Mean (SD) | 94.8 (25.3) | 98.4 (26.3) | 92.7 (23.8) |
| BMI | |||
| Mean (SD) | 33.8 (8.5) | 35.2 (9.0) | 33.0 (7.7) |
| Insurance coverage | |||
| Medicare | 53 (27.3%) | 52 (25.1%) | 84 (37.5%) |
| Private and Other | 105 (54.1%) | 76 (36.7%) | 98 (43.8%) |
| Medicaid | 13 (6.7%) | 45 (21.7%) | 29 (12.9%) |
| Free and None/Self-Pay | 23 (11.9%) | 34 (16.4%) | 13 (5.8%) |
| Annual income | |||
| < $25,000 | 74 (38.1%) | 126 (60.9%) | 103 (46.0%) |
| >= $25,000 | 119 (61.3%) | 81 (39.1%) | 121 (54.0%) |
| Missing | 1 | 0 | 0 |
| Smoking status | |||
| Current smoker | 30 (15.5%) | 49 (23.7%) | 33 (14.7%) |
| Former smoker | 59 (30.4%) | 66 (31.9%) | 65 (29.0%) |
| Never smoker | 103 (53.1%) | 92 (44.4%) | 124 (55.4%) |
| Missing | 2 | 0 | 2 |
| Alcohol intake | |||
| No alcohol intake | 113 (58.2%) | 124 (59.9%) | 128 (57.1%) |
| Any alcohol intake | 81 (41.8%) | 82 (39.6%) | 95 (42.4%) |
| Missing | 0 | 1 | 1 |
| Diabetes/kidney disease | |||
| Diabetes/kidney disease | 92 (47.4%) | 98 (47.3%) | 121 (54.0%) |
| No diabetes/kidney disease | 102 (52.6%) | 109 (52.7%) | 103 (46.0%) |
CKD = chronic kidney disease; BMI = body mass index
9-month intervention;
24-month intervention
Table 2.
Baseline Blood Pressure Characteristics
| Variable | Brief† | Sustained‡ | Control |
|---|---|---|---|
| (N=194) | (N=207) | (N=224) | |
| N (Pct.) | N (Pct.) | N (Pct.) | |
| Duration of high BP | |||
| <= 3 years | 30 (15.5%) | 28 (13.5%) | 44 (19.6%) |
| > 3 – 10 years | 55 (28.4%) | 90 (43.5%) | 80 (35.7%) |
| > 10 years | 109 (56.2%) | 89 (43.0%) | 100 (44.6%) |
| Baseline Systolic BP | |||
| Mean (SD) | 147.6 (13.7) | 149.8 (15.6) | 149.6 (15.3) |
| Baseline Diastolic BP | |||
| Mean (SD) | 83.5 (12.4) | 86.6 (11.6) | 84.3 (12.6) |
| Comorbidities | |||
| Mean (SD) | 2.2 (1.5) | 2.2 (1.4) | 2.2 (1.4) |
| Number of Antihypertensive Medications | |||
| Mean (SD) | 2.0 (1.1) | 2.2 (1.1) | 2.0 (1.1) |
| Missing | 9 | 6 | 12 |
| Medication Adherence Score | |||
| Medication adherence <= 1 | 155 (79.9%) | 159 (76.8%) | 177 (79.0%) |
| Medication adherence >= 2 | 28 (14.4%) | 42 (20.3%) | 32 (14.3%) |
| Missing | 11 | 6 | 15 |
- 9 month intervention;
- 24 month intervention
There were significantly more dose increases or medication additions in the BI (3.1 ± 3.2) and SI (2.7 ± 3.1) than the control group (0.7 ± 1.0) (p<0.001) during the first 9 months of the study. There were nearly twice as many dose increases or medication additions in the SI compared to the control group in the last year of the study, including at 12 (0.3 ± 0.8 vs. 0.1 ± 0.5, p=0.25), 18 (0.4 ± 1.2 vs. 0.3 ± 0.7, p=0.31) and 24 months (0.3 ± 0.9 vs. 0.2 ± 0.5, p=0.21). This latter finding may demonstrate that providers in the intervention group were attempting to overcome the lower BP control in this group seen at 12 and 18 months that then achieved better BP control at the 24 month visit.
Primary Outcome
BP control was 43% in the intervention groups and 34% in the control group at 9-months (adjusted OR 1.57 [95% CI 0.99–2.50], p = 0.059). Similar results were observed for the set of sensitivity analyses (supplement), as well as a sensitivity analysis that adjusted the models for marital and insurance status (variables with statistically significant baseline differences). Of note, the observed ICC of 0.030 was larger by a factor >10 from the assumed ICC (0.002). As a consequence, only about two-thirds of the desired level of “information” required for the original power analysis was observed at the end of the study, which implies that the actual power of the study was less than the 90% target. This concern was raised by the DSMB, and a subsequent post hoc power calculation using the observed ICC value suggested that the study power remained near 80%. Thus, when interpreting the results of both the primary analysis and the set of sensitivity analyses, there was an observed trend towards an approximate 10% non-statistically significant absolute increase in the rate of BP control in the intervention group.
Secondary Outcomes
There was a significantly greater reduction in adjusted mean systolic and diastolic BP in the intervention groups compared to the control group at 9 months (Table 3). Furthermore, a pre-planned secondary evaluation found that offices with a higher PSS (measure of direct patient management by pharmacists), had a 4.0/2.0 mm Hg lower BP at 9 months (p=0.013 and p=0.016) compared to offices with lower PSS, regardless of study arm.
Table 3.
Mean BP at 9 months
| Variable | Intervention Group |
Control Group |
Adjusted Difference between groups (95% CI) |
p-value |
|---|---|---|---|---|
| All Subjects | N = 345 | N = 194 | ||
| Mean SBP (SD) | 131.6 (15.8) | 138.2 (19.7) | −6.1 (−9.75, −2.39) | 0.002 |
| Mean DBP (SD) | 76.3 (11.1) | 78.0 (14.5) | −2.9 (−4.85, −0.93) | 0.005 |
| Minorities | N = 187 | N = 97 | ||
| Mean SBP (SD) | 133.0 (16.3) | 140.3 (21.4) | −6.4 (−11.16, −1.68) | 0.009 |
| Mean DBP (SD) | 77.9 (10.7) | 78.8 (15.9) | −2.9 (−5.88, −0.08) | 0.044 |
At 9 months, there was no evidence of an interaction between minority status and intervention group on BP control rates, mean SBP/ DBP, suggesting that the effects of the intervention were consistent for minority and non-minority subjects. BP control at 9-months was 37% in minority intervention subjects and 28% in minority control subjects (adjusted OR 1.54 [95% CI 0.83–2.86], p = 0.17). Reductions in adjusted mean systolic and diastolic BP in the intervention groups compared to the control group at 9 months in minority subjects were comparable in magnitude to those observed for the overall population (Table 2). There were also important observed interactions after 9 months, suggesting that the effects over time differed by race. The odds for BP control for minority subjects in the intervention groups were significantly better than the control group at 18 and 24 months (Table 4). Interestingly, the reductions in BP in non-minority subjects seemed to deteriorate in both intervention groups at 12, 18 and 24 months (Table 5), but were sustained in minority subjects (Table 6). For additional data at follow-up visits see the supplement.
Table 4.
BP at Follow Up
| Model |
Brief |
Sustained |
Control |
Adjusted OR (95% CI) p-value Brief vs. Control |
Adjusted OR (95% CI) p-value Sustained vs. Control |
Adjusted OR (95% CI) p-value Brief vs. Sustained |
|---|---|---|---|---|---|---|
| 12 Month | N=194 | N=207 | N=224 | |||
| Non-Minority | 48% | 34% | 40% | 0.93 | 0.66 | 1.41 |
| (0.48, 1.80) 0.82 | (0.32, 1.35) 0.25 | (0.69, 2.87) 0.34 | ||||
| Minority | 38% | 33% | 24% | 2.16 | 1.72 | 1.26 |
| (1.08, 4.33) 0.03 | (0.88, 3.35) 0.11 | (0.64, 2.46) 0.50 | ||||
| 18 Month | N=186 | N=207 | N=219 | |||
| Non-Minority | 46% | 30% | 42% | 1.06 | 0.89 | 1.19 |
| (0.54, 2.07) 0.87 | (0.43, 1.81) 0.74 | (0.58, 2.44) 0.62 | ||||
| Minority | 38% | 39% | 18% | 2.47 | 2.31 | 1.07 |
| (1.22, 5.01) 0.01 | (1.17, 4.56) 0.02 | (0.54, 2.10) 0.85 | ||||
| 24 Month | N=143 | N=195 | N=155 | |||
| Non-Minority | 56% | 53% | 45% | 1.39 | 1.25 | 1.11 |
| (0.68, 2.87) 0.36 | (0.59, 2.63) 0.55 | (0.53, 2.33) 0.77 | ||||
| Minority | 39% | 36% | 19% | 3.25 | 3.27 | 1.00 |
| (1.49, 7.10) 0.003 | (1.57, 6.79) 0.002 | (0.49, 2.03) 0.99 |
Table 5.
Mean BP at follow-up (non-minority subjects)
|
Period (Month) |
Brief Mean (SD) |
Sustained Mean (SD) |
Control Mean (SD) |
Model- Adjusted Difference (95% CI) Brief vs. Control |
Model- Adjusted Difference (95% CI) Sustained vs. Control |
Model-Adjusted Difference (95% CI) Brief vs. Sustained |
|---|---|---|---|---|---|---|
| 12 | ||||||
| SBP | 131.5 (17.1) | 130.5 (16.3) | 136.6 (15.4) | −3.79 (−9.62, 2.04) p = 0.20 | −4.67 (−11.10, 1.74) p = 0.15 | 0.88 (−5.57, 7.33) p = 0.79 |
| DBP | 73.2 (10.8) | 75.7 (12.5) | 77.3 (11.8) | −2.49 (−5.92, 0.94) p = 0.15 | −2.07 (−5.84, 1.71) p = 0.28 | −0.43 (−4.22, 3.37) p = 0.82 |
| 18 | ||||||
| SBP | 130.1 (16.1) | 134.5 (17.7) | 134.6 (14.7) | −3.40 (−9.37, 2.58) p = 0.26 | 1.51 (−4.92, 7.95) p = 0.64 | −4.91 (−11.40, 1.56) p = 0.14 |
| DBP | 73.9 (11.8) | 76.4 (13.3) | 75.9 (11.9) | −0.14 (−3.65, 3.37) p = 0.94 | 0.33 (−3.46, 4.11) p = 0.87 | −0.46 (−4.27, 3.34) p = 0.81 |
| 24 | ||||||
| SBP | 130.3 (18.7) | 126.1 (17.4) | 135.2 (16.9) | −4.91 (−11.40, 1.54) p = 0.13 | −7.90 (−14.70, −1.13) p = 0.020 | 2.99 (−3.64, 9.61) p = 0.37 |
| DBP | 73.6 (12.4) | 72.9 (11.6) | 74.9 (10.2) | −1.45 (−5.23, 2.33) p = 0.45 | −4.33 (−8.32, −0.35) p = 0.033 | 2.88 (−1.01, 6.78) p = 0.15 |
Table 6.
Mean BP at follow-up (minority subjects)
| Period (Month) |
Brief Mean (SD) |
Sustained Mean (SD) |
Control Mean (SD) |
Model- Adjusted Difference (95% CI) Brief vs. Control |
Model- Adjusted Difference (95% CI) Sustained vs. Control |
Model-Adjusted Difference (95% CI) Brief vs. Sustained |
|---|---|---|---|---|---|---|
| 12 | ||||||
| SBP | 134.5 (20.4) | 131.7 (16.3) | 143.2 (20.0) | −6.00 (−12.00, −0.03) p = 0.049 | −9.74 (−15.50, −3.99) p = 0.001 | 3.75 (−2.15, 9.64) p = 0.21 |
| DBP | 77.1 (11.1) | 78.4 (11.7) | 79.8 (13.3) | −3.97 (−7.48, −0.46) p = 0.027 | −3.69 (−7.07, −0.31) p = 0.033 | −0.28 (−3.75, 3.18) p = 0.87 |
| 18 | ||||||
| SBP | 131.6 (18.4) | 130.0 (14.7) | 144.7 (19.5) | −9.96 (−16.10, −3.81) p = 0.002 | −12.70 (−18.50, −6.91) p < 0.001 | 2.76 (−3.33, 8.85) p = 0.37 |
| DBP | 76.8 (12.1) | 75.1 (8.9) | 80.4 (15.9) | −4.22 (−7.84, −0.60) p = 0.023 | −6.52 (−9.93, −3.10) p < 0.001 | 2.29 (−1.28, 5.87) p = 0.21 |
| 24 | ||||||
| SBP | 133.9 (19.9) | 133.4 (19.3) | 144.0 (17.9) | −8.22 (−15.50, −0.94) p = 0.027 | −9.16 (−15.60, −2.68) p = 0.006 | 0.94 (−5.76, 7.63) p = 0.78 |
| DBP | 78.1 (11.8) | 77.7 (11.9) | 81.1 (14.7) | −4.31 (−8.58, −0.04) p = 0.048 | −4.93 (−8.73, −1.14) p = 0.011 | 0.62 (−3.31, 4.54) p = 0.76 |
There were no overall differences in the frequency of subjects reporting any SAE across the three intervention groups. When restricted to SAEs related to the study, no significant trends were observed across the three intervention groups either overall or by type.
Exploratory Outcomes
During the course of the trial, national recommendations for BP control evolved toward higher goals. Therefore, we conducted a secondary analysis to evaluate BP control using the new 2014 hypertension guidelines.26 These guidelines increased the target BP goals for patients with diabetes or CKD to <140/90 mm Hg, and to <150/90 mm Hg for those aged 60 and older. We excluded 138 subjects who would have had controlled BP at baseline using the new guidelines. BP control was achieved in 61% of intervention subjects and 45% of control subjects at 9 months [(adjusted OR, 2.03 [95% CI 1.29–3.22], p=0.003). At the 24-month visit, BP control was 63%, 57% and 46% in the BI, SI and control groups, respectively. The adjusted OR for the BI compared to the control group was 1.84 [95% CI 0.89–3.78], p=0.098) and for the SI to the control group was 1.67 [95% CI 0.86–3.26], p=0.13).
Discussion
The primary outcome for this study was negative. Although there was a 57% greater odds that the intervention improved BP control, this primary result did not attain statistical significance (p=0.059). However, differences in mean BP were pre-specified secondary outcomes. Mean systolic BP was 6.1 mm lower in all subjects and 6.4 mm Hg lower in minority subjects at 9 months in the intervention and control groups, respectively. By 24 months the reduction was 4.9 mm and 7.9 for non-minority subjects and 8.2 mmHg and 9.2 mm Hg in minority subjects in the brief and sustained groups, respectively. The Community Preventive Services Task Force recently evaluated 44 studies of team-based care and found a mean effect of −5.4 mm Hg in systolic BP when compared to usual care.27 A recent review indicated that the strongest evidence for collaborative care was found with pharmacists.8 Another group of investigators updated their previous meta-analysis to include 39 randomized controlled trials in 14, 224 patients and found pharmacist interventions reduced systolic BP −7.6 mm Hg (95% CI: −9.0 to −6.3 mm Hg) compared to usual care. These authors concluded that pharmacist interventions were highly effective but that comparative effectiveness studies with longer duration of follow-up are still needed to determine the most efficient methods of implementation. Our comparative effectiveness trial was designed to address these recommendations and we found similar outcomes to these previous studies suggesting that the effect can be attained in very diverse clinics and patient populations. The most likely explanation for these findings was the greater intensification of BP medications in the intervention groups which was seen in other studies.5, 17
We expected the effect to be less in this effectiveness trial compared to efficacy studies (50–89% control rates).2 BP control might have been more challenging due to the high numbers of subjects with diabetes or CKD needing lower BP goals. The recent U.S. 2014 guidelines recommended higher goals for diabetes, CKD and age 60 and above and BP control rates were similar to expected rates when we considered these new goals.26 The providers were likely aware of the evolving data and might not have pushed doses to the defined goal which was confirmed in our post-hoc analysis.
There are few comparisons of team-based care in minority subjects with non-minorities. This is the first study to demonstrate that an intervention with pharmacists embedded within the medical office could achieve similar reductions in BP across racial groups and that the effect could be sustained. This finding is important since most minority subjects were from urban areas, the stroke belt or near the Rio Grande valley (supplement). Nearly half had annual household income below $25,000, 36% had Medicaid or self-pay insurance and over half had a high school education or less suggesting many of the subjects were socioeconomically disadvantaged. The long-term effect of the intervention was greater in minority subjects than non-minority subjects (Table 5). A nurse-based telephone intervention was found to be effective in African Americans but not in non-Hispanic whites.28 Another study of combined home BP monitoring and a behavioral phone intervention was more effective in non-white patients.29 The reasons for these racial differences require additional investigation.
We found the expected differences in mean SBP levels for non-minority subjects at 24 months for the SI versus control group but not the BI versus control group (−7.9/−4.91, p = 0.02/p=0.13, respectively). However, for minority subjects the mean SBP levels at 24 months were comparable for the BI and SI groups (p=0.78) and both were significantly decreased from the mean SBP levels in the control group (−9.2/−8.2, p=0.006/p=0.03, respectively). One explanation for the continued effect after discontinuation of the intervention is that once medications were intensified, the effect can be sustained.
Strengths of this study included a cluster, randomized trial design, an ITT analysis, control for important covariates and standardized BP measurements. However, there were limitations. First, imbalances occurred in the study arms due to the cluster nature of the design but we controlled for these imbalances. The interclass correlation coefficient (between-clinic variability), was higher than expected resulting in lower power for the primary outcome. Nevertheless, power for the primary endpoint remained substantial at 80%. Our power was somewhat lower at the follow-up visits when some subjects dropped out or were lost to follow-up. Funding constraints by the sponsor resulted in premature termination in some subjects (approved by the DSMB), which reduced power at 18 and 24 months. Even so, significant differences in mean BP, especially in the minority subjects, persisted at these time points. Patients, providers and intervention pharmacists could not be masked and the study is only generalizable to similar primary care medical offices.
Conclusions
This study was not able to conclude significant differences between the three groups for the primary endpoint of BP control following a 9-month pharmacy intervention. However, the trend was in the right direction and significant improvement was observed in the key secondary endpoint of mean BP. Mean BP and control rates seemed to deteriorate in non-minorities at 12, 18 and 24 months but were maintained in minority subjects after the intervention was discontinued in the 9-month intervention group. These findings suggest that an established team-based care model involving pharmacists can be adopted in a large number of offices to reduce racial disparities in BP control.
Supplementary Material
Acknowledgments
We acknowledge the assistance of the SCs, pharmacists and physicians from the CAPTION trial medical offices (Supplement).
Sources of Funding: National Heart, Lung, and Blood Institute, RO1HL091841 and R01HL091843.
Footnotes
Disclosures:
All authors: None
References
- 1.Carter BL, Bosworth HB, Green BB. The Hypertension Team: The Role of the Pharmacist, Nurse, and Teamwork in Hypertension Therapy. J Clin Hypertens. 2012;14:51–65. doi: 10.1111/j.1751-7176.2011.00542.x. [DOI] [PMC free article] [PubMed] [Google Scholar]
- 2.Carter BL, Rogers M, Daly J, Zheng S, James PA. The potency of team-based care interventions for hypertension: a meta-analysis. Arch Intern Med. 2009;169:1748–1755. doi: 10.1001/archinternmed.2009.316. [DOI] [PMC free article] [PubMed] [Google Scholar]
- 3.Carter BL, Bergus GR, Dawson JD, Farris KB, Doucette WR, Chrischilles EA, Hartz AJ. A Cluster Randomized Trial to Evaluate Physician/Pharmacist Collaboration to Improve Blood Pressure Control. J Clin Hypertens. 2008;10:260–271. doi: 10.1111/j.1751-7176.2008.07434.x. [DOI] [PMC free article] [PubMed] [Google Scholar]
- 4.Carter BL, Ardery G, Dawson JD, James PA, Bergus GR, Doucette WR, Chrischilles EA, Franciscus CL. Physician and pharmacist collaboration to improve blood pressure control. Arch Intern Med. 2009;169:1996–2002. doi: 10.1001/archinternmed.2009.358. [DOI] [PMC free article] [PubMed] [Google Scholar]
- 5.Chen Z, Ernst ME, Ardery G, Xu Y, Carter BL. Physician-pharmacist co-management and 24-hour blood pressure control. J Clin Hypertens. 2013;15:337–343. doi: 10.1111/jch.12077. [DOI] [PMC free article] [PubMed] [Google Scholar]
- 6.Zillich AJ, Sutherland JM, Kumbera PA, Carter BL. Hypertension outcomes through blood pressure monitoring and evaluation by pharmacists (HOME study) J Gen Intern Med. 2005;20:1091–1096. doi: 10.1111/j.1525-1497.2005.0226.x. [DOI] [PMC free article] [PubMed] [Google Scholar]
- 7.Santschi V, Chiolero A, Colosimo AL, Platt RW, Taffe P, Burnier M, Burnand B, Paradis G. Improving blood pressure control through pharmacist interventions: a meta-analysis of randomized controlled trials. J Am Heart Assoc. 2014;3:e000718. doi: 10.1161/JAHA.113.000718. [DOI] [PMC free article] [PubMed] [Google Scholar]
- 8.Houle SK, Chatterley T, Tsuyuki RT. Multidisciplinary approaches to the management of high blood pressure. Curr Opin Cardiol. 2014;29:344–353. doi: 10.1097/HCO.0000000000000071. [DOI] [PubMed] [Google Scholar]
- 9.Wentzlaff DM, Carter BL, Ardery G, Franciscus CL, Doucette WR, Chrischilles EA, Rosenkrans KA, Buys LM. Sustained blood pressure control following discontinuation of a pharmacist intervention. J Clin Hypertens. 2011;13:431–437. doi: 10.1111/j.1751-7176.2011.00435.x. [DOI] [PMC free article] [PubMed] [Google Scholar]
- 10.Carter BL, Doucette WR, Franciscus CL, Ardery G, Kluesner KM, Chrischilles EA. Deterioration of blood pressure control after discontinuation of a physician-pharmacist collaborative intervention. Pharmacotherapy. 2010;30:228–235. doi: 10.1592/phco.30.3.228. [DOI] [PMC free article] [PubMed] [Google Scholar]
- 11.Lee JK, Grace KA, Taylor AJ. Effect of a pharmacy care program on medication adherence and persistence, blood pressure, and low-density lipoprotein cholesterol: a randomized controlled trial. JAMA. 2006;296:2563–2571. doi: 10.1001/jama.296.21.joc60162. [DOI] [PubMed] [Google Scholar]
- 12.Carter BL, Clarke W, Ardery G, Weber CA, James PA, Vander Weg M, Chrischilles EA, Vaughn T, Egan BM. A cluster-randomized effectiveness trial of a physician-pharmacist collaborative model to improve blood pressure control. Circ Cardiovasc Qual Outcomes. 2010;3:418–423. doi: 10.1161/CIRCOUTCOMES.109.908038. [DOI] [PMC free article] [PubMed] [Google Scholar]
- 13.Dickerson LM, Kraus C, Kuo GM, Weber CA, Bazaldua OV, Tovar JM, Hume AL, Ives TJ, Gums JG, Carter BL. Formation of a primary care pharmacist practice-based research network. Am J Health Syst Pharm. 2007;64:2044–2049. doi: 10.2146/ajhp060650. [DOI] [PubMed] [Google Scholar]
- 14.Billups SJ, Okano G, Malone D, Carter BL, Valuck R, Barnette DJ, Sintek CD. Assessing the structure and process for providing pharmaceutical care in Veterans Affairs medical centers. Am J Health Syst Pharm. 2000;57:29–39. doi: 10.1093/ajhp/57.1.29. [DOI] [PubMed] [Google Scholar]
- 15.Malone DC, Carter BL, Billups SJ, Valuck RJ, Barnette DJ, Sintek CD, Okano GJ, Ellis S, Covey D, Mason B, Jue S, Carmichael J, Guthrie K, Sloboda L, Dombrowski R, Geraets DR, Amato MG. An economic analysis of a randomized, controlled, multicenter study of clinical pharmacist interventions for high-risk veterans: the IMPROVE study. Impact of Managed Pharmaceutical Care Resource Utilization and Outcomes in Veterans Affairs Medical Centers. Pharmacotherapy. 2000;20:1149–1158. doi: 10.1592/phco.20.15.1149.34590. [DOI] [PubMed] [Google Scholar]
- 16.Gums TH, Carter BL, Milavetz G, Buys L, Rosenkrans K, Uribe L, Coffey C, MacLaughlin EJ, Young RB, Ables AZ, Patel-Shori N, Wisniewski A. Physician-pharmacist collaborative management of asthma in primary care. Pharmacotherapy. 2014;34:1033–1042. doi: 10.1002/phar.1468. [DOI] [PMC free article] [PubMed] [Google Scholar]
- 17.Von Muenster SJ, Carter BL, Weber CA, Ernst ME, Milchak JL, Steffensmeier JJ, Xu Y. Description of pharmacist interventions during physician-pharmacist co-management of hypertension. Pharm World Sci. 2008;30:128–135. doi: 10.1007/s11096-007-9155-6. [DOI] [PubMed] [Google Scholar]
- 18.Chobanian AV, Bakris GL, Black HR, Cushman WC, Green LA, Izzo JL, Jr, Jones DW, Materson BJ, Oparil S, Wright JT, Jr, Roccella EJ. The Seventh Report of the Joint National Committee on Prevention, Detection, Evaluation, and Treatment of High Blood Pressure: the JNC 7 report. JAMA. 2003;289:2560–2572. doi: 10.1001/jama.289.19.2560. [DOI] [PubMed] [Google Scholar]
- 19.Carter BL, Coffey CS, Uribe L, James PA, Egan BM, Ardery G, Chrischilles EA, Ecklund D, Vander Weg M, Vaughn T. Similar blood pressure values across racial and economic groups: baseline data from a group randomized clinical trial. J Clin Hypertens. 2013;15:404–412. doi: 10.1111/jch.12091. [DOI] [PMC free article] [PubMed] [Google Scholar]
- 20.Wright JT, Jr, Bakris G, Greene T, Agodoa LY, Appel LJ, Charleston J, Cheek D, Douglas-Baltimore JG, Gassman J, Glassock R, Hebert L, Jamerson K, Lewis J, Phillips RA, Toto RD, Middleton JP, Rostand SG. Effect of blood pressure lowering and antihypertensive drug class on progression of hypertensive kidney disease: results from the AASK trial. JAMA. 2002;288:2421–2431. doi: 10.1001/jama.288.19.2421. [DOI] [PubMed] [Google Scholar]
- 21.Pickering TG, Hall JE, Appel LJ, Falkner BE, Graves J, Hill MN, Jones DW, Kurtz T, Sheps SG, Roccella EJ. Recommendations for blood pressure measurement in humans and experimental animals: Part 1: blood pressure measurement in humans: a statement for professionals from the Subcommittee of Professional and Public Education of the American Heart Association Council on High Blood Pressure Research. Hypertension. 2005;45:142–161. doi: 10.1161/01.HYP.0000150859.47929.8e. [DOI] [PubMed] [Google Scholar]
- 22.Morisky DE, Green LW, Levine DM. Concurrent and predictive validity of a self-reported measure of medication adherence. Med Care. 1986;24:67–74. doi: 10.1097/00005650-198601000-00007. [DOI] [PubMed] [Google Scholar]
- 23.Morisky DE, Levine DM, Green LW, Shapiro S, Russell RP, Smith CR. Five-year blood pressure control and mortality following health education for hypertensive patients. Am J Public Health. 1983;73:153–162. doi: 10.2105/ajph.73.2.153. [DOI] [PMC free article] [PubMed] [Google Scholar]
- 24.K/DOQI clinical practice guidelines for chronic kidney disease: evaluation, classification, and stratification. Am J Kidney Dis. 2002;39(2) Suppl 1:S1–S266. [PubMed] [Google Scholar]
- 25.Donner A, Klar N. Statistical considerations in the design and analysis of community intervention trials. J Clin Epidemiol. 1996;49:435–439. doi: 10.1016/0895-4356(95)00511-0. [DOI] [PubMed] [Google Scholar]
- 26.James PA, Oparil S, Carter BL, Cushman WC, Dennison-Himmelfarb C, Handler J, Lackland DT, LeFevre ML, MacKenzie TD, Ogedegbe O, Smith SC, Jr, Svetkey LP, Taler SJ, Townsend RR, Wright JT, Jr, Narva AS, Ortiz E. 2014 evidence-based guideline for the management of high blood pressure in adults: report from the panel members appointed to the Eighth Joint National Committee (JNC 8) JAMA. 2014;311:507–520. doi: 10.1001/jama.2013.284427. [DOI] [PubMed] [Google Scholar]
- 27.Proia KK, Thota AB, Njie GJ, Finnie RK, Hopkins DP, Mukhtar Q, Pronk NP, Zeigler D, Kottke TE, Rask KJ, Lackland DT, Brooks JF, Braun LT, Cooksey T. Team-Based Care and Improved Blood Pressure Control: A Community Guide Systematic Review. Am J Prev Med. 2014;47:86–99. doi: 10.1016/j.amepre.2014.03.004. [DOI] [PMC free article] [PubMed] [Google Scholar]
- 28.Jackson GL, Oddone EZ, Olsen MK, Powers BJ, Grubber JM, McCant F, Bosworth HB. Racial differences in the effect of a telephone-delivered hypertension disease management program. J Gen Intern Med. 2012;27:1682–1689. doi: 10.1007/s11606-012-2138-x. [DOI] [PMC free article] [PubMed] [Google Scholar]
- 29.Bosworth HB, Olsen MK, Grubber JM, Powers BJ, Oddone EZ. Racial differences in two self-management hypertension interventions. Am J Med. 2011;124:468, e461–e468. doi: 10.1016/j.amjmed.2010.11.024. [DOI] [PMC free article] [PubMed] [Google Scholar]
Associated Data
This section collects any data citations, data availability statements, or supplementary materials included in this article.