

Abstract
Aims/hypothesis
Pantothenate kinase (PanK) is the first enzyme in coenzyme A (CoA) biosynthesis. Pank1-deficient mice have 40% lower liver CoA and fasting hypoglycaemia that results from reduced gluconeogenesis. Single-nucleotide polymorphisms in the human PANK1 gene are associated with insulin levels suggesting a link between CoA and insulin homeostasis. We determined whether Pank1 deficiency 1) modified insulin levels, 2) ameliorated hyperglycaemia and hyperinsulinemia, and 3) improved acute glucose and insulin tolerance of leptin (Lep)-deficient mice.
Methods
Serum insulin and responses to glucose and insulin tolerance tests were determined in Pank1-deficient mice. Levels of CoA and regulating enzymes were measured in liver and skeletal muscle of Lep-deficient mice. Double Pank1/Lep-deficient mice were analysed for the diabetes-related phenotype and global metabolism.
Results
Pank1-deficient mice had lower serum insulin and improved glucose tolerance and insulin sensitivity compared to wild-type mice. Hepatic and muscle CoA was abnormally high in Lep-deficient mice. Pank1 deletion reduced hepatic CoA but not muscle CoA, reduced serum glucose and insulin, but did not normalize body weight or improve acute glucose tolerance or protein kinase B (Akt) phosphorylation in Lep-deficient animals. Pank1/Lep double-deficient mice exhibited reduced whole-body metabolism of fatty acids and amino acids and had a greater reliance on carbohydrate utilization for energy production.
Conclusions/interpretation
The results indicate that Pank1 deficiency drives a whole-body metabolic adaptation that improves aspects of the diabetic phenotype and uncouples hyperglycaemiaand hyperinsulinemia from obesity in leptin-deficient mice.
Keywords: coenzyme A, fuel oxidation, hyperglycaemia, leptin-deficient mice
Introduction
Elevated gluconeogenesis is central to hyperglycaemia in type 2 diabetes [1], and suppression of this pathway by the widely used drug metformin is effective in reducing blood glucose [2]. Gluconeogenesis and fatty acid oxidation during fasting are interrelated [3], and the CoA supply in the liver was recently identified as a mediator of the two processes [4].
CoA is an essential cofactor required for the metabolism of carbohydrates, amino acids, fatty acids and ketone bodies for energy production, and for multiple synthetic processes, including sterol, bile acid, fatty acid and complex lipid biosynthesis [5]. Tissue CoA levels are tightly regulated and adjust to the metabolic state by a balance between synthesis and degradation. Nudix hydrolase 7 (Nudt7) degrades short-chain acyl-CoAs [6], and is negatively regulated by peroxisome proliferator-activated receptor α [7]. CoA synthesis starts with phosphorylation of pantothenic acid (vitamin B5) by pantothenate kinase (PanK). Four mammalian PanK isoforms encoded by three genes [8] regulate CoA biosynthesis through differential isoform expression in tissues [4,9,10], differential sensitivity to feedback inhibition by acyl-CoAs [8,11–13], selective activation by metabolites [11,14], and subcellular localization [12,15]. Although the PanK enzymes are located in cytosol, nucleus or mitochondria [15], the latter steps in CoA synthesis occur in the cytosol [16] and CoA is transported into mitochondria [17–19] for use in oxidative reactions. The Pank1 gene encodes PanK1α and PanK1β, the PanK isoforms least sensitive to feedback regulation by acetyl-CoA [5,13], and is required for the hepatic CoA increase during the switch from glucose to fatty acid oxidation that occurs in the fasted state [4]. Liver and kidney express PanK1β in highest abundance and are characterized by the highest CoA levels [13,20]. PanK2 and PanK3 are abundant isoforms in brain [12] and a human neurodegenerative disease is associated with mutations in the hPANK2gene [21].
Fatty acid oxidation relies heavily on the availability of free CoA to produce acetyl-CoA from long-chain acyl-CoA breakdown. Acetyl-CoA, in turn, is an activator of pyruvate carboxylase, the first enzyme in gluconeogenesis. Acyl-CoA catabolism additionally produces NADH and is linked to ATP production, both of which are required for gluconeogenesis. Reduction of hepatic CoA due to Pank1 deficiency [4] or chemical inhibition of all the PanK isoforms [20] results in reduced fatty acid oxidation and hypoglycaemia, thus demonstrating that modulation of CoA has a direct impact on glucose production. In particular, Pank1-deficient mice are unable to convert pyruvate, oxaloacetate or glycerol to glucose [4], although transcription of key enzymes increases as expected in the fasted state to support gluconeogenesis. Thus, PanK1 may be a suitable target for intervention in disorders with deregulated gluconeogenesis and hyperglycaemia such as type 2 diabetes.
An association between polymorphisms in the PANK1 gene and insulin levels was recently uncovered in a birth cohort from the most genetically isolated regions of Finland [22]. We tested the hypothesis that reduction of CoA levels by global deletion of Pank1 could mitigate the hyperglycaemia and hyperinsulinemia of diabetic mice. We used the ob/ob mouse, an established model to investigate the metabolic disturbances leading to type 2 diabetes [23]. The ob/ob mouse is leptin-deficient (Lep−/−) [24] and characterized by obesity, hyperglycaemia, hyperinsulinemia and insulin resistance [25]. We generated Lep−/− mice that were deficient in Pank1 expression and compared their diabetic phenotype and whole-body metabolismto the Lep −/− mice.
Methods
Animals
Animal experiments were approved by the St. Jude Children’s Research Hospital Institutional Animal Care and Use Committee (protocol 323). Male mice, age 10–16 weeks, were maintained at 22±2°C; humidity 50%±10%; 14h light, 10h dark cycle. Pank1−/− [4] and Pank1+/+ littermates were fed LabDiet 5013 (St. Lois, MO, USA) containing 6% fat. Pank1−/−Lep−/− and Pank1+/+Lep−/− littermates, derived in the St. Jude Animal Resource Centre from breeding B6.Lep+/− mice (Jackson Laboratory, Bar Harbor, ME, USA) with Pank1−/− mice (71–74% C57BL/6J x 129Sv) [4], were fed LabDiet 5K20 containing 10% fat. Indirect calorimetry measured oxygen consumption (VO2) and carbon dioxide production (VCO2) using a 4-chamber Oxymax (Columbus Instruments, Columbus, OH, USA).
Serum parameters, glucose and insulin tolerance tests
Blood glucose was measured using a glucometer (FreeStyle, Abbott Diabetes Care, Alameda, CA, USA); insulin was measured using an ELISA kit (Crystal Chem, Downers Grove, IL, USA); lactate and β-hydroxybutyrate were determined using a GM7 Micro-Stat analyser (Analox Instruments, London, UK); free fatty acids were determined using a Biovision (Milipitas, CA, USA) assay kit; triglycerides and cholesterol were analysed by the St. Jude Veterinary Pathology Core, amino acids were measured by the University of California at Davis Proteomic Core. Prior to OGTT with 2 g/Kg glucose, Pank1+/+ and Pank1−/− mice were fasted overnight. Prior to OGTT with 0.25 g/Kg glucose Pank1+/+Lep−/− and Pank1−/−Lep−/− mice were fasted 24h. For insulin tolerance tests (ITT) with 0.75 U/Kg insulin (Humulin R, Eli Lilly, Indianapolis, IN, USA) i.p., Pank1+/+ and Pank1−/− mice were fasted overnight. For ITT with 7.5 U/Kg, Pank1+/+Lep−/− and Pank1−/−Lep−/− mice were fasted 6h. For alanine tolerance tests with 0.25g/Kg i.p., Pank1+/+Lep−/− and Pank1−/−Lep−/− mice were fasted 24h. AUC for individual mice were reported as the mean ± SEM and was calculated using initial blood glucose as baseline. For ITT, individual glucose curves were normalized to initial blood glucose set to 100 and AUC calculated using y=0 as baseline.
Tissue measurements
Tissues were frozen in liquid nitrogen and stored at −80°C. Glycogen [26] was quantified with a Biovision kit (Milipitas, CA, USA). Liver triglycerides and cholesterol were quantified using an Iatroscan (Shell-usa, Spotsylvania, VA, USA). CoA levels were determined as described [12] or [27,28]. DNA was quantified as described [29]. Glycogen, triglycerides, cholesterol and CoA were normalized to DNA. Carnitines were determined as described [4]. Transcripts were quantified by real time RT-qPCR with primers as described [4,9] and as follows: Carnitine palmitoyltransferase 1α (Cpt1α) Cpt1α-forward ACGCATGACAGCACTGGCCC, Cpt1α-reverse CCTCCCCAGGGATGCGGGAA; long-chain acyl-CoA dehydrogenase (Acadl) Acadl-forward CTTGCTTGGCATCAACATCGCAGA, Acadl-reverse ATTGGAGTACGCTTGCTCTTCCCA.
Enzyme activities
Hepatic PanK activity and fatty acid oxidation were measured as described [4,30]. 14C-palmitic acid oxidation was calculated from the slope of three time points, peroxisome oxidation was determined following 5 min pre-incubation with 50 μmol/l antimycin A and 10 μmol/l rotenone, and mitochondrial oxidation was calculated as the difference with and without inhibitors. 14C-labeled acid soluble metabolites (ASM) were assessed by scintillation counting. 14Carbon dioxide accounted for ≤ 2% of oxidized 14C-palmitic acid and was not included in the calculations.
Hepatocyte isolation
Hepatocytes were isolated from overnight fasted mice and suspended at 0.8–1 x 10⁶ cells/ml in buffer without glucose [31], with or without 2 mmol/l pyruvate or 2 mmol/l pyruvate plus 20 mmol/l lactate. Suspensions were incubated at 37°C with moderate shaking for 2h with >90% viability. Hepatocytes were centrifuged at 1000g for 6 min, and supernatant glucose was quantified using an assay kit (Sigma-Aldrich, St. Louis, MO, USA).
Immunoblotting
The antibody against full-length mouse Nudt7 was raised in rabbit, and used at 1:10,000 dilution. The β-actin antibody (Sigma-Aldrich) was used at 1:5000 dilution. The Gapdh (glyceraldehyde phosphate dehydrogenase) antibody (Abcam, Cambridge, MA, USA) was used at 1:3000 dilution. The Akt and phosphor-Akt antibodies (Cell Signaling Technology, Danvers, MA, USA) were used at 1:1000 dilution.
Statistical analysis
Statistical significance was calculated by unpaired two-tailed Student’s t test using GraphPad Prism 5 (GraphPad Software, La Jolla, CA, USA).
Results
Reduced serum insulin and improved insulin tolerance in Pank1−/− mice
Insulin was 50% lower in fasted Pank1−/− mice (0.21 ± 0.04 ng/ml, n=11) compared to wild-type mice (0.42 ± 0.06 ng/ml, n=13, p=0.007). The Pank1−/− mice cleared a glucose bolus faster than wild type controls (Fig. 1a and b) while maintaining insulin levels that were similar to wild-type mice for up to 30 min after glucose injection (mean value of 0.5 ng/ml, n=4–8 per genotype), consistent with improved glucose uptake. The mice additionally exhibited improved insulin tolerance (Fig. 1c and d). These data indicated a relationship between PanK1 and insulin homeostasis in mice, consistent with results of a human genome-wide association study [22].
Fig. 1.

Mice lacking Pank1 exhibit improved glucose and insulin tolerance. Pank1−/− (white circles and bars, n=8–10) and control mice(black circles and bars, n=7–10)were fasted overnight and blood glucose monitored at indicated times following the administration of glucose (a and b) or insulin (c and d). Initial blood glucose for the ITT was 4.5±0.2 mmol/l for control mice and 2.7±0.3 mmol/l for Pank1−/− mice (p=0.007). Values arethe mean ± SEM * p<0.05, *** p<0.001.
Deregulated hepatic CoA levels in Lep−/− mice
Hepatic CoA content was ~2-fold higher in fed leptin-deficient animals compared to non-obese littermates whereas fasted CoA was equivalent (Fig. 2a). These observations were similar to those reported previously for the db/db mice [32]. Pank transcript expression was not significantly different between genotypes (Fig. 2b), but PanK activity, representing the total amount of PanK protein, was about 30% higher (Fig. 2c) in Lep−/− mice (specific activities 11.8 ± 0.8 vs. 8.1 ± 1.0 pmol min−1 mg−1 protein, n=3/genotype, p=0.009). The relative Pank transcript abundance was very similar to Lep+/+ liver [4] and the modestly higher PanK activity in the Lep−/− liver could be due to alteration of either protein stability or post-translational modification of any of the four PanK isoforms. Nudt7 transcripts were down regulated 10-fold (Fig. 2b) and Nudt7 protein was also reduced in Lep−/− mice (Fig. 2d). Fasting CoA levels increased as expected in the controls but were unchanged in the Lep−/− mice (Fig. 2a). The elevated CoA in fed Lep−/− mice correlated with higher PanK activity and reduced Nudt7 expression and, from a CoA perspective, the data suggested that the Lep−/− liver was in a chronically ‘fasted’ state, even when the animals were fed.
Fig. 2.

Leptin-deficient mice exhibit higher hepatic CoA levels in the fed state. Leptin-deficient mice (white bars) and non-obese controls (black bars) were analyzed fed and after a 48h fast. (a) Liver total CoA (n=4/genotype). (b) Relative mRNA levels for Pank isoforms and Nudt7 (n=5/genotype). (c) All phosphorylated derivatives of radiolabelled pantothenate added to the liver homogenate were measured and reported as PanK activity in fed (black) and fasted (white) Lep−/− mice (squares) and non-obese controls (circles) (n=3/genotype). (d) Western blot of hepatic Nudt7 protein (n=3/genotype) and β-Actin as loading control. Values are the mean ± SEM. * comparison between Lep−/− and non-diabetic mice under similar nutritional conditions; † comparison between fed and fasted mice of same genotype. ** or †† p<0.01, *** or ††† p<0.001.
Reduced CoA levels, fatty acid β-oxidation and gluconeogenesis in Pank1−/−Lep−/− mice
The reduced insulin levels and improved glucose and insulin tolerance of the Pank1−/− mice (Fig. 1), together with elevated hepatic CoA levels in the Lep−/− mice (Fig. 2), prompted us to derive Pank1-deficient Lep−/− mice to evaluate the effect on CoA-mediated fatty acid catabolism and glucose production. Pank1-deficiency in Lep−/− mice resulted in lower hepatic CoA both in the fed state and after an overnight fast (Fig. 3a). The levels of free CoA were reduced in Pank1−/−Lep−/− mice whereas short-chain and long-chain acyl-CoAs were not significantly different between genotypes and nutritional states (Supplementary Fig. S1). Transcript abundance of the Pank2, Pank3 or Nudt isoforms was not significantly different between the genotypes (Table 1). The rates of hepatic fatty acid βoxidation from 14C-palmitic acid were measured without addition of exogenous CoA and were significantly lower in Pank1−/−Lep−/− mice in both the fed and fasted states, where mitochondrial βoxidation was selectively affected (Fig. 3b). The liver carnitine profiles confirmed that Pank1-deficiency resulted in chronically reduced fatty acid oxidation in Lep−/− mice, as unmetabolized fatty acids were off-loaded from acyl-CoAs to acyl-carnitines. Free carnitine was not limiting in livers from Pank1−/−Lep−/− mice (Fig 3c), and significant accumulation of long-chain acylcarnitines in the fed (C14, C18) and fasted state (C16, C16:1, C18, C18:1, C18:2) was consistent with a partial block and reduced rate of fatty acid oxidation (Fig. 3e). On the other hand, the mRNAs for carnitine palmitoyl transferase alpha (Cpt1a), long-chain acyl-CoA dehydrogenase (Acadl) or peroxisome proliferator-activated receptor alpha (Pparg1a) were the same between genotypes (Table 2), indicating that the transcriptional program for fatty acid breakdown and utilization was intact.
Fig. 3.

Reduced hepatic CoA and fatty acid β-oxidation in Pank1−/−Lep−/− mice. Fed and overnight fasted mice were analyzed for liver CoA, β-oxidation capacity and carnitine levels. Black bars, Pank1+/+Lep−/− mice; white bars, Pank1−/−Lep−/− mice. (a) Total liver CoA (n=7/genotype). (b) Measurement of acid-soluble metabolites (ASM) derived from the oxidation of 14C-palmitic acid in liver mitochondria and peroxisomes (n=4–7/genotype). (c–e) Analysis of hepatic free and acylcarnitines(n=4/genotype). Values are the mean ± SEM. * p< 0.05, ** p<0.01, *** p<0.001.
Table 1.
mRNA abundance of selected enzymes relative to Gapdh in liver and muscle.
| Enzyme | Liver | Muscle | ||
|---|---|---|---|---|
| Pank1+/+ Lep−/− | Pank1−/− Lep−/− | Pank1+/+ Lep−/− | Pank1−/− Lep−/− | |
| Pank1α | 0.0020 ± 0.0001 | - | 0.001 ± 0.001 | |
| Pank1β | 0.047 ± 0.005 | - | 0.0003 ± 0.0002 | |
| Pank2 | 0.005 ± 0.001 | 0.005 ± 0.001 | 0.003 ± 0.001 | 0.005 ± 0.001 |
| Pank3 | 0.018 ± 0.001 | 0.015 ± 0.001 | 0.008 ± 0.001 | 0.009 ± 0.001 |
| Nudt7 | 0.020 ± 0.002 | 0.029 ± 0.005 | 0.002 ± 0.001 | 0.002 ± 0.001 |
| Nudt19 | 0.0010 ± 0.0003 | 0.0006 ± 0.0001 | 0.0002 ± 0.0001 | 0.0002 ± 0.0001 |
The data are the means of 4–6 fed mice per group ± SEM.
Table 2.
mRNA abundance of selected enzymes relative to Gapdh in liver.
| Enzyme | Fed | Fasted | ||
|---|---|---|---|---|
| Pank1+/+ Lep−/− | Pank1−/− Lep−/− | Pank1+/+ Lep−/− | Pank1−/− Lep−/− | |
| Pepck | 0.106 ± 0.012 | 0.151 ± 0.027 | 0.289 ± 0.053 ## | 0.317 ± 0.058 # |
| G6pc | 0.084 ± 0.009 | 0.148 ± 0.048 | 0.138 ± 0.048 | 0.160 ± 0.040 |
| Cpt1α | 0.012 ± 0.001 | 0.014 ± 0.002 | 0.038 ± 0.003 ## | 0.039 ± 0.005 ## |
| Acadl | 0.022 ± 0.001 | 0.022 ± 0.001 | 0.040 ± 0.004 ## | 0.052 ± 0.007 ## |
| Ppargα | 0.041 ± 0.004 | 0.040 ± 0.003 | 0.071 ± 0.008 ## | 0.072 ± 0.008 ## |
The data are the mean of 4–6 mice per group ± SEM.
Significant differences between fed and overnight fasted animals of the same genotype are indicated by #, and between genotypes with the same nutritional status are indicated by *.
or *p<0.05,
or ** p<0.01.
Pank1-deficiency led to a dramatic reduction in gluconeogenic capacity without altering the transcription of the key enzymes phosphoenolpyruvate carboxykinase 1 (Pck1) and glucose-6-phosphatase (G6pc) (Table 2). Glucose production was substantially reduced following an acute challenge with the amino acid alanine (Fig. 4a and b), a gluconeogenic precursor used by the liver almost exclusively [33]. Glucose production from hepatocytes isolated from Pank1−/−Lep−/− mice was also dramatically reduced compared to hepatocytes from Pank1+/+Lep−/− mice (Fig. 4c). Altogether, these data indicated that the CoA supply for fatty acid oxidation became limiting following deletion of Pank1 in Lep−/− mice which, in turn, reduced glucose production from hepatocytes.
Fig. 4.
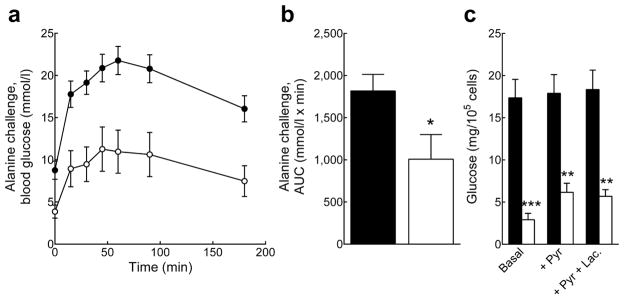
Reduced hepatic gluconeogenesis in Pank1−/−Lep−/− mice. Black circles and bars, Pank1+/+Lep−/− mice; white circles and bars, Pank1−/−Lep−/− mice. (a and b) In vivo glucose production from alanine (n=11–15/genotype). (c) Gluconegenesis measured in isolated hepatocytes (n=4–5/genotype). Values are means± SEM. * p<0.05, ** p<0.01, *** p<0.001.
Pank1-deficiency reduced chronic hyperglycaemia and hyperinsulinemia in Lep−/− mice without changing body weight or insulin resistance
No difference in body weight or food intake was observed between Pank1−/−Lep−/− and Pank1+/+Lep−/− littermate controls (Fig. 5a and b). However, Pank1-deficiency resulted in dramatically reduced blood glucose and lactate in the fed state, and reduced glucose and insulin after an overnight fast (Table 3). These data indicated that the chronic hyperglycaemia and hyperinsulinemia associated with the type 2 diabetic state were significantly improved despite chronic obesity. Muscle glycogen stores were significantly depleted in fasted Pank1−/−Lep−/− mice, and a trend towards lower hepatic glycogen was evident (Table 3), suggesting enhanced glucose utilization. However, unlike the Pank1−/− mice, the Pank1−/−Lep−/− mice did not exhibit an improved response to a glucose bolus (Fig. 5c and d). The acute response of Pank1−/−Lep−/− mice to insulin was only slightly improved at best (Fig. 5e and f) and examination of Akt phosphorylation as an indicator of insulin signalling did not demonstrate a difference between the responses of either liver or muscle in Pank1+/+Lep−/− and Pank1−/−Lep−/− mice (Fig. 6a).
Fig. 5.

Pank1-deficiency does not alter body weight or glucose tolerance in Lep−/− mice. Black circles and bars, Pank1+/+Lep−/− mice; white circles and bars, Pank1−/−Lep−/− mice. (A) Weekly body weight measurement up to 16 weeks of age (n=10/genotype). (B) Food intake was monitored daily for 4 consecutive days and averaged (3–5 mice/cage, 3 cages/genotype). (C and D) OGTT and AUC (n=9/genotype). (e and f) ITT and AUC (n=15/genotype). The initial blood glucose for the ITT was 10.9±1.3 and 6.5±1.1 mmol/l for Pank1+/+Lep−/− and Pank1−/−Lep−/− mice (p=0.019), respectively.
Table 3.
Analytes in blood and tissue of Pank1+/+Lep−/− and Pank1−/−Lep−/− mice.
| Analytes | Pank1+/+ Lep−/− | Pank1−/− Lep−/− |
|---|---|---|
| Glucose, fed | 321 ± 38 mg/dL (10) | 169 ± 16 mg/dL (14)*** |
| Glucose, ON fasted | 188 ± 32 mg/dL (6) | 58 ± 13 mg/dL (7)** |
| Glucose, 48 h fasted | 71 ± 14 mg/dL (7) | 73 ± 17 mg/dL (7) |
| Insulin, fed | 14.4 ± 4.4 ng/ml (9) | 23.6 ± 7.8 ng/ml (10) |
| Insulin, ON fasted | 2.4 ± 0.6 ng/ml (9) | 1.1 ± 0.3 ng/ml (11)* |
| Lactate, fed | 13.6 ± 0.9 mM (6) | 7.7 ± 0.7 (5) mM *** |
| Lactate, ON fasted | 10.8 ± 0.8 mM (8) | 9.8 ± 0.8 mM (8) |
| β-Hydroxybutyrate, fed | 0.56 ± 0.02 mM (6) | 0.52 ± 0.02 mM (5) |
| β-Hydroxybutyrate, ON fasted | 0.87 ± 0.06 mM (5) | 1.20 ± 0.04 mM (5)** |
| Free fatty acids, fed | 1.08 ± 0.16 mM (8) | 1.11 ± 0.11 mM (4) |
| Free fatty acids, ON fasted | 0.92 ± 0.07 mM (6) | 1.39 ± 0.11 mM (6)* |
| Triglycerides, fed | 249 ± 14 mg/dL (5) | 217 ± 14 mg/dL (5) |
| Triglycerides, ON fasted | 290 ± 30 mg/dL (10) | 248 ± 34 mg/dL (10) |
| Cholesterol, fed | 346 ± 17 mg/dL (5) | 310 ± 39 mg/dL (5) |
| Cholesterol, ON fasted | 306 ± 9 mg/dL (5) | 257 ± 9 mg/dL (5)** |
| Liver triglycerides, fed | 395 ± 178 μg/μg DNA (5) | 474 ± 197 μg/μg DNA (5) |
| Liver cholesterol, fed | 4.5 ± 0.9 μg/μg DNA (5) | 3.9 ± 0.9 μg/μg DNA (5) |
| Liver glycogen, fed | 22 ± 5 μg/μg DNA (8) | 17 ± 4 μg/μg DNA (8) |
| Liver glycogen, ON fasted | 23 ± 4 μg/μg DNA (6) | 15 ± 5 μg/μg DNA (5) |
| Muscle glycogen, fed | 3.4 ± 0.8 μg/μg DNA (5) | 4.3 ± 0.8 μg/μg DNA (7) |
| Muscle glycogen, ON fasted | 2.7 ± 0.5 μg/μg DNA (4) | 1.0 ± 0.2 μg/μg DNA (4)* |
Values are the mean ± SEM, and the numbers of animals are indicated in parentheses.
Significant differences between genotypes are indicated.
p<0.05,
p<0.01,
p<0.001.
Fig. 6.
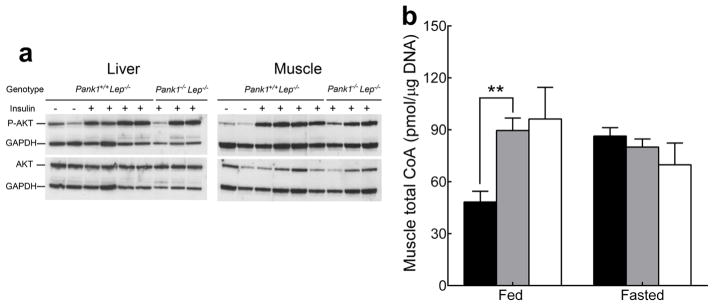
Pank1-deficiency does not alter AKT phosphorylation or muscle CoA in Lep−/− mice. (a) Levels of AKT and phospho-AKT (P-AKT) were analyzed in liver and muscle homogenates 5 minutes after the injection of 0.5 U of insulin or PBS (control) through the vena cava. (b) Muscle total CoA from fed and 24h fasted Pank1+/+Lep+/+ (black bars), Pank1+/+Lep−/− (gray bars) and Pank1−/−Lep−/− (white bars) mice. Values are the mean ± SEM. * indicates a significant difference between genotypes under the same nutritional conditions; † indicates a significant difference between fed and fasted mice of the same genotype. ** or †† p<0.01.
CoA regulation was then investigated in skeletal muscle, a major contributor to insulin resistance. Muscle CoA was elevated substantially in fed Pank1+/+Lep−/− and Pank1−/−Lep−/− mice, similar to fasted levels in wild-type animals (Fig. 6b), indicating deregulation of CoA metabolism. In contrast with the results in liver, however, PanK1-deficiency did not reduce either fed or fasting CoA levels in Lep−/− muscles. The muscle acyl-CoA levels in Lep−/− mice were elevated compared to wild-type mice, but were not reduced following Pank1-deletion (Supplemental Fig. S2). Investigation of the Pank transcript distribution in skeletal muscle showed that Pank1b expression was 100-fold lower (p<0.001) and Pank1α expression was 50% lower in Lep−/− muscle compared to liver (Table 1). As Pank1 (and Pank3) isoforms were expressed in skeletal muscle at significantly lower levels compared to liver, with Pank1 transcripts as minor species, a PanK1-deficiency would not be expected to alter muscle CoA levels in Pank1−/−Lep−/− mice. Altogether, the data indicated that the chronic hyperglycaemia of Lep−/− mice was resolved by reduction of hepatic CoA levels, but the insulin resistance of Lep−/− mice was much less affected, if at all, and correlated with deregulated CoA levels in skeletal muscle (and likely other insulin-sensitive tissues) that did not express PanK1 at significant levels.
Pank1-deficiency modified whole-body carbohydrate and amino acid metabolism in Lep−/− mice
Pank1−/−Lep−/− and control animals were analysed by indirect calorimetry to investigate the effect of Pank1-deficiency on whole-body metabolism. Mice were acclimatized for 5h, fed ad libitum for 24h, fasted for 24h and re-fed for 14h, with frequent monitoring of oxygen consumed (VO2) and carbon dioxide (VCO2) produced. The higher VCO2/VO2 respiratory exchange ratio (RER) indicated that Pank1−/−Lep−/− mice had increased non-lipid fuel utilization during ad libitum feeding (Fig. 7a) and this correlated with the significantly reduced hyperglycaemia in fed Pank1−/−Lep−/− animals (Table 3). The calculated energy expenditure did not indicate a significant difference between genotypes (Fig. 7b) although the metabolic rate, as measured by oxygen consumption, tended to be lower in the Pank1−/−Lep−/− mice without attaining statistical significance (data not shown).
Fig. 7.

Increased whole-body carbohydrate utilization and altered lipid and amino acid metabolism in Pank1−/−Lep−/− mice. Black circles and bars, Pank1+/+Lep−/−; white circles and bars, Pank1−/−Lep−/−. (a) Respiratory exchange ratio (RER) and (b) energy expenditure of Pank1−/−Lep−/− (n=7) and Pank1+/+Lep−/− mice (n=12) under different nutritional conditions. (c) Amino acid analysis in serum from overnight fasted mice. (d–f) Mass spectrometry analysis of serum (d) free and acetylcarnitine, (e) short-chain (C3–C8) acylcarnitines and (f) long-chain (> C8) acylcarnitines in fed and overnight fasted Pank1+/+Lep−/− and Pank1−/−Lep−/− mice (n=4/genotype). Values are the mean ± SEM. * p<0.05, ** p<0.01, *** p<0.001.
Serum acyl-carnitines were measured as an indication of global fatty acid and amino acid metabolism. In the fed state Pank1−/−Lep−/− mice had increased butyryl/isobutyrylcarnitine (C4) and palmitoylcarnitine (C16), while oleoylcarnitine (C18:1) was reduced compared to Pank1+/+Lep−/− animals (Fig. 7e and f). Following an overnight fast, Pank1−/−Lep−/− mice exhibited a modest increase in serum myristoylcarnitine (C14) (Fig. 7f), while the branched-chain amino acid-derived propylcarnitine (C3) and α-methylbutyryl/isovalerylcarnitine (C5) were reduced 3- and 2-fold, respectively (Fig. 6e). Consistent with the carnitine profiling, valine was significantly decreased in Pank1−/−Lep−/− mice, and both isoleucine and leucine tended to be lower (Fig. 7c). Not all serum amino acids were decreased in the Pank1−/−Lep−/− mice, however. Both methionine and serine were modestly increased, while alanine was twice as high in Pank1−/−Lep−/− compared to controls (Fig. 7c). Other metabolites that increased in the serum of fasted Pank1−/−Lep−/− mice were β-hydroxybutyrate and free fatty acids, while cholesterol was reduced compared to Pank1+/+Lep−/− mice (Table 3). The elevated alanine in the Pank1−/−Lep−/− mice correlated with reduced alanine consumption by liver (Fig. 4). Altogether, these data indicated that deletion of Pank1 altered not only fatty acid but also amino acid metabolism, and elevated glucose utilization.
Discussion
A key finding of this investigation is that deregulated CoA metabolism in both liver and skeletal muscle likely contribute to the diabetic phenotype of the leptin-deficient mice. The chronic aspects of the phenotype, hyperglycaemia and hyperinsulinemia, were corrected by limiting CoA synthesis in liver, but the acute responses to high glucose and high insulin were unresolved. The data suggest that the resolution of the hyperinsulinemia was an adaptive response to lower serum glucose levels. Body weight, food intake and hepatic triglyceride content were unchanged following deletion of Pank1 in Lep−/− mice, as were the amounts of acyl-CoA intermediates in liver and muscle. These results suggest that the accumulation of hepatic triglyceride per se is not required for development of diabetes and identify CoA as a molecular mediator that couples obesity with hyperglycaemia by engaging metabolic processes normally restricted to the fasted state. Hepatic CoA levels are determined by co-expression of Pank and Nudt isoform combinations which were altered in Lep−/− mice, and the Pank1−/−Lep−/− mice revealed that CoA can be a determining factor in metabolic disease. In light of the GWAS report that polymorphisms in the human PANK1 gene are associated with insulin levels [22], our data suggest that a subset of human diabetic patients may benefit from moderate inhibition of PanK1 and CoA biosynthesis.
Deletion of Pank1 in Lep−/− mice dramatically suppressed hepatic gluconeogenesis, and the systemic reduction in the hyperglycaemia and hyperinsulinemia might have consequently modified whole-body fatty acid, carbohydrate, and amino acid metabolism. Conversely, PanK1-deficiency did not reduce abnormally high CoA levels in Lep−/− skeletal muscle due to the fact that Pank1 is not highly expressed in skeletal muscle. Accumulation of serum β-hydroxybutyrate and free fatty acids in fasted Pank1−/−Lep−/− mice suggested reduced tissue utilization [9,34] or, in the latter case, enhanced adipose tissue lipolysis. Reduced tissue glycogen content and higher RER indicated increased glucose utilization in the periphery. Elevated alanine levels in blood correlated with reduced utilization of alanine for gluconeogenesis, although reduced branched-chain amino acid levels in fasted Pank1−/−Lep−/− mice (Fig. 6B) suggested that accumulation of serum alanine could also have been derived from increased synthesis of this amino acid in the muscle. Alanine production entails transfer of an amino group to pyruvate, and the process is tightly coupled to branched-chain amino acid degradation [35]. Thus, higher glucose utilization in the Pank1−/−Lep−/− mice could provide more pyruvate for alanine synthesis at the expense of the branched-chain amino acids. Interestingly, branched-chain amino acids, C3/C5 acylcarnitines and alanine are components of a metabolite cluster that is strongly associated with and elevated under conditions of insulin resistance [36,37]. Although branched-chain amino acids and C3/C5 acylcarnitines were reduced, serum alanine was higher in the Pank1−/−Lep−/− mice and this correlated with unimproved systemic insulin resistance.
The beneficial physiological effect of CoA limitation was not dependent on changes in the transcription of regulatory enzymes in the fatty acid oxidation or gluconeogenic pathways, but rather resulted from a reduced rate of hepatic fatty acid oxidation due to limitation of substrate supply. The inability of Lep−/− mice to modulate hepatic CoA represents one molecular aspect of metabolic inflexibility which correlates with failure to suppress hepatic glucose production [38]. Repression of Nudt7 expression is reported to follow activation of peroxisome proliferator-activated receptor α [7] which would be expected to be engaged in fatty liver. However, the mechanisms underlying the CoA deregulation in Lep−/− mice are not known and are subject to future investigation.
Supplementary Material
Acknowledgments
We thank Caroline Pate, Lois Richmond, Karen Miller, Jina Wang, Katie Wells, Matt Frank, the Veterinary Pathology Core Facility at St. Jude Children’s Hospital and the Protein Core of the University of California at Davis, for their expert technical assistance.
Funding
The research was funded by NIH GM062896 (S.J.) and ALSAC.
Abbreviations
- ASM
Acid soluble metabolites
- OGTT
Oral glucose tolerance test
- ITT
Insulin tolerance test
- RER
Respiratory exchange ratio
- VCO2
Volume of carbon dioxide produced
- VO2
Volume of oxygen consumed
Footnotes
Duality of interest
The authors declare that there is no duality of interest associated with this manuscript.
Contribution statement
RL, SJ and COR were responsible for conception and design of the study. RL performed and supervised the experiments to obtain the data. RL and SJ were responsible for analysis and interpretation of the data, and wrote the manuscript. COR contributed to discussion and reviewed/edited the manuscript. All authors gave final approval. SJ is responsible for the integrity of the work as a whole.
References
- 1.Perriello G, Pampanelli S, Del SP, et al. Evidence of increased systemic glucose production and gluconeogenesis in an early stage of NIDDM. Diabetes. 1997;46:1010–1016. doi: 10.2337/diab.46.6.1010. [DOI] [PubMed] [Google Scholar]
- 2.Caton PW, Nayuni NK, Kieswich J, Khan NQ, Yaqoob MM, Corder R. Metformin suppresses hepatic gluconeogenesis through induction of SIRT1 and GCN5. J Endocrinol. 2010;205:97–106. doi: 10.1677/JOE-09-0345. [DOI] [PubMed] [Google Scholar]
- 3.Randle PJ. Regulatory interactions between lipids and carbohydrates: the glucose fatty acid cycle after 35 years. Diabetes Metab Rev. 1998;14:263–283. doi: 10.1002/(sici)1099-0895(199812)14:4<263::aid-dmr233>3.0.co;2-c. [DOI] [PubMed] [Google Scholar]
- 4.Leonardi R, Rehg JE, Rock CO, Jackowski S. Pantothenate kinase 1 is required to support the metabolic transition from the fed to the fasted state. PLoS ONE. 2010;5:e11107. doi: 10.1371/journal.pone.0011107. [DOI] [PMC free article] [PubMed] [Google Scholar]
- 5.Leonardi R, Zhang Y-M, Rock CO, Jackowski S. Coenzyme A: Back in action. Prog Lipid Res. 2005;44:125–153. doi: 10.1016/j.plipres.2005.04.001. [DOI] [PubMed] [Google Scholar]
- 6.Gasmi L, McLennan AG. The mouse Nudt7 gene encodes a peroxisomal nudix hydrolase specific for coenzyme A and its derivatives. Biochem J. 2001;357:33–38. doi: 10.1042/0264-6021:3570033. [DOI] [PMC free article] [PubMed] [Google Scholar]
- 7.Reilly SJ, Tillander V, Ofman R, Alexson SE, Hunt MC. The nudix hydrolase 7 is an acyl-CoA diphosphatase involved in regulating peroxisomal coenzyme A homeostasis. J Biochem. 2008;144:655–663. doi: 10.1093/jb/mvn114. [DOI] [PubMed] [Google Scholar]
- 8.Zhang Y-M, Rock CO, Jackowski S. Feedback regulation of murine pantothenate kinase 3 by coenzyme A and coenzyme A thioesters. J Biol Chem. 2005;280:32594–32601. doi: 10.1074/jbc.M506275200. [DOI] [PubMed] [Google Scholar]
- 9.Garcia M, Leonardi R, Zhang YM, Rehg JE, Jackowski S. Germline deletion of pantothenate kinases 1 and 2 reveals the key roles for CoA in postnatal metabolism. PLoS ONE. 2012;7:e40871. doi: 10.1371/journal.pone.0040871. [DOI] [PMC free article] [PubMed] [Google Scholar]
- 10.Rock CO, Karim MA, Zhang Y-M, Jackowski S. The murine Pank1 gene encodes two differentially regulated pantothenate kinase isozymes. Gene. 2002;291:35–43. doi: 10.1016/s0378-1119(02)00564-4. [DOI] [PubMed] [Google Scholar]
- 11.Leonardi R, Rock CO, Jackowski S, Zhang Y-M. Activation of human mitochondrial pantothenate kinase 2 by palmitoylcarnitine. Proc Natl Acad Sci USA. 2007;104:1494–1499. doi: 10.1073/pnas.0607621104. [DOI] [PMC free article] [PubMed] [Google Scholar]
- 12.Leonardi R, Zhang YM, Lykidis A, Rock CO, Jackowski S. Localization and regulation of mouse pantothenate kinase 2. FEBS Lett. 2007;581:4639–4644. doi: 10.1016/j.febslet.2007.08.056. [DOI] [PMC free article] [PubMed] [Google Scholar]
- 13.Rock CO, Calder RB, Karim MA, Jackowski S. Pantothenate kinase regulation of the intracellular concentration of coenzyme A. J Biol Chem. 2000;275:1377–1383. doi: 10.1074/jbc.275.2.1377. [DOI] [PubMed] [Google Scholar]
- 14.Leonardi R, Zhang Y-M, Yun M-K, et al. Modulation of pantothenate kinase 3 activity by small molecules that interact with the substrate/allosteric regulatory domain. Chem Biol. 2010;17:892–902. doi: 10.1016/j.chembiol.2010.06.006. [DOI] [PMC free article] [PubMed] [Google Scholar]
- 15.Alfonso-Pecchio A, Garcia M, Leonardi R, Jackowski S. Compartmentalization of mammalian pantothenate kinases. PLoS ONE. 2012;7:e49509. doi: 10.1371/journal.pone.0049509. [DOI] [PMC free article] [PubMed] [Google Scholar]
- 16.Gerdes S, Lerma-Ortiz C, Frelin O, et al. Plant B vitamin pathways and their compartmentation: a guide for the perplexed. J Exp Bot. 2012;63:5379–5395. doi: 10.1093/jxb/ers208. [DOI] [PubMed] [Google Scholar]
- 17.Zallot R, Agrimi G, Lerma-Ortiz C, et al. Identification of mitochondrial coenzyme a transporters from maize and Arabidopsis. Plant Physiol. 2013;162:581–588. doi: 10.1104/pp.113.218081. [DOI] [PMC free article] [PubMed] [Google Scholar]
- 18.Prohl C, Pelzer W, Diekert K, et al. The yeast mitochondrial carrier Leu5p and its human homologue Graves’ disease protein are required for accumulation of coenzyme A in the matrix. Mol Cell Biol. 2001;21:1089–1097. doi: 10.1128/MCB.21.4.1089-1097.2001. [DOI] [PMC free article] [PubMed] [Google Scholar]
- 19.Fiermonte G, Paradies E, Todisco S, Marobbio CM, Palmieri F. A novel member of solute carrier family 25 (SLC25A42) Is a transporter of coenzyme A and adenosine 3′,5′-diphosphate in human mitochondria. J Biol Chem. 2009;284:18152–18159. doi: 10.1074/jbc.M109.014118. [DOI] [PMC free article] [PubMed] [Google Scholar]
- 20.Zhang YM, Chohnan S, Virga KG, et al. Chemical knockout of pantothenate kinase reveals the metabolic and genetic program responsible for hepatic coenzyme A homeostasis. Chem Biol. 2007;14:291–302. doi: 10.1016/j.chembiol.2007.01.013. [DOI] [PMC free article] [PubMed] [Google Scholar]
- 21.Zhou B, Westaway SK, Levinson B, Johnson MA, Gitschier J, Hayflick SJ. A novel pantothenate kinase gene (PANK2) is defective in Hallervorden-Spatz syndrome. Nat Genet. 2001;28:345–349. doi: 10.1038/ng572. [DOI] [PubMed] [Google Scholar]
- 22.Sabatti C, Service SK, Hartikainen AL, et al. Genome-wide association analysis of metabolic traits in a birth cohort from a founder population. Nat Genet. 2009;41:35–46. doi: 10.1038/ng.271. [DOI] [PMC free article] [PubMed] [Google Scholar]
- 23.Kennedy AJ, Ellacott KL, King VL, Hasty AH. Mouse models of the metabolic syndrome. Dis Model Mech. 2010;3:156–166. doi: 10.1242/dmm.003467. [DOI] [PMC free article] [PubMed] [Google Scholar]
- 24.Zhang Y, Proenca R, Maffei M, Barone M, Leopold L, Friedman JM. Positional cloning of the mouse obese gene and its human homologue. Nature (London) 1994;372:425–432. doi: 10.1038/372425a0. [DOI] [PubMed] [Google Scholar]
- 25.Lindstrom P. The physiology of obese-hyperglycemic mice [ob/ob mice] Scientific World Journal. 2007;7:666–685. doi: 10.1100/tsw.2007.117. [DOI] [PMC free article] [PubMed] [Google Scholar]
- 26.Steiner AA, Petenusci SO, Brentegani LG, Branco LG. The importance of glucose for the freezing tolerance/intolerance of the anuran amphibians Rana catesbeiana and Bufo paracnemis. Rev Bras Biol. 2000;60:321–328. doi: 10.1590/s0034-71082000000200017. [DOI] [PubMed] [Google Scholar]
- 27.Minkler PE, Kerner J, Ingalls ST, Hoppel CL. Novel isolation procedure for short-, medium-, and long-chain acyl-coenzyme A esters from tissue. Anal Biochem. 2008;376:275–276. doi: 10.1016/j.ab.2008.02.022. [DOI] [PMC free article] [PubMed] [Google Scholar]
- 28.Shimada K, Mitamura K. Derivatization of thiol-containing compounds. J Chromatogr B Biomed Appl. 1994;659:227–241. doi: 10.1016/0378-4347(93)e0444-u. [DOI] [PubMed] [Google Scholar]
- 29.Schneider WC. Phosphorus compounds in animal tissues; extraction and estimation of desoxypentose nucleic acid and of pentose nucleic acid. J Biol Chem. 1945;161:293–303. [PubMed] [Google Scholar]
- 30.Yu XX, Drackley JK, Odle J, Lin X. Response of hepatic mitochondrial and peroxisomal β-oxidation to increasing palmitate concentrations in piglets. Biol Neonate. 1997;72:284–292. doi: 10.1159/000244495. [DOI] [PubMed] [Google Scholar]
- 31.Demaugre F, Leroux JP, Cartier P. The effects of pyruvate concentration, dichloroacetate and alpha-cyano-4-hydroxycinnamate on gluconeogenesis, ketogenesis and [3-hydroxybutyrate]/[3-oxobutyrate] ratios in isolated rat hepatocytes. Biochem J. 1978;172:91–96. doi: 10.1042/bj1720091. [DOI] [PMC free article] [PubMed] [Google Scholar]
- 32.Kirschbaum N, Clemons R, Marino KA, Sheedy G, Nguyen ML, Smith CM. Pantothenate kinase activity in livers of genetically diabetic mice (db/db) and hormonally treated cultured rat hepatocytes. J Nutr. 1990;120:1376–1386. doi: 10.1093/jn/120.11.1376. [DOI] [PubMed] [Google Scholar]
- 33.Mutel E, Gautier-Stein A, Abdul-Wahed A, et al. Control of blood glucose in the absence of hepatic glucose production during prolonged fasting in mice: induction of renal and intestinal gluconeogenesis by glucagon. Diabetes. 2011;60:3121–3131. doi: 10.2337/db11-0571. [DOI] [PMC free article] [PubMed] [Google Scholar]
- 34.Houten SM, Herrema H, Te BH, et al. Impaired amino acid metabolism contributes to fasting-induced hypoglycemia in fatty acid oxidation defects. Hum Mol Genet. 2013 doi: 10.1093/hmg/ddt382. [DOI] [PubMed] [Google Scholar]
- 35.Haymond MW, Miles JM. Branched chain amino acids as a major source of alanine nitrogen in man. Diabetes. 1982;31:86–89. doi: 10.2337/diab.31.1.86. [DOI] [PubMed] [Google Scholar]
- 36.Newgard CB, An J, Bain JR, et al. A branched-chain amino acid-related metabolic signature that differentiates obese and lean humans and contributes to insulin resistance. Cell Metab. 2009;9:311–326. doi: 10.1016/j.cmet.2009.02.002. [DOI] [PMC free article] [PubMed] [Google Scholar]
- 37.Tai ES, Tan ML, Stevens RD, et al. Insulin resistance is associated with a metabolic profile of altered protein metabolism in Chinese and Asian-Indian men. Diabetologia. 2010;53:757–767. doi: 10.1007/s00125-009-1637-8. [DOI] [PMC free article] [PubMed] [Google Scholar]
- 38.Storlien L, Oakes ND, Kelley DE. Metabolic flexibility. Proc Nutr Soc. 2004;63:363–368. doi: 10.1079/PNS2004349. [DOI] [PubMed] [Google Scholar]
Associated Data
This section collects any data citations, data availability statements, or supplementary materials included in this article.