

Abstract
Human upcyte® hepatocytes are proliferating hepatocytes that retain many characteristics of primary human hepatocytes. We conducted a comprehensive evaluation of the application of second-generation upcyte® hepatocytes from four donors for inhibition and induction assays using a selection of reference inhibitors and inducers. CYP1A2, CYP2B6, CYP2C9, and CYP3A4 were reproducibly inhibited in a concentration-dependent manner and the calculated IC50 values for each compound correctly classified them as potent inhibitors. Upcyte® hepatocytes were responsive to prototypical CYP1A2, CYP2B6, CYP2C9, and CYP3A4 inducers, confirming that they have functional AhR-, CAR-, and PXR-mediated CYP regulation. A panel of 11 inducers classified as potent, moderate or noninducers of CYP3A4 and CYP2B6 were tested. There was a good fit of data from upcyte® hepatocytes to three different predictive models for CYP3A4 induction, namely the Relative Induction Score (RIS), AUCu/F2, and Cmax,u/Ind50. In addition, PXR (rifampicin) and CAR-selective (carbamazepine and phenytoin) inducers of CYP3A4 and CYP2B6 induction, respectively, were demonstrated. In conclusion, these data support the use of second-generation upcyte® hepatocytes for CYP inhibition and induction assays. Under the culture conditions used, these cells expressed CYP activities that were equivalent to or higher than those measured in primary human hepatocyte cultures, which could be inhibited or induced by prototypical CYP inhibitors and inducers, respectively. Moreover, they can be used to predict in vivo CYP3A4 induction potential using three prediction models. Bulk availability of cells from multiple donors makes upcyte® hepatocytes suitable for DDI screening, as well as more in-depth mechanistic investigations.
Keywords: CYP induction, CYP inhibition, human, upcyte hepatocytes
Introduction
Drugs that inhibit xenobiotic metabolizing enzymes (XMEs) responsible for their own metabolism or that of a coadministered drug, decrease their metabolic clearance, resulting in higher plasma concentrations to potentially toxic levels. Indeed, most fatal drug–drug interactions are due to XME inhibition (Zhou et al. 2007). In addition to inhibition, drugs that induce XMEs are also avoided in drug development as increased levels of XMEs increase the metabolic clearance of drugs, which may cause the plasma levels to drop below the therapeutic threshold. Therefore, it is important to identify potent drug inhibitors and inducers of XMEs at an early stage in drug screening to deselect them from development or provide labeling once they are marketed. Primary human hepatocytes are the standard in vitro model for evaluating the induction potential of new drugs (Hewitt et al. 2007). However, due to the sporadic quality and quantity of these cells, researchers have explored alternative models for investigating cytochrome P450 (CYP) induction. There have been a number of cell types investigated, including HepG2, HepaRG, and Fa2N-4 cells (Youdim et al. 2007; Kanebratt and Andersson 2008). However, these all represent a single donor; HepG2 cells lack sufficient responsiveness to CYP3A4 inducers (Westerink and Schoonen 2007); and Fa2N-4 cells lack constitutive androstane receptor (CAR) expression (Hariparsad et al. 2008). Therefore, there is still a need for a predictive hepatic model which could be used in early drug screening for metabolism and potential for DDIs.
Human upcyte® hepatocytes (www.upcyte.technologies.com) are derived from primary human hepatocytes by transducing them with proliferating genes and induce them to undergo a finite number of cell divisions without being immortalized or losing adult primary cell phenotype (e.g., adult cell markers, albumin production, XMEs (Burkard et al. 2012)). This technology can be applied to different cells types (e.g., microvascular endothelial cells (Scheller et al. 2013)) and to different cell batches, so that a range of primary cells from multiple donors can exhibit an extended lifespan. Over 12 billion upcyte® hepatocytes can be generated from one vial of primary human hepatocytes thus meeting the high demand for predictive human-based cell screening studies. The first-generation upcyte® hepatocytes were shown to be responsive to CYP inducers and for CYP3A4, the extent of induction in upcyte® hepatocytes generally reflected that in the paired primary cells (Burkard et al. 2012). CYP1A2, CYP2B6, and CYP3A4 were all induced by prototypical inducers at the mRNA level; however, CYP2B6 activities were not significantly induced by phenobarbital, suggesting that additional optimization was necessary. The upcyte® technology was therefore modified and second-generation upcyte® hepatocytes were developed according to Levy et al. (2015). These cells also exhibit a differentiated phenotype, forming metabolically functional and polarized cultures with functional bile canaliculi. The expression of nuclear receptors, phase 1 and 2 enzymes, and drug transporter genes was also comparable to primary human hepatocytes. As with the first-generation upcyte® hepatocytes, second-generation cells lack fetal markers and express cytokeratin 8 and 18, human serum albumin and store glycogen, and these characteristics are present over different growth stages (Levy et al. 2015).
In order to use upcyte® hepatocytes in metabolism or inhibition studies, they need to express high CYP activities. We describe here how the culture conditions were optimized to favor higher CYP activities such that they were suitable for both metabolism and CYP inhibition studies. As a proof of principle, we investigated whether upcyte® hepatocytes can be used in classical CYP inhibition assays using known potent CYP inhibitors. We selected α-naphthoflavone, miconazole, and ketoconazole as competitive inhibitors of CYP1A2, CYP2C9, and CYP3A4, respectively (Mao et al. 2012; Moeller et al. 2013). Ticlopidine was used as an inhibitor of CYP2B6 activities (Turpeinen et al. 2004). Ticlopidine is a mechanism-based inhibitor of CYP2B6 and its metabolism by CYP2B6 (and not other CYPs) leads to the formation of a reactive metabolite that inhibits the enzyme (Richter et al. 2004). A second laboratory also tested upcyte® hepatocytes to compare basal CYP activities and their inhibition.
We have also investigated the application of second-generation upcyte® hepatocytes for use in CYP induction screening assays. Aryl hydrocarbon receptor (AhR)-, CAR-, and PXR-mediated induction was measured using prototypical inducers recommended by the FDA: omeprazole (AhR-mediated induction of CYP1A2), phenobarbital (CAR-mediated induction of CYP2B6), and rifampicin (PXR- and CAR-mediated induction of CYP2C9 and CYP3A4) (FDA, 2012). CYP induction was monitored by measuring CYP activities, rather than changes in mRNA expression to ensure that the whole pathway of induction resulting in active enzyme proteins was functional in these cells. The in vitro–in vivo CYP3A4 induction correlation has been modeled using predictions based on the maximum fold induction (Indmax), the concentration causing 50% maximal induction (Ind50), or the concentration causing a twofold induction (the “F2”). The Indmax and Ind50 can be related to the unbound drug plasma concentration (Cmax,u) using the Relative Induction Score (RIS) and compared to the in vivo induction of CYP3A4 by each drug. Data generated from CYP3A4 induction studies using upcyte® human hepatocytes were applied to three models recommended by PhARMA (Chu et al. 2009) to determine whether they can mimic the correlations already established for human hepatocytes (Fahmi et al. 2008).
Materials and Methods
Materials
Hepatocyte growth medium (HGM), high-performance medium (HPM), and hepatocyte thawing medium (HTM) were all obtained from Medicyte GmbH, Heidelberg, Germany. Ham F12 and Williams E media, L-glutamine, HEPES, sodium pyruvate, penicillin, and streptomycin were purchased from Gibco (Paisley, UK). Trypsin/EDTA was obtained from PAN, and phosphate-buffered saline (PBS) with calcium or magnesium was from GE Healthcare Life Sciences, Freiburg, Germany. The MTS assay was a kit from Promega, Mannheim, Germany (CellTiter 96® AQueous Non-Radioactive Cell). All the inducers and inhibitors and probe substrates and their metabolites (midazolam, 1′-hydroxymidazolam, tolbutamide, 4-hydroxytolbutamide, dextromethorphan, dextrorphan, phenacetin, and O-deethyl-phenacetin) were from Sigma–Aldrich, Seelze, Germany. The 1′-hydroxymidazolam glucuronide was synthesized by the Isotope Chemistry and Metabolites Synthesis Department of Sanofi (Chilly-Mazarin, France). Stock solutions were prepared using dimethyl sulfoxide (DMSO) as the solvent (AppliChem GmbH, Darmstadt, Germany) for all test compounds (except for phenobarbital, which was dissolved in PBS) and were stored at −20°C for no longer than 2 months. All other chemicals were of analytical grade, unless otherwise stated, and were of the highest purity possible (obtained from Sigma–Aldrich, Merck GmbH or AppliChem GmbH). All CYP assays were carried out using collagen type I-coated 48-well plates (Corning Life Sciences, Amsterdam, The Netherlands).
Cells and media
Second-generation upcyte® hepatocytes (Donors 10-03, 151-03, 422A-03 and 653-03) were from Medicyte GmbH, Heidelberg, Germany. All cells used in these studies were quality controlled and shown to lack α-fetoprotein but expressed cytokeratin 8 and 18, human serum albumin, and stored glycogen (measured using PAS staining). Primary human hepatocytes were from Invitrogen, North Carolina, or from KaLy–Cell, Strasbourg, France. The culture conditions for all cells and experiments were the same: incubation in a humidified incubator maintained at 37°C and 5% CO2 and 95% air. Upcyte® hepatocytes with a PD of 20–25 were used for all studies. Upcyte® and primary human hepatocytes were thawed in HTM and Williams Medium E (containing 0.1% BSA, 100 μg/mL streptomycin and 100 U/mL penicillin), respectively. The initial cell viability and density were determined using Trypan blue exclusion or a Scepter∼ Automated Cell Counter from Millipore, Darmstadt, Germany.
Experiments conducted in Lab 1
The following methods were carried out in Lab 1, Medicyte, Heidelberg, Germany.
Upcyte® hepatocyte preculture and conditioning conditions
Two preculture durations were used: A standard preculture of 3 days, with a population doubling (PD) of one, or a longer 6- to 7-day preculture with a PD of 3.5. Standard precultures were used for testing the induction of all four CYPs by a single concentration of inducer (as part of the quality control of the cell batch). All other inhibition and induction assays were conducted using a 6–7 day preculture period.
Standard preculture involved seeding the cells at 75,000 cells/cm2 HPM medium (0.5 mL/well) in collagen type I-coated 48-well plates. The cells were cultured for 3 days without a medium change, after which time, the medium was replaced with fresh HPM with the respective control and inducer compounds. The cells were cultured for a further 3 days during which time the medium was replaced daily with HPM containing the positive control inducers (50 μmol/L omeprazole for CYP1A2, 2 mmol/L phenobarbital for CYP2B6 and 20 μmol/L rifampicin for CYP2C9 and CYP3A4) or vehicle controls (0.1% PBS as the phenobarbital solvent and 0.1% DMSO for all other compounds).
For the longer preculture period, upcyte® hepatocytes were seeded at 5000 cells/cm2 in collagen type I-coated T150 flasks in HGM and precultured for up to 1 week or until they reached 70–80% confluence. The medium was changed every 2–3 days. The cells were then trypsinized and reseeded into 48-well plates at 150,000 cells/cm2 (confluence) in HPM (0.5 mL per well).
Upcyte® hepatocyte inhibition assays
For inhibition assays conducted in Lab 1, after the cells had attached (2–4 h), the medium was replaced with either HGM or HPM containing either 0.1% or 0.5% DMSO. The cells were cultured for a further 3 days during which time the medium was replaced daily with the appropriate medium. Cultures which were subsequently used for CYP1A2 inhibition assays were treated daily for 3 days with 100 μmol/L omeprazole to preinduce this CYP. After this time, the cells were used for inhibition assays. The cells were washed twice with PBS (containing Ca2+ and Mg2+) and preincubated with 0.1 mL of an appropriate CYP inhibitor dissolved in Krebs Henseleit buffer (KHB). α-naphthoflavone (0.1–10 μmol/L), miconazole (0.01–50 μmol/L), and ketoconazole (0.01–20 μmol/L) were preincubated for 5 min and ticlopidine (0.01–50 μmol/L) was preincubated for 30 min (as this is a mechanism-based inhibitor). CYP activities were measured by adding 0.1 mL of the CYP-selective substrate in KHB and incubating for 1 h (final concentrations were: 26 μmol/L phenacetin, 500 μmol/L bupropion, 75 μmol/L tolbutamide, and 250 μmol/L testosterone).
Upcyte® hepatocyte induction assays
There were two types of induction assays carried out: (1) standard induction assays in which a single concentration of prototypical CYP inducer was tested to determine CYP1A2, CYP2B6, CYP2C9, and CYP3A4 induction and (2) calibration induction assays in which a range of concentrations of test compounds were incubated to determine their potential to induce CYP2B6 and CYP3A4 only. For both assays, after attachment of upcyte® hepatocytes in 48-well plates, the medium was replaced with HPM and the cells were cultured for 24 h. After this time, the cells were treated daily for 3 days with the test compound/prototypical inducer (required for induction assays measuring activities, as opposed to mRNA measurements, which only require 2 days).
For standard induction assays, the prototypical inducers were 50 μmol/L omeprazole (CYP1A2 inducer), 1 mmol/L phenobarbital (CYP2B6 inducer), and 20 μmol/L rifampicin (CYP2C9 and CYP3A4 inducer). At the end of the induction period, the cells were washed with PBS and CYP activities were measured by adding 0.2 mL KHB containing final concentrations of CYP substrate: 26 μmol/L phenacetin, 500 μmol/L bupropion, 75 μmol/L tolbutamide, and 250 μmol/L testosterone and incubating for 30 min (testosterone) or 1 h (phenacetin, bupropion, and tolbutamide). After incubation, the supernatant was transferred to a fresh 96-well plate and processed for HPLC analysis.
For induction assays generating dose–response curves for CYP3A4 and CYP2B6 and subsequent calibration curves relating to in vivo induction, the test compounds were rifampicin (0.05–40 μmol/L), phenobarbital (20–2000 μmol/L), phenytoin (1–1000 μmol/L), carbamazepine (1–100 μmol/L), troglitazone (0.5–50 μmol/L), pioglitazone (0.5–40 μmol/L), dexamethasone (0.1–500 μmol/L), nifedipine (0.05–100 μmol/L), omeprazole (0.5–200 μmol/L), flumazenil (0.05–100 μmol/L), and quinidine (0.1–250 μmol/L). At the end of the induction period, the cells were washed with PBS and 0.2 mL 250 μmol/L testosterone in KHB was added to each well and incubated for 30 min. The supernatant was transferred to a fresh 96-well plate and processed for HPLC analysis. The remaining cell cultures were again washed twice with PBS and then incubated with 500 μmol/L bupropion in KHB for 1 h. The supernatant was transferred to a fresh 96-well plate and processed for HPLC analysis.
Metabolite analysis by HPLC
At Medicyte, all metabolites were analyzed using UV-HPLC. All metabolites and their respective internal standards (chlorpropamide for phenacetin, bupropion, and tolbutamide and cortexolone for testosterone) were separated on a SunFire C18 2.5 μm 2.1 × 20 mm column (Waters, Munich, Germany). The mobile phases for phenacetin metabolites were 17:1:1000 isopropanol:formic acid:distilled water (A) and 100% methanol (B). The peaks were detected on a UV detector set at 240 nm. The mobile phases for bupropion and tolbutamide and their hydroxy-metabolites were (a) 10 mmol/L KH2PO4 +5% acetonitrile, pH 4.6 and (B) 50:50 acetonitrile:water. The metabolites were detected on a UV detector set at 200 nm. The mobile phases for testosterone and its metabolites were (A) 390:600:10 methanol:water: acetonitrile and (B) 800:180:20 methanol:water:acetonitrile. The peaks were detected on a UV detector set at 252 nm.
Upcyte® hepatocyte culture viability and protein content
The viability of upcyte® hepatocyte cultures was measured using the MTS assay (CellTiter 96® AQueous Non-Radioactive Cell kit), according to the supplier's protocol. Briefly, the stock MTS solution was thawed and diluted in Krebs Henseleit buffer (fivefold dilution) and a volume of 0.2 mL MTS was added per well. The cultures were incubated with MTS for 1 h in a humidified incubator at 37°C, under an atmosphere of 5% CO2/95% air. The absorbance was read at 490 nm against a background absorbance of 620 nm.
After the MTS incubation, the cultures were washed twice with PBS and the proteins dissolved in 0.2 mL lysis buffer (8.76 mg/mL NaCl; 0.2 mg MgCl2.6H2O; 1% (v/v) NP40; 50 mmol/L Tris-HCl). The protein content was measured using the Pierce assay.
Calculation and curve fitting
Experiments were carried out in duplicate and each compound was tested in at least two different experiments. All curve fitting was carried out using Prism Version 8.0 software (GraphPad Software, Inc., La Jolla, CA, USA). Dose–response curves for test compounds from calibration induction inductions assays were generated and the Indmax and Ind50 values were determined by fitting the data to a three-parameter sigmoid (Hill) equation (as described by Ripp et al. 2006). Indmax is the maximum fold induction of CYP activity induced by the compound and Ind50 is the concentration at which 50% maximal induction was achieved. The Relative Induction Score (RIS) was determined using the following equation:
| 1 |
The Cmax,u value for omeprazole was taken from Mostafavi et al., Mostafavi and Tavakoli (2004); the Cmax,u value for all other compounds used for RIS determinations were taken from Ripp et al. (2006) or Fahmi et al. (2008) (values for quinidine and flumazenil were not needed as they were the negative control compounds).
The relative induction of CYP3A4 and CYP2B6 by different compounds compared to the positive control was calculated using equation 2:
| 2 |
where Ind50,TC is the Ind50 of the test compound and Ind50,PC is the Ind50 of the positive control (rifampicin for CYP3A4 and phenobarbital for CYP2B6.
Experiments conducted in Lab 2
The following methods were carried out in Lab 2, that is, Sanofi, Montpellier, France.
Culture of primary human hepatocytes for clearance assays
Cryopreserved human hepatocytes were seeded in 48-well collagen-coated plastic plates in a chemically defined medium adapted from Georgoff et al. (1984), consisting in a 50/50 (v/v) mixture of Ham F12/Williams E medium supplemented with 10% decomplemented fetal calf serum, 10 mg/L insulin, 0.8 mg/L glucagon, and antibiotics (100 IU penicillin and 100 μg/mL streptomycin). After a 4–6 h attachment period, plating medium was removed and replaced by the same serum-free culture medium supplemented with HEPES (3.6 g/L), ethanolamine (4 mg/L), transferrin (10 mg/L), linoleic acid-albumin (1.4 mg/L), glucose (252 mg/L), sodium pyruvate (44 mg/L), ascorbic acid (50 mg/L), arginine (104 mg/L), and L-glutamine (0.7 g/L).
Experiments were performed in 48-well plastic plates coated with rat tail collagen type I. Plates were seeded with 0.16 × 10⁵ upcyte® hepatocytes per well in a final volume of 0.2 mL. After a 3 h attachment period, the medium was renewed with 0.1 mL serum-free medium supplemented with HEPES (3.6 g/L), ethanolamine (4 mg/L), transferrin (10 mg/L), linoleic acid-albumin (1.4 mg/L), glucose (252 mg/L), sodium pyruvate (44 mg/L), ascorbic acid (50 mg/L), arginine (104 mg/L), and L-glutamine (0.7g/L). The following day, human hepatocytes were incubated with FDA-recommended metabolic CYP probe substrates at a starting concentration of 5 μmol/L for midazolam, phenacetin, and tolbutamide, 20 μmol/L for dextromethorphan, and 100 μmol/L for bupropion, in 0.1 mL of 0.1% BSA (v/v), containing incubation medium. Regardless of the final concentration investigated, the final solvent (DMSO) concentration never exceeded 0.2% (v/v).
To determine the metabolism of the different substrate probes, kinetic studies were performed over 0–24 h. For each time point (0, 1, 2, 3, 4, 6, 8, and 24 h), 0.7 mL acetonitrile was added to the specific well for protein precipitation, and both extracellular medium and cell compartment were harvested and pooled. Cell extracts were transferred to a glass tube and stored at −20°C until analysis by LC/MS-MS. Before analysis, cell homogenates were sonicated for a 2–3 sec, homogenized and centrifuged at 6000xg for 10 min. Supernatant fluids were then analyzed for the different probe substrates and their specific metabolites.
Shipment and subsequent testing of upcyte® hepatocytes cultures
Upcyte® hepatocytes which were shipped to Lab 2 were seeded in HGM at 75,000 cells per well in a 48-well collagen (type I)-coated plate on a Friday and grown for 3 days without a change in medium. On day 3 (Monday), the medium was replaced with fresh HPM containing 0.1% DMSO, 100 μg/mL streptomycin and 100 U/mL penicillin; the plates were then sealed and shipped to Lab 2 by overnight courier. Upon arrival, the medium was replaced with HPM containing 0.1% DMSO, 100 μg/mL streptomycin, and 100 U/mL penicillin and allowed to recover overnight.
Upcyte® hepatocyte clearance and inhibition assays
After shipping and the recovery period, upcyte® hepatocytes were cultured in HPM containing 0.1% DMSO, 100 μg/mL streptomycin, and 100 U/mL penicillin for a further 2 days before incubation with test compounds. The clearance and inhibition studies were conducted using the same conditions as those for primary human hepatocytes (described above). The effect of inhibitors on the clearance of substrates was determined by incubating them in the presence or absence of specific CYP inhibitors (3 μmol/L quinidine for CYP2D6 and 3 μmol/L ketoconazole for CYP3A) or the nonspecific mechanism-based CYP inhibitor, 1-aminobenzotriazole (ABT (Emoto et al. 2005)), 1 mmol/L).
Metabolite analysis by HPLC
Supernatants were analyzed for unchanged drug and specific metabolites by LC/MS-MS: phenacetin and 4-acetamidophenol for CYP1A2, tolbutamide and 4-hydroxy-tolbutamide for CYP2C9, bupropion and hydroxyl-bupropion for CYP2B6, dextromethorphan, dextrorphan and dextrorphan glucuronide for CYP2D6, Midazolam, 1′-hydroxymidazolam and 1′-hydroxymidazolam glucuronide for CYP3A activity. The data were collected and processed using MassLynx 4.1 Software from Waters-Micromass. The chromatograph (Acquity UPLC system I Class) was fitted with an Acquity UPLC BEH C18 column (2.1 mm i.d. ×100 mm length, 1.7 μm particle size), coupled to a Xevo TQS mass spectrometer (all from Waters, Milford, MA) and used in electrospray ion positive mode except for tolbutamide and its hydroxyl metabolite which were analyzed in ion negative mode.
The mobile phase was a mixture of 1.5 g/L ammonium acetate–2 mL/L formic acid (solvent A) and acetonitrile 80%–methanol 20%–0.15 g/L ammonium acetate-formic acid 2 mL/L (solvent B). The solvent programmer was set to deliver a flow rate of 0.35 mL/min. Compounds were eluted in 2 min with a linear gradient from 10 to 100% solvent B over 1 min, followed by an isocratic step at 100% for 0.7 additional minute.
Statistical evaluations
Data were evaluated for statistical differences using the t-test in Prism Software version 6.03. A statistical difference was considered when P < 0.05.
Results
Culture optimization
We investigated whether the culture conditions could be modified to result in cultures with higher CYP activities than were present using standard conditions, that is, seeding at 50% confluence with a 3-day preculture period (allowing for 1 PD) in HGM followed by a 3 day culture at confluence in HPM with daily refreshment of medium. The main aspects investigated were the length of the preculture period (as previous studies using these cells in the in vitro micronucleus assay showed that there was less DNA damage to the cells when they were precultured for 7 days prior to performing the assay (Nörenberg et al. 2013), the type of basal medium used for the culture of cells at confluence (HGM vs. HPM) and supplementing the preculture (during growth) and “conditioning” (i.e., at confluence) medium with DMSO. Initial experiments using Donor 422A-03 showed little difference in CYP activities when the preculture medium contained 0.25 or 0.5% DMSO (data not shown); therefore, in order to ensure maximal CYP activities, all subsequent experiments included 0.5% DMSO in the preculture HGM medium. The effect of DMSO on CYP2B6 and CYP3A4 activities in upcyte® hepatocytes from all four donors was measured using a 7-day preculture followed by three daily treatments with HPM supplemented with a range of concentrations of DMSO (Fig.1). Activities of both CYPs in cells from all four donors were markedly induced in a concentration-dependent manner by DMSO and maximal effects were evident at 0.5–0.75% (v/v) DMSO. At higher concentrations of DMSO, there was a decrease in both CYP activities.
Figure 1.
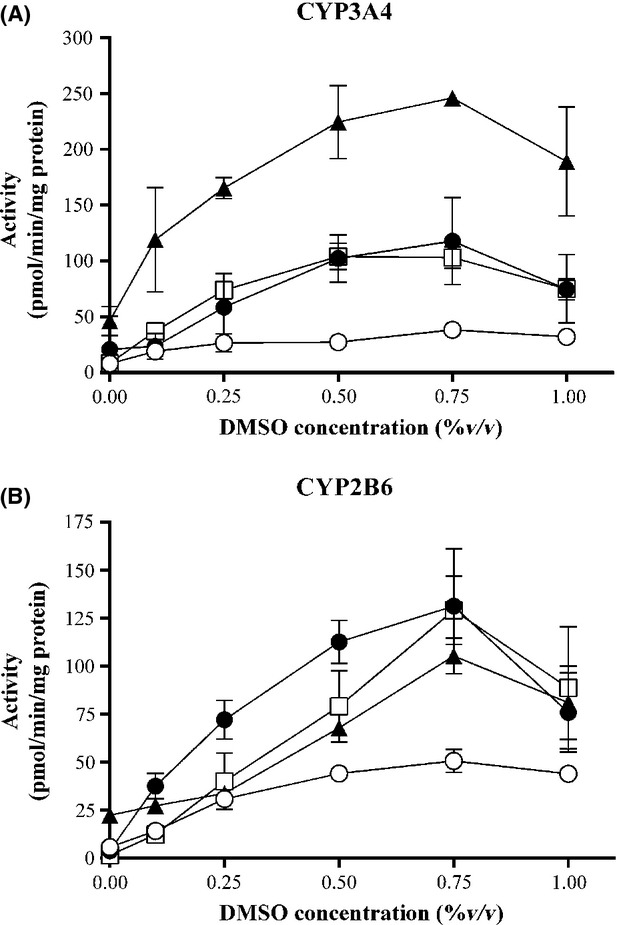
Effect of DMSO on CYP3A4 (A) and CYP2B6 (B) activities in upcyte® hepatocytes from different donors. Donor 10-03 = ○; Donor 151-03 = •; Donor 422A-03 = ▴; Donor 653-03 = □. Values are a mean of two experiments, each with n = 2 wells per treatment.
Figure2 shows how the culture conditions affected CYP2B6 and CYP3A4 activities in upcyte® hepatocytes from four donors. The conditions compared were as follows: (1) standard culture conditions (allowing for 1 PD); (2) seeding at 3% confluence (5000 cells/cm2) in a T-flask with a 6–7-day preculture period (allowing for ∼3.5 PDs) in HGM supplemented with 0.5% DMSO followed by trypsinization, seeding at confluence (i.e., 150,000/cm2) and a 3 day culture in HGM with 0.5% DMSO with daily refreshment of medium; and (3) seeding at 3% confluence in a T-flask with a 6–7-day preculture period in HGM supplemented with 0.5% DMSO followed by trypsinization, seeding at confluence (i.e., 150,000/cm2), and a 3 day culture at confluence in HPM with 0.1% DMSO with daily refreshment of medium. Increasing the preculture time from 3 days to 7 day did not increase the CYP3A4 activities but in three of the four donors, CYP2B6 activity was significantly increased. CYP3A4 activities were increased when the conditioning medium (used when the cells were at confluence) was changed from growth medium (HGM) to endpoint medium (HPM) with a lower concentration of DMSO (0.1% v/v). All further experiments were conducted using a 6–7 preculture period using HGM supplemented with 0.5% DMSO, trypsinization, seeding at 5000 cells/cm2, and conditioning for 3 days with HPM supplemented with 0.1% DMSO.
Figure 2.
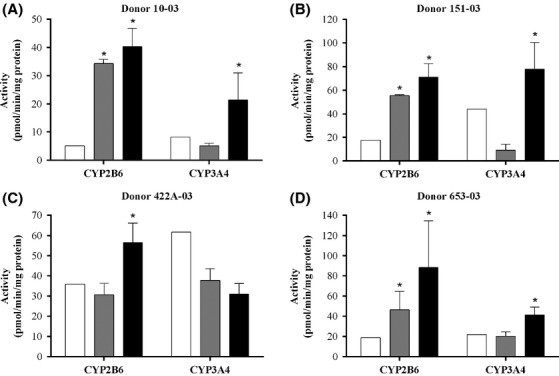
Effect of preculture time and DMSO treatment on CYP2B6 and CYP3A4 activities in upcyte® hepatocytes from different donors. White bars represent cells grown over a 3 day preculture and 3 days conditioning at confluence in GM +0.1% DMSO (standard conditions); gray bars represent cells grown over a 6–7-day preculture period followed by reseeding at confluence and a 3 day conditioning in HGM +0.5% DMSO, and black bars represent cells grown over a 6–7-day preculture period followed by reseeding at confluence and a 3 day conditioning in HPM +0.1% DMSO. Values are a mean of two experiments, each with n = 3 wells per treatment. *Significantly different from standard conditions (P < 0.05). DMSO, dimethyl sulfoxide, HGM, hepatocyte growth medium, HPM, high-performance medium.
Table1 compares the CYP activities in control incubations of upcyte® hepatocytes (using the optimized conditions) and corresponding primary human hepatocyte cultures from which they were derived. Two laboratories (Lab 1 and Lab 2) measured CYP activities to investigate to determine whether the shipment of the cells from Germany to France markedly affected the performance of the cells and whether they can be used in metabolism and inhibition assays in a second laboratory. The incubations at Lab 2 were designed for clearance of the parent compound and therefore employed lower substrate concentrations than those at Lab 1 (see below). For hepatocytes from two of the four donors (151-03 and 422A-03), upcyte® and primary hepatocytes from the same donor were incubated under the same conditions (at Lab 2).
Table 1.
Basal CYP activities (in pmol/min/mg protein) in second-generation upcyte® hepatocytes and paired primary human hepatocytes cultures incubated in different laboratories
| CYP | Metabolite | Donor 1 | Donor 2 | Donor 3 | Donor 4 | ||||
|---|---|---|---|---|---|---|---|---|---|
| upcyte® Donor 10-03 | Paired primary | upcyte® Donor 151-03 | Paired primary | upcyte® Donor 422A-03 | Paired primary | upcyte® Donor 653-03 | Paired primary | ||
| 1A2 | APAP | 3.3 ± 0.4 (L1) | ND (P) | 0.0 ± 0.0 (L1) | 2.0 (P) | 2.3 ± 0.1 (L1) | (P) | 0.0 ± 0.0 (L1) | 13.4 (P) |
| 0.7 ± 0.2 (L2) | 3.4 ± 0.6 (L2) | 0.7 ± 0.4 (L2) | 0.1 ± 0.0 (L2) | 1.7 ± 0.2 (L2) | |||||
| 2B6 | OH-Bup | 40.3 ± 6.5 (L1) | 14.3 (P) | 71.1 ± 11.3 (L1) | 1.3 (P) | 33.6 ± 11.4 (L1) | 1.3 (P) | 46.4 ± 18.0 (L1) | 5.3 (P) |
| 161.6 ± 59.6 (L2) | ND (L2) | 20.9 ± 4.1 (L2) | 4.5 ± 1.2 (L2) | 53.3 ± 7.3 (L2) | |||||
| 2C9 | OH-Tolb | 91.8 ± 5.7 (L1) | 6.3 (P) | 29.1 ± 21.4 (L1) | ND (P) | 4.8 ± 3.1 (L1) | ND (P) | 20.2 ± 2.1 (L1) | ND (P) |
| 0.94 ± 0.38 (L2) | 0.8 ± 0.2 (L2) | 0.39 ± 0.19 (L2) | 0.8 ± 0.0 (L2) | 2.9 ± 0.7 (L2) | |||||
| 3A4 | 6β-OHT | 21.4 ± 9.6 (L1) | 16.2 (P) | 77.8 ± 22.6 (L1) | 10.8 (P) | 42.9 ± 6.3 (L1) | 24.5 (P) | 41.4 ± 7.7 (L1) | 22.7 (P) |
| 3A4 (L2) | 1′-OH-MID | ND | ND | 55.8 ± 18.6 | 10.0 ± 1.9 | 8.2 ± 0.5 | 0.4 ± 0.0 | 12.8 ± 2.7 | ND |
| 1′-OH-MID-G | ND | ND | 1.7 ± 0.4 | 1.3 ± 0.2 | 0.51 ± 0.14 | 1.3 ± 0.2 | 0.50 ± 0.06 | ND | |
| Total MID | ND | ND | 57.5 ± 18.9 | 11.4 ± 2.4 | 8.7 ± 0.5 | 1.6 ± 0.2 | 13.3 ± 2.7 | ND | |
| 3A4 (L2) | 3-Meth | ND | ND | 45.8 ± 10.0 | ND | 4.0 ± 0.5 | ND | 12.4 ± 0.3 | ND |
| 2D6 (L2) | Dex | ND | ND | 2.1 ± 0.40 | 3.9 ± 1.4 | 0.53 ± 0.04 | 2.4 ± 0.21 | 2.25 ± 0.2 | ND |
| Dex-G | ND | ND | 0.19 ± 0.02 | ND | 0.11 ± 0.07 | 0.4 ± 0.0 | 0.06 ± 0.01 | ND | |
| Total | ND | ND | 2.3 ± 0.4 | ND | 0.64 ± 0.10 | 2.8 ± 0.2 | 2.31 ± 0.23 | ND | |
Values generated in Lab 1 were compared with data provided by the supplier and, in addition, upcyte® hepatocytes from three donors and their corresponding paired primary hepatocytes were directly compared by incubating them under the same conditions at Lab 2. Values for upcyte® hepatocytes are mean ± SD, n = 6–8 wells from 1 to 2 separate experiments. APAP, acetaminophen; OH-Bup, Hydroxybupropion; OH-Tolb, Hydroxytolbutamide; 6β-OHT, 6β-hydroxytestosterone; 1′-OH-MID, 1′Hydroxymidazolam; 1′-OH-MID-G, 1′Hydroxymidazolam-glucuronide; Total MID, 1′Hydroxymidazolam and its glucuronide; 3-Meth, 3-Methoxymorphinan; Dex, Dextrorphan; Dex-G, Dextrorphan-glucuronide; Total Dex, dextrorphan and its glucuronide; L1, Lab 1; L2, Lab 2; P, provider information on the cells; ND, not determined.
As with primary hepatocytes, the CYP activities in upcyte® hepatocytes varied between donors. CYP1A2 activities were present in upcyte® hepatocytes from all four donors, although this activity in Donors 653-03 and 151-03 was only detected by Lab 2 (using 24 h incubations and analysis by LC-MS), and all were lower than in corresponding paired donor hepatocytes. CYP2B6-mediated bupropion hydroxylation was markedly higher in upcyte® hepatocytes incubated in both laboratories compared to that in the original primary hepatocytes (either measured by the supplier (all donors) or, in Lab 2, incubated under the same conditions as upcyte® hepatocytes (Donor 422A-03)). CYP2C9 activities in upcyte® hepatocytes were higher in cells cultured and incubated at Lab 1 than those shipped and incubated at Lab 2. This could have been due to a number of factors, including the substrate concentration (75 μmol/L at Lab 1 and 5 μmol/L at Lab 2), the effect of shipment, and/or the small difference in the preculture methods (which was shorter for Lab 2 studies (see Materials and Methods)). CYP2C9 activities derived from incubations with a high tolbutamide concentration (75 μmol/L, Lab 1), were higher in upcyte® hepatocytes from Donor 10-03 than the paired primary cells (also incubated at 75 μmol/L, Provider). In Lab 2, in which upcyte® and primary hepatocytes from Donors 151-03 and 442A-03 were incubated under the same conditions – at a low tolbutamide concentration (5 μmol/L) – CYP2C9 activities were similar. CYP3A4 activities, measured using testosterone and midazolam, were markedly higher in upcyte® hepatocytes than in their paired primary cells. Notably, phase 2 conjugation of 1′-hydroxymidazolam to its glucuronide was also detected in upcyte® hepatocytes, the rate of which was comparable to that in primary cells. Dextromethorphan is metabolized by CYP3A4 to 3-methoxymorphinan (Yu and Haining 2001) and, although no comparative data were available, the presence of this pathway was clearly evident in upcyte® hepatocytes. CYP2D6 activities were low in the original primary hepatocytes (2–4 pmol/min/mg, compared to an average of ∼20 pmol/min/mg in primary cells (www.bioreclamationivt.com, accessed 20 April 2014); therefore, activities in upcyte® and primary hepatocyte were considered to be equivalent. The CYP2D6 metabolite, dextrorphan, was further metabolized to its glucuronide in both upcyte® and primary hepatocytes.
Inhibition studies
Inhibition studies were conducted in two laboratories, one using short-term incubation period of 1 h and higher substrate concentrations (Lab 1) and the second incubated at time points over 24 h at substrate concentrations at or below Km (Lab 2). Although the CYP1A2 activities that were present in upcyte® hepatocytes were measurable, cells incubated in Lab 1 were preinduced with 100 μmol/L omeprazole in order to obtain consistently high CYP1A2 activities for the inhibition studies using UV-HPLC as the analytical method. Two preinduction regimen were investigated, namely a single treatment of 100 μmol/L omeprazole over 3 days and a daily treatment of 100 μmol/L omeprazole over the same period. Both induction regimen resulted in high CYP1A2 activities in upcyte® hepatocytes from Donors 422A-03 and 10-03 (>40 pmol/min/mg protein), suggesting both could be employed for CYP1A2 inhibition studies. In our studies, we used daily treatments as this resulted in higher CYP1A2 activities than a single treatment. The induced activities were 57.1 ± 17.1, 83.8 ± 21.7, 205.0 ± 44.9, and 115.2 ± 30.2 pmol/min/mg protein in upcyte® hepatocytes from Donors 10-03, 151-03, 422A-03, and 653-03, respectively. CYP2B6, CYP2C9, and CYP3A4 did not require preinduction with an inducer; therefore, conditioning medium included 100 μmol/L omeprazole for CYP1A2 assays only.
The results for inhibition studies using upcyte® hepatocytes from Donor 422A-03 and conducted at Lab 1 are shown in Figure3 (results for Donors 10-03, 151-03, and 653-03 are shown in Fig. S1). In these studies, CYPs were inhibited using competitive (α-naphthoflavone, miconazole, and ketoconazole) and time-dependent (ticlopidine) inhibitors. There was a concentration-dependent inhibition of CYP1A2, CYP2B6, CYP2C9, and CYP3A4, such that at the highest concentration all activities were completely inhibited. The inhibitors did not cause significant cytotoxicity at any concentration tested in upcyte® hepatocytes from all four donors (with the exception of ticlopidine, which caused ∼10% cytotoxicity in upcyte® hepatocytes from Donor 151-03 at the highest concentration only). The inhibition of different CYPs was reproducible across experiments (Fig.3 and Fig. S1) and in upcyte® hepatocytes from all four donors tested (Table2). The IC50 values for each CYP tested also compared well with those reported in primary human hepatocytes or human liver microsomes (Table2), such that all four CYP inhibitors were classified as potent inhibitors of the respective CYP.
Figure 3.
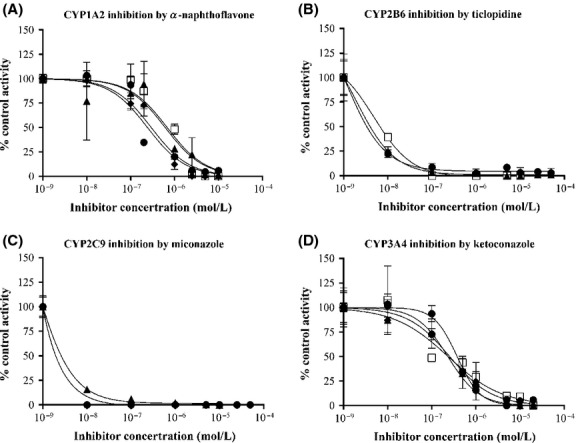
Inhibition of (A) CYP1A2 by α–naphthoflavone, (B) CYP2B6 by ticlopidine, (C) CYP2C9 by miconazole, and (D) CYP3A4 by ketoconazole in upcyte® hepatocytes from Donor 422A-03. Values are the mean ± SD from triplicates in 2–5 experiments (denoted by different symbols).
Table 2.
IC50 values of CYP inhibitors incubated with upcyte® hepatocytes from different donors. For comparison, literature values for microsomes and/or hepatocytes are also shown. Values for upcyte® hepatocytes are mean ± SD, n = 6–8 wells from at least two separate experiments
| IC50 value | ||||||||
|---|---|---|---|---|---|---|---|---|
| CYP1A2 by α-naphthoflavone μmol/L | CYP2B6 by ticlopidine nmol/L | CYP2C9 by miconazole nmol/L | CYP3A4 by ketoconazole μmol/L | |||||
| Donor | upcyte® | Primary1 | upcyte® | Microsomes2 | upcyte® | Primary3 | upcyte® | Primary3 |
| 10-03 | 0.15, 0.04 (n = 2) | 0.1 | 8.1 ± 1.6 (n = 4) | 0.32 | 251, 95.8 (n = 2) | 2.12 | 0.30 ± 0.3 (n = 4) | 0.28 0.14 |
| 151-03 | 0.38, 0.19 (n = 2) | 36.1 ± 27.9 (n = 4) | 12, 6.6 (n = 2) | 0.15 ± 0.01 (n = 4) | ||||
| 422A-03 | 0.46 ± 0.22 (n = 4) | 7.3 ± 1.6 (n = 4) | 3.1, 4.3 (n = 2) | 0.27 ± 0.06 (n = 5) | ||||
| 653-03 | 0.36, 0.12 (n = 2) | 27.5 ± 19.7 (n = 4) | 14.7, 4.1 (n = 2) | 0.23 ± 0.12 (n = 4) | ||||
Results for inhibition studies using upcyte® hepatocytes from three donors and conducted at Lab 2 are shown in Table3. In these studies, cultures were coincubated over 24 h with either the nonspecific mechanism-based CYP inhibitor, ABT, or the CYP-selective inhibitors (ketoconazole for CYP3A4 and quinidine for CYP2D6). ABT was a potent inhibitor of all CYPs tested and inhibited between 90% and 100% of activities over 6 h and 24 h. Ketoconazole also inhibited midazolam metabolism by ∼90% over 6 h but this effect was lower after 24 h (between 40% and 75%), most likely due to the metabolism of the inhibitor over this time period. CYP2D6-selective inhibition by quinidine was low and did not reach more than 47% inhibition. As with CYP3A4 inhibition by ketoconazole, the inhibitory effect of quinidine on CYP2D6 was lower after 24 h, both observations (low % inhibition and time-dependent effects) possibly due to the metabolism of quinidine. The production of the CYP3A4-mediated metabolite of dextromethorphan, 3-methoxymorphinan, was almost completely inhibited by ABT but, in contrast, quinidine either had little or no inhibitory effect on this pathway, confirming the CYP-selective properties of this inhibitor. Interestingly, in the case of Donor 653-03, quinidine marginally increased the production of the metabolite at both time points, possibly as a result of the diversion of the metabolic pathways towards CYP3A4 as the clearance of the parent compound did not change (data not shown).
Table 3.
Inhibition of CYP activities in upcyte® hepatocytes from different donors incubated in Lab 2
| Donor 151-03 | Donor 422A-03 | Donor 653-03 | ||||||
|---|---|---|---|---|---|---|---|---|
| CYP | Metabolite(s) | Inhibitor | 0–6 h | 24 h | 0–6 h | 24 h | 0–6 h | 24 h |
| 1A2 | APAP | 1 mmol/L ABT | 100 | 100 | 100 | 98 | 95 | 96 |
| 2B6 | OH-Bup | 1 mmol/L ABT | 85 | 94 | 90 | 94 | 94 | 97 |
| 2C9 | OH-Tolb | 1 mmol/L ABT | 100 | 98 | 100 | 100 | 95 | 99 |
| 3A4 | 1′OH-MID | 1 mmol/L ABT | 99 | 97 | 98 | 98 | 98 | 98 |
| +1′OH-MID-G | 3 μmol/L ketoconazole | 91 | 40 | 93 | 75 | 87 | 58 | |
| 3A4 | MEM | 1 mmol/L ABT | 94 | 96 | 92 | 95 | 91 | 97 |
| 3 μmol/L Quinidine | 0 | 0 | 10 | 10 | −38 | −38 | ||
| 2D6 | Dex+Dex-G | 1 mmol/L ABT | 100 | 91 | 100 | 92 | 100 | 91 |
| 3 μmol/L Quinidine | 47 | 15 | 24 | 16 | 36 | 21 |
Values are expressed as a percentage inhibition (including phase 1 and 2 metabolites). “−38%” denotes the activity was increased by 38% in the presence of the inhibitor.
These results support the use of upcyte® hepatocytes in inhibition studies incubated in short-term assays to derive an IC50 value, or in longer term assays to determine clearance in the presence and absence of selected inhibitors.
CYP induction
Induction of CYP1A2, CYP2B6, CYP2C9, and CYP3A4 in upcyte® hepatocytes
Upcyte® hepatocytes from all four donors tested using a 3 day preculture period were responsive to CYP1A2, CYP2B6, CYP2C9, and CYP3A4 induction by prototypical inducers (Fig.4). The only exception was CYP2C9 induction in upcyte® hepatocytes from Donor 653-03, in which this activities was already relatively high (51 pmol/min/mg). The responsiveness to CYP inducers was a significant finding as induction of CYP2B6 in first-generation upcyte® hepatocytes only evident at the mRNA level (Burkard et al. 2012). This suggests the responsiveness of these cells, especially via CAR, was improved by the refined process used to produce second-generation upcyte® hepatocytes. Likewise, upcyte® hepatocytes demonstrated functional AhR- and PXR-mediated CYP induction as CYP1A2 and CYP3A4 were also induced by omeprazole and rifampicin, respectively.
Figure 4.
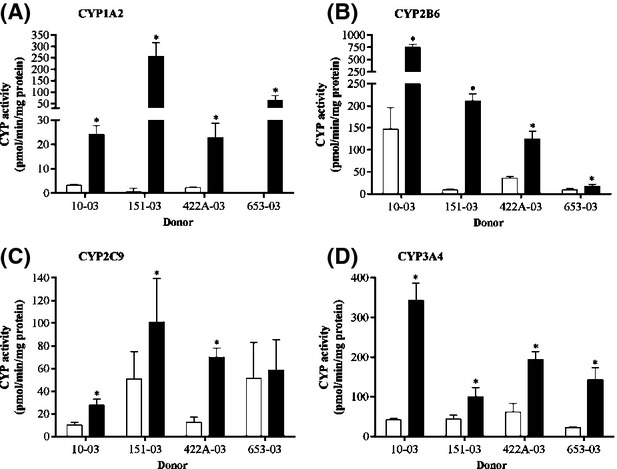
Induction of (A) CYP1A2 (by 50 μmol/L omeprazole), (B) CYP2B6 (by 2 mmol/L phenobarbital), (C) CYP2C9 (by 20 μmol/L rifampicin), and (D) CYP3A4 (by 20 μmol/L rifampicin) in upcyte® hepatocytes from Donors 10-03, 151-03, 422A–03, and 653-03. White bars indicate control values and black bars indicate values for the prototypical inducers. Values are the mean ± SD from triplicates.
In order to rule out false positive results from CYP3A4 induction studies, the FDA recommends including a negative control, that is, a noninducer, in each induction assay. In these assays, two negative controls were included, namely quinidine (0.1–250 μmol/L) and flumazenil (0.05–50 μmol/L), both of which did not induce CYP3A4 or CYP2B6 at any concentration tested (data not shown).
Prediction models for in vivo CYP3A4 induction
There are three main prediction models recommended by the FDA, EMA, and PhARMA for CYP3A4 induction (Chu et al. 2009; EMA, 2012; FDA, 2012), namely, the RIS, AUCu/F2, and Cmax,u/Ind50. Data from upcyte® hepatocytes from Donor 653 were used to compare the different models (Fig.5). Of the three, the fit was best when the RIS (R2 = 0.92) and Cmax,u/Ind50 (R2 = 0.93) were used; however, the F2 value (R2 = 0.89) may also be used when compounds are too toxic or insoluble to reach a maximal induction response. The Indmax and Ind50 values from all four donors were applied to the RIS model (values shown in Table4) and, although the calibration curves were different across donors, they all exhibited a good fit of the data (R2 = 0.87–0.94, Figs.5C, 6).
Figure 5.
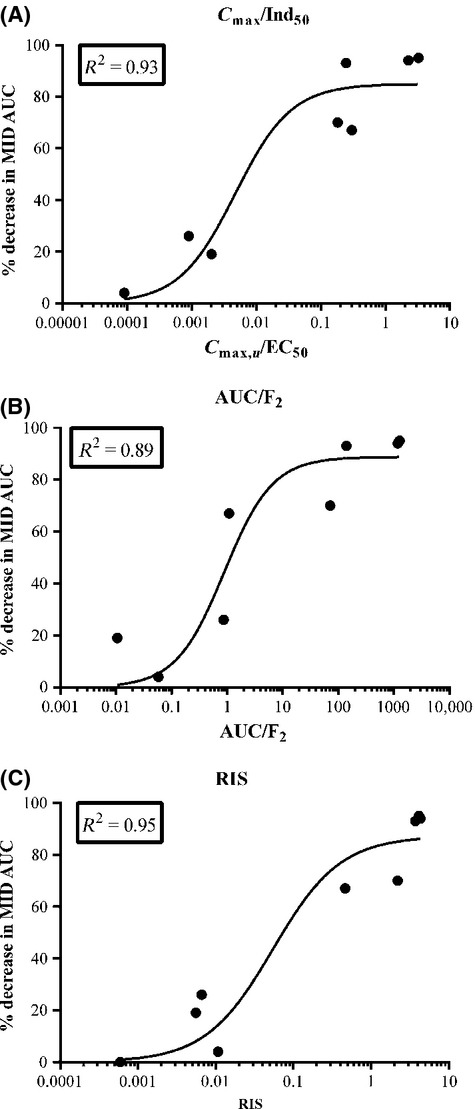
Comparison of calibration curves for (A) RIS, (B) AUCu/F2, and (C) Cmax,u/Ind50 using upcyte® hepatocytes from Donor 653. Values are the mean from duplicate values of two experiments. RIS, relative induction score.
Table 4.
CYP3A4 induction responses of upcyte® hepatocytes from different donors to known inducers and noninducers of CYP3A4
| Donor 10-03 | Donor 151-03 | Donor 422A-03 | Donor 653-03 | |||||||||||
|---|---|---|---|---|---|---|---|---|---|---|---|---|---|---|
| Compound | Cu (mM) | % Decrease in midazolam AUC | Indmax | Ind50 | RIS | Indmax | Ind50 | RIS | Indmax | Ind50 | RIS | Indmax | Ind50 | RIS |
| Rifampicin | 2.5 | 93 | 38.5, 23.7 | 43.6, 32.0 | 1.904 | 5.8, 8.7 | 5.4, 19.1 | 1.419 | 11.4, 12.7 | 7.9, 15.1 | 2.229 | 11.4, 8.6 | 6.6, 2.5 | 3.715 |
| Phenobarbital | 26 | 70 | 23.8, 22.9 | 688, 1153 | 0.685 | 5.5, 5.0 | 51.2, 24.2 | 2.211 | 10.7, 11.8 | 696, 74 | 1.727 | 13.0, 10.5 | 234, 112 | 2.198 |
| Phenytoin | 5.2 | 94 | 20.6, 8.6 | 79.5, 11.5 | 1.970 | 5.7, 3.8 | 1.0, 1.2 | 3.908 | 14.8, 16.9 | 328, 121 | 0.464 | 7.4, 5.2 | 2.3, 2.5 | 4.341 |
| Carbamazepine | 8.5 | 95 | 5.5, 4.1 | 2.4, 23.7 | 2.675 | 4.2, 3.4 | 2.6, 1.5 | 3.071 | 4.0, 4.1 | 16.4, 5.2 | 1.940 | 6.2, 5.2 | 3.8, 2.5 | 4.138 |
| Troglitazone | 0.063 | 67 | 5.0, 4.4 | 2.2, 10.4 | 0.083 | 2.3, 1.3 | 5.1, 0.5 | 0.094 | 2.6, 2.7 | 0.1, 0.1 | 1.030 | 1.8, 2.6 | 1.5, 0.1 | 0.466 |
| Pioglitazone | 0.028 | 26 | 4.4, 4.2 | 10.9, 25.8 | 0.0079 | 4.0, 4.0 | 39.3, 21.6 | 0.0040 | 2.3, 2.8 | 10.3, 43.2 | 0.0040 | 12.3, 6.1 | 78.0, 19.3 | 0.0066 |
| Dexamethasone | 0.026 | 19 | 2.4, 2.5 | 160, 210 | 0.00035 | 4.3, 2.7 | 3.9, 21.5 | 0.0159 | 3.2, 3.6 | 31.9, 31.0 | 0.0028 | 2.6, 2.8 | 20.6, 9.3 | 0.0056 |
| Quinidine | 0.98 | 0 | No induction | No induction | No induction | No induction | ||||||||
| Nifedipine | 0.001 | 4 | 1.6, 2.7 | 0.4, 0.5 | 0.00707 | 4.4, 4.8 | 1.3, 9.8 | 0.0027 | No induction | 8.3, 6.1 | 36.8, 9.9 | |||
| Omeprazole | 0.04 | 0 | No induction | No induction | No induction | No induction | ||||||||
| Flumazenil | 0.05 | 0 | No induction | No induction | No induction | No induction | ||||||||
The unbound plasma concentrations (Cmax) and in vivo induction values (expressed as a % decrease in the AUC of midazolam) used in the calculation of the Relative Induction Score (RIS, mean of two experiments) are shown for each compound.
Figure 6.
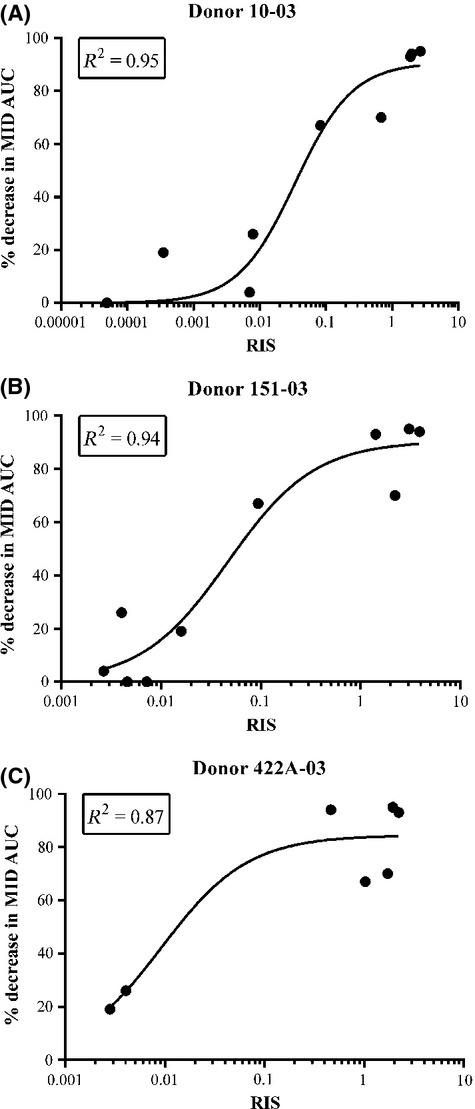
Comparison of calibration curves for RIS from three donors of upcyte® hepatocytes (Donor 10-03 (A); Donor 151-03 (B) and Donor 422A-03 (C)). Values are the mean from duplicate values of two experiments. RIS, relative induction score.
CAR and PXR selective induction of CYP3A4 and CYP2B6 in upcyte® hepatocytes
The relative induction of CYP2B6 and CYP3A4 is known to be a result of selective activation of either the PXR or CAR receptors (Faucette et al. 2007); therefore, we investigated this attribute by treating upcyte® hepatocytes with different inducers and measuring CYP3A4 and CYP2B6 activities in the same wells. Table5 summarizes the CYP3A4 and CYP2B6 induction responses of upcyte® hepatocytes from all donors to the same compounds tested for CYP3A4 induction. Figure7 compares the relative induction of both CYPs (compared to the maximal fold induction by the positive controls, according to equation 2 in the Materials and Methods) by the PXR selective drug, rifampicin, the CAR-selective drugs, phenytoin and carbamazepine; and the mixed activator, phenobarbital in all four donors. The relative induction of CYP3A4 and CYP2B6 was compound-specific and donor-dependent. Rifampicin was a potent inducer of CYP3A4 in all upcyte® hepatocytes (Table5), and only phenobarbital and phenytoin caused a higher induction (137% and 120% of rifampicin maximal induction in Donor 422A-03 and Donor 653-03, respectively (Fig.7C, D, gray bars). Rifampicin was also a strong inducer of CYP2B6 in upcyte® hepatocytes from Donor 422A-03 (108% of the maximal PB response, Fig.7C). In contrast, rifampicin was only a moderate inducer of CYP2B6 in upcyte® hepatocytes from Donors 10-03, 151-03, and 653-03 (between 14% and 34% of the maximal PB response). Phenobarbital was a strong inducer of both CYP3A4 and CYP2B6 and resulted in maximal induction of both CYPs in upcyte® hepatocytes from all four donors. Phenytoin was also a strong inducer of CYP3A4, in keeping with the findings of Raucy (Raucy 2003) who showed that phenytoin increased CYP3A4 mRNA markedly and the response was equivalent to that seen with rifampicin. Phenytoin is a weak PXR activator (Raucy 2003) and was subsequently shown to be a selective activator of CAR (Wang et al. 2004). This was reflected in these studies by the predominance for CYP2B6 over CYP3A4 induction by this compound in three of the four donors (e.g., the induction of CYP2B6 and CYP3A4 in upcyte® hepatocytes from Donor 151-03 was 130% and 60% of the positive controls, respectively). Although carbamazepine was a moderate inducer of CY3A4 and CYP2B6, the relative predominance for CYP2B6 induction was also evident for this CAR-selective compound in three of the four Donors.
Table 5.
CYP3A4 induction responses of upcyte® hepatocytes from different donors to known inducers and noninducers of CYP3A4 and CYP2B6
| Donor 10-03 | Donor 151-03 | Donor 422A-03 | Donor 653-03 | |||||||||||||
|---|---|---|---|---|---|---|---|---|---|---|---|---|---|---|---|---|
| CYP3A4 | CYP2B6 | CYP3A4 | CYP2B6 | CYP3A4 | CYP2B6 | CYP3A4 | CYP2B6 | |||||||||
| Compound | Indmax | % Rif | Indmax | % PB | Indmax | % Rif | Indmax | % PB | Indmax | % Rif | Indmax | % PB | Indmax | Ind50 | Indmax | % PB |
| Rifampicin | 31.1 | 100 | 2.0 | 34 | 7.2 | 100 | 1.3 | 14 | 11.9 | 100 | 7.8 | 108 | 10.0 | 100 | 1.6 | 29 |
| Phenobarbital | 23.3 | 74 | 3.9 | 100 | 5.2 | 68 | 2.9 | 100 | 11.3 | 95 | 7.3 | 100 | 11.8 | 120 | 3.1 | 100 |
| Phenytoin | 14.6 | 45 | 3.6 | 88 | 4.7 | 60 | 2.7 | 89 | 15.8 | 137 | 4.0 | 48 | 6.3 | 59 | 2.8 | 85 |
| Carbamazepine | 4.8 | 13 | 2.0 | 33 | 3.8 | 45 | 2.3 | 68 | 4.0 | 28 | 4.3 | 52 | 5.7 | 52 | 1.4 | 17 |
| Troglitazone | 4.7 | 12 | 5.4 | 150 | 1.8 | 13 | 2.1 | 57 | 2.7 | 15 | 5.0 | 63 | 2.2 | 14 | 2.3 | 63 |
| Pioglitazone | 4.3 | 11 | 2.6 | 55 | 4.0 | 48 | 1.9 | 49 | 2.6 | 14 | 3.6 | 42 | 9.2 | 91 | 2.1 | 54 |
| Dexamethasone | 2.5 | 5 | No induction | 3.5 | 39 | No induction | 3.4 | 22 | No induction | 2.7 | 19 | No induction | ||||
| Nifedipine | 2.1 | 4 | 3.9 | 98 | 4.6 | 58 | No induction | Not determined | No induction | 7.2 | 69 | No induction | ||||
| Omeprazole | 2.3 | 4 | 2.0 | 31 | 3.1 | 34 | No induction | Not determined | Not determined | 1.5 | 5 | 2.2 | 56 | |||
| Flumazenil | No induction | No induction | No induction | No induction | No induction | No induction | No induction | No induction | ||||||||
| Quinidine | No induction | No induction | No induction | No induction | No induction | No induction | No induction | No induction | ||||||||
Indmax is the maximum fold induction of CYP activity induced by the compound. The relative % of the positive control for CYP3A4 (“%Rif”) and CYP2B6 (“%PB”) was calculated according to equation 2, as described in the Materials and Methods. Values are means from two experiments.
Figure 7.
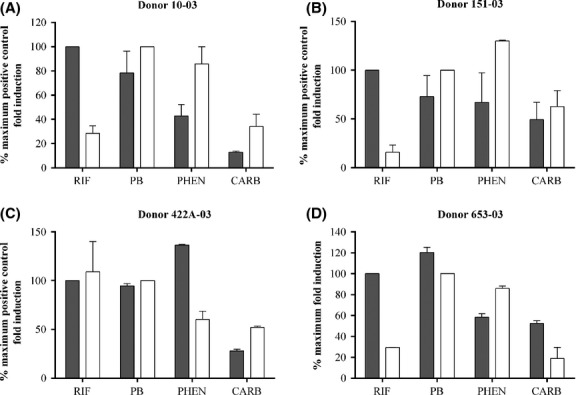
A comparison of % maximum fold induction by rifampicin, phenobarbital, phenytoin, and carbamazepine in upcyte® hepatocytes from different donors (Donor 10-03 (A); Donor 151-03 (B); Donor 422A-03 (C); Donor 653-03 (D)). Black bars indicate values for CYP3A4 and white bars indicate values for CYP2B6. Values are the mean from duplicate values of 2 experiments.
Discussion
We have investigated the applicability of second-generation upcyte® hepatocytes to metabolism-related assays. In order to carry out these assays, the cells should express sufficient levels of CYP activities; therefore, our initial studies explored whether the inclusion of DMSO in the media could increase CYP activities. DMSO is known to induce CYP3A4 activities in primary human hepatocytes (LeCluyse 2001) and CYP3A4 and CYP2B6 activities in HepaRG cells (Antherieu et al. 2010) by activating PXR and/or CAR, although, CYP1A2 is not induced over the same concentration of DMSO (LeCluyse 2001). Our investigations confirmed that supplementing the medium with DMSO could be beneficial to the overall XME properties of the cells. During the preculture, HGM can be supplemented with 0.5% DMSO but during the conditioning period, HPM and not HGM should be used as the basal medium and optimally supplemented with 0.1% DMSO. The reason for lower XME activities cells conditioned in DMSO-supplemented HGM may be due to a downregulation of CYPs when the DMSO concentration is maintained at the higher concentration and/or that factors in the growth medium may not be suitable for differentiating the cells once they reach confluence. The concentration of 0.1% DMSO in the conditioning medium was considered acceptable as it is the standard solvent and concentration for many test compound control incubations.
The metabolism studies conducted in two laboratories demonstrated that second-generation upcyte® hepatocytes maintained in optimized culture conditions expressed good levels of CYP activities equivalent to or higher than those in paired primary cell cultures from the same donor. With the exception of CYP1A2, the CYP activities were generally higher than in their corresponding primary human hepatocyte cultures. Despite the low CYP1A2 activities demonstrated in short-term incubations of 1 h, longer incubations of 24 h showed that CYP1A2 substrates were also metabolized. Moreover, in the case of CYP2B6 and CYP3A4, activities in upcyte® hepatocytes were 5- to 10-fold higher then paired primary cultures. Although different substrate concentrations were used, the relative levels of activities measured in upcyte® hepatocytes from different donors was comparable in the two laboratories, confirming that shipment of live cells does not markedly compromise the cells. The good levels of CYP activities in these cells makes them a promising model for long-term (>24 h) incubations for generating and identifying metabolites, as well as clearance and inhibition studies, which all require XMEs higher than that present in short-term cultures of primary human hepatocytes. Upcyte® hepatocytes therefore offer an advantage over liver microsomes and hepatocytes, which generally do not metabolize test compounds sufficiently in short-term assays (<24 h) to determine an area under the curve measurement (Di et al. 2012). The studies carried out in Lab 2 also support the use of upcyte® hepatocytes in clearance assays for stable compounds, as these were conducted over 24 h and demonstrated good metabolic function over the entire incubation period. In additional to metabolism studies, we have shown that second-generation upcyte® hepatocytes can also be used in CYP inhibition studies, which also require sufficient metabolic activities to ensure a good dynamic range. For CYP1A2, inhibition assays can be conducted using a 24 h incubation period to ensure higher control activities; whereas, incubations of 1 h require boosting of CYP activity by preinducing CYP1A2 (e.g., with omeprazole). All four CYPs were inhibited in a concentration-dependent manner and the calculated IC50 values confirmed that all reference compounds tested were potent inhibitors of the respective CYPs.
Second-generation upcyte® hepatocytes were responsive to prototypical CYP1A2, CYP2B6, CYP2C9, and CYP3A4 inducers, confirming that they have functional AhR-, CAR-, and PXR-mediated CYP regulation. Additional studies carried out at Lab 2 investigated the effect of prototypical inducers (omeprazole, phenobarbital, and rifampicin) on a panel of CYP, UDP-glucuronosyltransferase (UGT), and transporter mRNAs and showed that the induction pattern was similar to that in human hepatocytes (data not shown). These findings support the use of second-generation upcyte® hepatocytes for investigating the induction of multiple genes using mRNA as the endpoint measurement. Like primary human hepatocytes, there were differences in the responsiveness of upcyte® hepatocytes to CYP inducers. There were also differences in the CYP3A4 and CYP2B6 induction responses in the same cultures of upcyte® hepatocytes to different inducers. For example, phenytoin preferentially activates CAR over PXR, evident in these cells as a more potent induction of CYP2B6 than CYP3A4 at the same concentration. By contrast, rifampicin was a more potent inducer of CYP3A4 than phenytoin, indicative of the preferential activation of PXR by this potent inducer. The CAR and PXR selective induction of CYP3A4 and CYP2B6 in upcyte® hepatocyte correspond to the findings of Faucette et al. (2004) who reported phenytoin, phenobarbital, and rifampicin to be classified as strong inducers, and carbamazepine as a moderate inducer of CYP2B6 (based on mean fold induction values). By contrast, dexamethasone – a known PXR selective activator – did not induce CYP2B6 in upcyte® hepatocytes from any of the donors but it was a weak inducer of CYP3A4 (Table5). Troglitazone is a mixed PXR/CAR activator and induced both CYP3A4 and CYP2B6. This drug is known to cause in vivo CYP3A4 induction; whereas, pioglitazone is a weak inducer (Sahi et al. 2003; Ripp et al. 2006). In upcyte® hepatocytes, troglitazone was a more potent inducer of both CYP3A4 and CYP2B6 than pioglitazone, either due to a higher fold induction or a lower Ind50 (i.e., the efficiency ratio was higher).
There was a good fit of data from these studies when they were applied to three different predictive models for CYP3A4 induction, namely the RIS, AUCu/F2, and Cmax,u/Ind50. Importantly, there was a very good intra- and interexperimental reproducibility of the measurements for all end points measured in these studies. Induction studies on one donor of first-generation upcyte® hepatocytes showed that the Indmax and Ind50 values, and consequently the RIS values, were similar at each growth stage (spanning 15 PDs) (Burkard et al. 2012). Additional investigations on second-generation upcyte® hepatocytes showed that the fold induction of CYP3A4 by rifampicin was also consistent at different stages of growth (between a PD of 21 and 42 (Levy et al. 2015)). Therefore, as the PD of all the cells used in these studies was between 20 and 25, we did not expect marked variation in the results between batches from the same donor. For researchers employing the RIS calibration curve as part of their screening process, the robust nature of these cells means that the calibration curve would not need to be repeated once established (although a yearly check would be advisable). By contrast, those who employ cryopreserved human hepatocytes for the same assay need to re-establish a new calibration curve for each batch once the previous batch is depleted. Since billions of upcyte® hepatocytes from a number of donors are available results over a period of years can be compared.
In conclusion, second-generation upcyte® hepatocytes are a promising model with which to test the metabolism and drug interaction potential of novel compounds prior to being tested in regulatory submission studies using primary human hepatocytes. Upcyte® hepatocytes represent a more predictive and relevant tool for predicting enzyme induction than PXR activation studies or receptor-binding assays. A genome-wide comparison between these cells and primary hepatocytes and/or human liver tissue would be necessary to confirm their use as a surrogate for primary hepatocytes. Under the culture conditions used, these cells expressed good amounts of CYP activities, which could be inhibited by CYP-selective inhibitors. Upcyte® hepatocytes are responsive to CYP1A2, CYP2B6, CYP2C9, and CYP3A4 induction and can be used to predict in vivo CYP3A4 induction potential using three common prediction models. The availability of large quantities of cells from multiple donors makes upcyte® hepatocytes suitable for drug–drug interaction (DDI) screening, as well as more in-depth mechanistic investigations.
Acknowledgments
The work leading to these results has received funding from the European Union Seventh Framework Program (FP7/2007–2013) under the grant agreement no. 304961.
Glossary
- ABT
1-aminobenzotriazole
- AhR
aryl hydrocarbon receptor
- AUC
area under the curve
- CAR
constitutive androstane receptor
- Cmax,u
unbound plasma concentration of the drug
- CYP
cytochrome P450
- DMSO
dimethyl sulfoxide
- F2
concentration causing a twofold induction
- HGM
hepatocyte growth medium
- HPM
high-performance medium
- HTM
hepatocyte thawing medium
- Ind50
concentration causing 50% maximal induction
- Indmax
maximum fold induction
- KHB
Krebs henseleit buffer
- PBS
phosphate-buffered saline
- PD
population doubling
- RIS
relative induction score
- TLDA
Taqman® low-density array
- UGT
UDP-glucuronosyltransferase
- XMEs
xenobiotic metabolizing enzymes
Author Contributions
Sarada Devi Ramachandran, Nicola J. Hewitt, Aurélie Vivarès and Sylvie Klieber were responsible for the research design, experimental work, data analysis; and wrote or contributed to the manuscript; Bernhard Münst contributed to the experimental work and to the manuscript; and Joris Braspenning and Heike Walles contributed to the manuscript.
Disclosure
None declared.
Supporting Information
Additional Supporting Information may be found in the online version of this article:
Figure S1. Inhibition of (A) CYP1A2 by α–naphthoflavone, (B) CYP2B6 by ticlopidine, (C) CYP2C9 by miconazole, and (D) CYP3A4 by ketoconazole in upcyte® hepatocytes from Donors 10-03, 151-03, and 653-03.
References
- Antherieu S, Chesne C, Li R, Camus S, Lahoz A, Picazo L. Stable expression, activity, and inducibility of cytochromes P450 in differentiated HepaRG cells. Drug Metab Dispos. 2010;38:516–525. doi: 10.1124/dmd.109.030197. , et al. ( [DOI] [PubMed] [Google Scholar]
- Burkard A, Dahn C, Heinz S, Zutavern A, Sonntag-Buck V, Maltman D. Generation of proliferating human hepatocytes using Upcyte(R) technology: characterisation and applications in induction and cytotoxicity assays. Xenobiotica. 2012;42:939–956. doi: 10.3109/00498254.2012.675093. , et al. ( [DOI] [PubMed] [Google Scholar]
- Chu V, Einolf HJ, Evers R, Kumar G, Moore D, Ripp S. In vitro and in vivo induction of cytochrome p450: a survey of the current practices and recommendations: a pharmaceutical research and manufacturers of America perspective. Drug Metab Dispos. 2009;37:1339–1354. doi: 10.1124/dmd.109.027029. , et al. ( [DOI] [PubMed] [Google Scholar]
- Di L, Keefer C, Scott DO, Strelevitz TJ, Chang G, Bi YA. Mechanistic insights from comparing intrinsic clearance values between human liver microsomes and hepatocytes to guide drug design. Eur J Med Chem. 2012;57:441–448. doi: 10.1016/j.ejmech.2012.06.043. , et al. ( [DOI] [PubMed] [Google Scholar]
- EMA. Guideline on the investigation of drug interactions. 2012. . 21 June 2012, CPMP/EWP/560/95/Rev. 1 Corr. 2, Committee for Human Medicinal Products (CHMP) http://www.ema.europa.eu/docs/en_GB/document_library/Scientific_guideline/2012/07/WC500129606.pdf. [Google Scholar]
- Emoto C, Murase S, Sawada Y, Iwasaki K. In vitro inhibitory effect of 1-aminobenzotriazole on drug oxidations in human liver microsomes: a comparison with SKF-525A. Drug Metab Pharmacokinet. 2005;20:351–357. doi: 10.2133/dmpk.20.351. [DOI] [PubMed] [Google Scholar]
- Fahmi OA, Boldt S, Kish M, Obach RS, Tremaine LM. Prediction of drug-drug interactions from in vitro induction data: application of the relative induction score approach using cryopreserved human hepatocytes. Drug Metab Dispos. 2008;36:1971–1974. doi: 10.1124/dmd.108.021907. [DOI] [PubMed] [Google Scholar]
- Faucette SR, Wang H, Hamilton GA, Jolley SL, Gilbert D, Lindley C. Regulation of CYP2B6 in primary human hepatocytes by prototypical inducers. Drug Metab Dispos. 2004;32:348–358. doi: 10.1124/dmd.32.3.348. , et al. ( [DOI] [PubMed] [Google Scholar]
- Faucette SR, Zhang TC, Moore R, Sueyoshi T, Omiecinski CJ, LeCluyse EL. Relative activation of human pregnane X receptor versus constitutive androstane receptor defines distinct classes of CYP2B6 and CYP3A4 inducers. J Pharmacol Exp Ther. 2007;320:72–80. doi: 10.1124/jpet.106.112136. , et al. ( [DOI] [PMC free article] [PubMed] [Google Scholar]
- FDA. Guidance for industry: drug interaction studies — study design, data analysis, implications for dosing, and labeling recommendations (Research CfDEa ed) 2012. http://www.fda.gov/downloads/drugs/guidancecomplianceregulatoryinformation/guidances/ucm292362.pdf. [Google Scholar]
- Georgoff I, Secott T, Isom HC. Effect of simian virus 40 infection on albumin production by hepatocytes cultured in chemically defined medium and plated on collagen and non-collagen attachment surfaces. J Biol Chem. 1984;259:9595–9602. [PubMed] [Google Scholar]
- Hariparsad N, Carr BA, Evers R, Chu X. Comparison of immortalized Fa2N-4 cells and human hepatocytes as in vitro models for cytochrome P450 induction. Drug Metab Dispos. 2008;36:1046–1055. doi: 10.1124/dmd.108.020677. [DOI] [PubMed] [Google Scholar]
- Hewitt NJ, Lecluyse EL, Ferguson SS. Induction of hepatic cytochrome P450 enzymes: methods, mechanisms, recommendations, and in vitro-in vivo correlations. Xenobiotica. 2007;37:1196–1224. doi: 10.1080/00498250701534893. [DOI] [PubMed] [Google Scholar]
- Kanebratt KP, Andersson TB. HepaRG cells as an in vitro model for evaluation of cytochrome P450 induction in humans. Drug Metab Dispos. 2008;36:137–145. doi: 10.1124/dmd.107.017418. [DOI] [PubMed] [Google Scholar]
- LeCluyse EL. Human hepatocyte culture systems for the in vitro evaluation of cytochrome P450 expression and regulation. Eur J Pharm Sci. 2001;13:343–368. doi: 10.1016/s0928-0987(01)00135-x. [DOI] [PubMed] [Google Scholar]
- Levy G, Bomze D, Heinz S, Ramachandran SD, Noerenberg A, Shibolet O. Genetic induction of metabolically functional, polarized cultures of proliferating human hepatocytes. Nat Biotechnol. 2015 doi: 10.1038/nbt.3377. , et al. ( in press. [DOI] [PubMed] [Google Scholar]
- Mao J, Mohutsky MA, Harrelson JP, Wrighton SA, Hall SD. Predictions of cytochrome P450-mediated drug-drug interactions using cryopreserved human hepatocytes: comparison of plasma and protein-free media incubation conditions. Drug Metab Dispos. 2012;40:706–716. doi: 10.1124/dmd.111.043158. [DOI] [PubMed] [Google Scholar]
- Moeller T, Worzella T, Sobol M, Ma D, Cali JJ, Larson B. Comparison of inhibition of CYP1A2, 2C9 and 3A4 using human liver microsomes and hepatocytes. Toronto: ISSX; 2013. [Google Scholar]
- Mostafavi SA, Tavakoli N. Relative bioavailability of omeprazole capsules after oral dosing. DARU J Pharm Sci. 2004;12:146–150. [Google Scholar]
- Nörenberg A, Heinz S, Scheller K, Hewitt NJ, Braspenning J, Ott M. Optimization of upcyte(R) human hepatocytes for the in vitro micronucleus assay. Mutat Res. 2013;758:69–79. doi: 10.1016/j.mrgentox.2013.09.008. [DOI] [PubMed] [Google Scholar]
- Raucy JL. Regulation of CYP3A4 expression in human hepatocytes by pharmaceuticals and natural products. Drug Metab Dispos. 2003;31:533–539. doi: 10.1124/dmd.31.5.533. [DOI] [PubMed] [Google Scholar]
- Richter T, Murdter TE, Heinkele G, Pleiss J, Tatzel S, Schwab M. Potent mechanism-based inhibition of human CYP2B6 by clopidogrel and ticlopidine. J Pharmacol Exp Ther. 2004;308:189–197. doi: 10.1124/jpet.103.056127. , et al. ( [DOI] [PubMed] [Google Scholar]
- Ripp SL, Mills JB, Fahmi OA, Trevena KA, Liras JL, Maurer TS. Use of immortalized human hepatocytes to predict the magnitude of clinical drug-drug interactions caused by CYP3A4 induction. Drug Metab Dispos. 2006;34:1742–1748. doi: 10.1124/dmd.106.010132. , et al. ( [DOI] [PubMed] [Google Scholar]
- Sahi J, Black CB, Hamilton GA, Zheng X, Jolley S, Rose KA. Comparative effects of thiazolidinediones on in vitro P450 enzyme induction and inhibition. Drug Metab Dispos. 2003;31:439–446. doi: 10.1124/dmd.31.4.439. , et al. ( [DOI] [PubMed] [Google Scholar]
- Scheller K, Dally I, Hartmann N, Munst B, Braspenning J, Walles H. Upcyte(R) microvascular endothelial cells repopulate decellularized scaffold. Tissue Eng Part C Methods. 2013;19:57–67. doi: 10.1089/ten.tec.2011.0723. [DOI] [PMC free article] [PubMed] [Google Scholar]
- Turpeinen M, Nieminen R, Juntunen T, Taavitsainen P, Raunio H, Pelkonen O. Selective inhibition of CYP2B6-catalyzed bupropion hydroxylation in human liver microsomes in vitro. Drug Metab Dispos. 2004;32:626–631. doi: 10.1124/dmd.32.6.626. [DOI] [PubMed] [Google Scholar]
- Wang H, Faucette S, Moore R, Sueyoshi T, Negishi M, LeCluyse E. Human constitutive androstane receptor mediates induction of CYP2B6 gene expression by phenytoin. J Biol Chem. 2004;279:29295–29301. doi: 10.1074/jbc.M400580200. [DOI] [PubMed] [Google Scholar]
- Westerink WM, Schoonen WG. Cytochrome P450 enzyme levels in HepG2 cells and cryopreserved primary human hepatocytes and their induction in HepG2 cells. Toxicol In Vitro. 2007;21:1581–1591. doi: 10.1016/j.tiv.2007.05.014. [DOI] [PubMed] [Google Scholar]
- Youdim KA, Tyman CA, Jones BC, Hyland R. Induction of cytochrome P450: assessment in an immortalized human hepatocyte cell line (Fa2N4) using a novel higher throughput cocktail assay. Drug Metab Dispos. 2007;35:275–282. doi: 10.1124/dmd.106.012864. [DOI] [PubMed] [Google Scholar]
- Yu A, Haining RL. Comparative contribution to dextromethorphan metabolism by cytochrome P450 isoforms in vitro: can dextromethorphan be used as a dual probe for both CTP2D6 and CYP3A activities? Drug Metab Dispos. 2001;29:1514–1520. [PubMed] [Google Scholar]
- Zhou SF, Xue CC, Yu XQ, Li C, Wang G. Clinically important drug interactions potentially involving mechanism-based inhibition of cytochrome P450 3A4 and the role of therapeutic drug monitoring. Ther Drug Monit. 2007;29:687–710. doi: 10.1097/FTD.0b013e31815c16f5. [DOI] [PubMed] [Google Scholar]
Associated Data
This section collects any data citations, data availability statements, or supplementary materials included in this article.
Supplementary Materials
Figure S1. Inhibition of (A) CYP1A2 by α–naphthoflavone, (B) CYP2B6 by ticlopidine, (C) CYP2C9 by miconazole, and (D) CYP3A4 by ketoconazole in upcyte® hepatocytes from Donors 10-03, 151-03, and 653-03.