Abstract
The ability to explain distribution patterns from drug physicochemical properties and binding characteristics has been explored for more than 200 compounds by interrogating data from quantitative whole body autoradiography studies (QWBA). These in vivo outcomes have been compared to in silico and in vitro drug property data to determine the most influential properties governing drug distribution. Consistent with current knowledge, in vivo distribution was most influenced by ionization state and lipophilicity which in turn affected phospholipid and plasma protein binding. Basic and neutral molecules were generally better distributed than acidic counterparts demonstrating weaker plasma protein and stronger phospholipid binding. The influence of phospholipid binding was particularly evident in tissues with high phospholipid content like spleen and lung. Conversely, poorer distribution of acidic drugs was associated with stronger plasma protein and weaker phospholipid binding. The distribution of a proportion of acidic drugs was enhanced, however, in tissues known to express anionic uptake transporters such as the liver and kidney. Greatest distribution was observed into melanin containing tissues of the eye, most likely due to melanin binding. Basic molecules were consistently better distributed into parts of the eye and skin containing melanin than those without. The data, therefore, suggest that drug binding to macromolecules strongly influences the distribution of total drug for a large proportion of molecules in most tissues. Reducing lipophilicity, a strategy often used in discovery to optimize pharmacokinetic properties such as absorption and clearance, also decreased the influence of nonspecific binding on drug distribution.
Keywords: Ionization, lipophilicity, QWBA, tissue distribution, transporters
Introduction
Drug distribution is a complex process dependent on factors governing delivery of drug into tissue as well as retention in, and removal from, the tissue of interest. Absorption, clearance, blood flow, perfusion, binding to biological molecules, permeability, and active transporters all affect delivery of drugs into tissues while additional factors governing retention and release include sequestration in organelles, relative pH, and binding to tissue components.
Quantitative whole body autoradiography (QWBA) is a relatively convenient method to study drug distribution in the whole animal. Typically, a 14C or 3H radioactive drug analog is administered and drug is quantified using an image of a thin slice taken across the whole of the body. The application of QWBA is nicely summarized in articles by Solon (2012) and Wang et al. (2012). The main advantage of QWBA is that it provides a whole-body visualization of tissue distribution which, depending on the sliced section, can provide a radioactivity concentration in virtually all tissues. A QWBA study is usually conducted on most molecules during the discovery/development process and can be regarded as a rich source of distribution data. In excess of 200 QWBA studies, for example, have been completed within GlaxoSmithKline (GSK) over the last 20 years.
A lot of physicochemical property data are generated in early drug discovery to predict how a molecule might behave in the whole animal. The pKa of acidic or basic drugs will determine the degree of ionization in different body compartments: unionized forms being able to readily permeate lipid membranes, whereas ionized forms having the potential to bind to macromolecules or become trapped in organelles. Lipophilicity (e.g., Log P) of a molecule will influence membrane partitioning and permeability. These parameters historically were determined experimentally. Nowadays, however, acid and base pKa, LogP, and many other physicochemical properties, are readily predicted from structure using proprietary or commercially available software. Binding properties also influence a drugs pattern of distribution. Recent advances in biomimetic chromatography (Valko 2014) have enabled the high-throughput determination of binding affinities to biological molecules like phospholipids (Valko et al. 2000) which are able to guide on tissue binding. These and other parameters including the plasma protein binding can be generated as chemicals are synthesized.
A complete study of tissue distribution, however, is best made in vivo in the whole animal where patterns of distribution are the result of drug chemistry interacting with animal biology. In this analysis we have, therefore, compared drug properties for >200 diverse structurally unrelated molecules to in vivo distribution patterns using data derived from QWBA studies. Although the factors governing drug distribution are well established, this is the first time to the authors knowledge that these interdependences have been illustrated using such a large body of QWBA data. A drawback of QWBA is that it measures drug-related material (drug plus metabolites) rather than the unchanged drug molecule. In this investigation, therefore, we have also compared the distribution of radioactivity to the distribution of unchanged drug for approximately 50 molecules where tissue and plasma data were available from rat metabolism studies.
Materials and Methods
Typical design of rat QWBA studies
QWBA studies were performed at various contract organizations including Quest Pharmaceutical Services (Newark, DE), Covance (Harrogate, UK), and Huntingdon Life Sciences (Cambridgeshire, UK). Generally, compounds (usually 14C or 3H drug analogs) were administered once by oral, intravenous, or inhalation routes at doses ranging from 0.4 to 1000 mg/kg. One rat at each time point (typically up to seven time points taken up to 35 days after dosing) was euthanized and frozen in carboxymethylcellulose. Sagittal sections supported on adhesive tape were taken from various levels through the block until the majority of tissues were obtained. Sections were allowed to dry by sublimation and exposed along with radioactive spiked calibration standards to imaging plates. The imaging plates and sections were enclosed in cassettes and exposed for at least 4 days. At the end of the exposure, time images were scanned using various imaging software and quantification was performed relative to the calibration standards. Concentrations of radioactivity were expressed as drug equivalents/g tissue based on the specific activity of the dosed radio label. All animal studies were ethically reviewed and carried out in accordance with the Animals (Scientific Procedures) Act 1986 and the GSK (GlaxoSmithKline) Policy on the Care, Welfare and Treatment of Laboratory Animals.
Analysis of QWBA data
Concentration–time data obtained from each tissue from the QWBA studies were exported into MATLABR software (version R2013b by MathWorks, Natick, MA, US) which was programmed to perform the area under curve (AUC; μg h/g tissue) calculations using a linear logarithmic (lin up-log down) trapezoidal method. For all tissue and blood data for nonintravenous dosing a concentration of “0” was assigned to the start time on the concentration time/curve (t0). For bolus intravenous dosing, the concentration at t0 was calculated using a logarithmic extrapolation of the first two measured data points to t0. For intravenous infusions, the concentration at t0 was set to 0 and the concentration at the end of infusion was calculated using a logarithmic extrapolation of the first two measured data points. Where only two quantifiable time points were available for a tissue, the analytical lower limit of quantification was used as the third time point for AUC calculation purposes. Tissue: Blood AUC ratios of radioactivity (T:B) were determined using AUC(0-inf) ratios of tissue and blood, wherever available. If the AUC(0-inf) extrapolation for any tissue or blood was >15% or if the adjusted R2 of the linear regression for extrapolation was <0.6, then AUC(0-last) values were used. For molecules where a blood AUC could not be calculated due to insufficient data, it was similarly not possible to calculate T:B even where radioactivity was clearly distributed into tissues.
Predicted physicochemical properties
Acid and base pKa and cLogP were predicted from molecular structure using proprietary software. These parameters and other scientific terms utilized in this work are summarized in Table1 (Glossary of Terms).
Table 1.
Glossary of terms
| Tissue: blood area under curve (AUC) ratio of radioactivity (T:B) | Calculated from quantitative whole body autoradiography studies (QWBA) studies by dividing the AUC of drug radioactivity concentration in tissues by that in blood |
| Tissue: plasma ratio (T:P) | Calculated from rat metabolism studies by dividing tissue concentrations of either parent drug or radioactivity by the corresponding plasma concentration at the same sample time |
| Base pKa | Basic pKa predicted using proprietary software |
| Acid pKa | Acidic pKa predicted using proprietary software |
| Predicted tissue/plasma partition coefficient (Kp) | Predicted using Lukacova option in Gastroplus software version 8.6 |
| Chromatographic hydrophobicity index – immobilized artificial membrane (CHI-IAM) | A measure of phospholipid binding derived from high-performance liquid chromatography (HPLC) retention using an immobilized artificial membrane stationary phase |
| cLogP | A measure of lipophilicity. cLogP is the logarithm of the partition coefficient between n-octanol and water log(coctanol/cwater) predicted from structure |
Chromatographic hydrophobicity index – immobilized artificial membrane (CHI-IAM)
CHI-IAM was measured for selected molecules using commercially available Immobilized Artificial Membrane solid phase on a PC DD2 100 × 4.6 mm 10 μmol/L (Regis Analytical, IN, West Lafayette) HPLC (High-Performance Liquid Chromatography) column. Retention times were determined using gradients of up to 85% acetonitrile in 50 mmol/L ammonium acetate pH 7.4 which were converted to Chromatographic Hydrophobicity Indices (CHI-IAM) using a calibration set of compounds as described by Valko et al. 2000.
Typical design of rat plasma protein-binding studies
Rat plasma protein binding was most commonly measured by either equilibrium dialysis or ultrafiltration. For equilibrium dialysis, plasma incubated with target drug concentrations were dialyzed against protein-free buffer in equilibrium dialysis chambers separated by a semipermeable membrane. When equilibration was complete, the plasma protein binding was calculated from drug concentration measurements made in the dialysate, plasma retentate, and original incubate. Alternatively ultrafiltration was used to separate unbound drug from that bound to plasma macromolecules by using centrifugation to generate a pressure gradient to force unbound drug through the membrane.
Typical design of rat metabolism studies
The in-life phase of rat metabolism studies was conducted either in house at GSK or contracted to organizations such as Charles River Laboratories (Edinburgh, UK), Covance (Madison, WI, US and Harrogate, UK), and Huntingdon Life Sciences (Cambridgeshire, UK). Generally, radioactive compound (either 14C- or 3H- drug analogs) was administered mostly once by oral, intravenous, or inhalation routes at dose levels ranging from 0.02 to 100 mg/kg. The selected tissues were excised from replicate rats killed usually at a single sample time after dosing. Tissues were excised at multiple sample times for relatively few molecules. Blood samples were taken at multiple sampling times to either study pharmacokinetics or to identify and quantify drug metabolites. For the purposes of this study, those blood/plasma samples taken at sample times other than those used to sample tissues have been disregarded. The total radioactivity concentration (expressed as mass drug equivalents/g tissue) was determined in blood, plasma, and homogenized tissue. Blood or homogenized tissue radioactivity was determined by sample oxidation followed by liquid scintillation counting (LSC). In some cases, the tissue radioactivity was determined by Soluene digestion followed by LSC. For tissues, the homogenate concentration was converted to mass drug equivalents/g tissue using tissue weights taken at the time of excision. Plasma was prepared from blood by centrifugation and radio assayed directly by LSC. The separation, identification, and quantification of metabolites were generally conducted in-house at GSK. Radioactivity was extracted from tissues and plasma using solvent or solid phase extraction. Parent drug and metabolites were then chromatographically separated using suitable radio-HPLC conditions. Parent drug was quantified as a percentage of the total radioactivity in the sample which was converted to a drug concentration per g tissue or plasma by multiplying by the radioactivity concentration after accounting for losses incurred during sample preparation. Where tissue data were reported as per g of homogenate, the drug concentration per g tissue was recalculated using original tissue weights.
Analysis of rat metabolism data
T:P (Tissue: Plasma ratio) of radioactivity and unchanged drug were calculated where possible from rat metabolism studies by dividing the relevant tissue concentration of parent drug by the corresponding plasma concentration. In most cases, T:P was calculated from one sampling occasion per study phase. Where multiple sampling occasions were available, all have been included in the analysis. Sampling occasions were generally between 2 and 6 h although a few samples taken at 0.5 and 8 h after dosing were also included in the analysis.
Predicted tissue/plasma partition coefficient (Kp)
Estimates of Kp were made from structure using the Lukacova method for perfusion limited tissues available from GastroPlus software (version 8.6, Simulations+) to enable crude comparisons with T:P ratios of unchanged drug from metabolism studies. The default rat PB/PK model (0.25 kg) was selected using human blood: plasma ratios and protein binding, also predicted from structure.
Interrogation of data
T:B, parent and radioactivity T:P ratios, rat plasma protein binding, predicted Kp, and drug property data including pKa, cLogP, CHI-IAM, were imported into an Excel spread sheet and interrogated using Spotfire software (version 3.2, TIBCO® Software Inc., Palo Alto, CA). Where multiple T:B were available for a given dose route, the maximum T:B aggregation option was selected. In all cases, the validity of the plots generated was recreated and validated by at least two authors.
Results
A comparison of the distribution of radioactivity and unchanged drug
Whether distribution of radioactivity is representative of distribution of unchanged drug was identified as an important consideration at the onset of this project. We, therefore, compared tissue: plasma ratios (T:P) of radioactivity to that of unchanged drug wherever both parameters could be compared, using radiochromatograms from rat metabolism studies (approximately 50 molecules). Results are shown in Figure1. Underlying data for this comparison are provided in Table S1. Liver and brain were frequently investigated in rat metabolism studies, whereas other tissues including heart and skeletal muscles were less frequently investigated. Overall, there was a trend for T:P of radioactivity and parent drug to be similar (R2 = 0.45). Where T:P of radioactivity is higher than T:P of unchanged drug, metabolites constitute a greater proportion of radioactivity in the tissue compared to plasma. The vast majority of such data points were derived from the liver which is the major drug metabolizing organ in the body and also subject to first pass hepatic extraction following oral administration. By excluding liver from the analysis, the correlation was much improved (R2 = 0.96).
Figure 1.
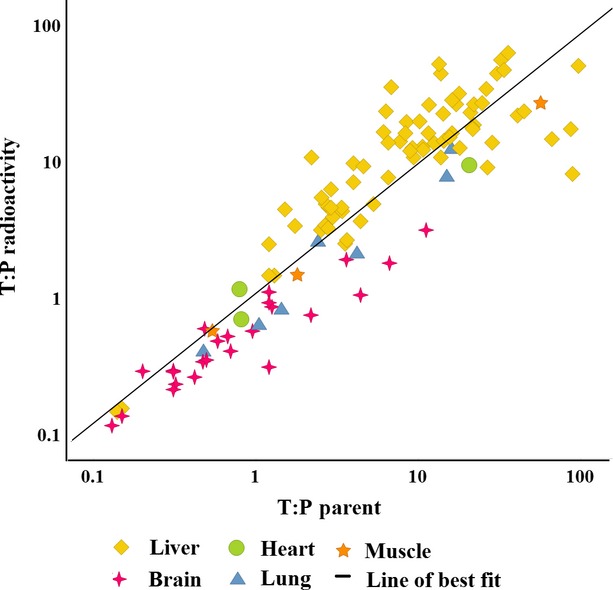
A comparison of the distribution of unchanged parent drug (x axis) and radioactivity (y axis) using tissue: plasma ratios (T:P) derived from rat metabolism studies on all occasions where both radioactivity and parent drug could be quantified in tissue and plasma samples taken at the same sampling time. The data, especially in nonhepatic tissues, provide confidence that it is appropriate to study drug distribution using radioactive drug analogs.
The patterns of distribution were similar when subsets of intravenously dosed molecules were compared to orally dosed molecules and, similarly, when highly metabolized molecules were compared to poorly metabolized compounds (data not shown). The authors believe, therefore, that radioactivity is an appropriate surrogate for studying the distribution of unchanged drug, especially in nonhepatic tissues. Caution, however, should be exercised when studying drug distribution of radioactivity into the liver.
A crude comparison of Tissue: Plasma ratio measurements of unchanged drug to Tissue/Plasma Partition coefficients (Kp) estimated from structure
T:P of unchanged drug was crudely compared to estimates of Kp partition coefficients (Fig.2 and Table S1). Unsurprisingly, there was a very poor correlation (R2 = 0.02) and in Table2 we present several reasons why T:P of unchanged drug from single dose metabolism studies should be dissimilar to Kp. When liver and brain are considered separately, however, it was of interest that the estimates of Kp consistently underpredicted T:P in the liver where uptake transporters are highly expressed. This was true following both oral and intravenous administrations. In comparison Kp overpredicted T:P in the brain where efflux transporters are highly expressed. Using Kp alone to represent passive drug distribution is likely, therefore, to misrepresent in vivo distribution in tissues where drug transporters play an important role.
Figure 2.
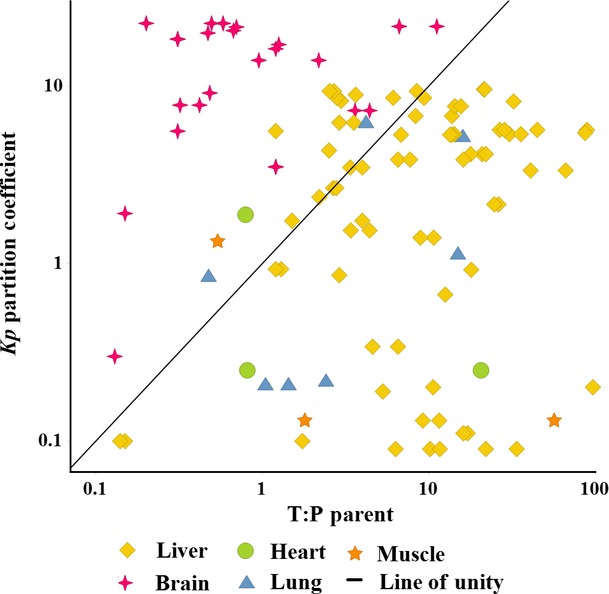
A comparison of tissue Kp partition coefficients (predicted from structure) to tissue: plasma ratios of unchanged drug (T:P Parent; derived from unchanged parent drug concentrations measured during rat metabolism studies). Distribution of unchanged drug showed a very poor correlation with predicted Kp: Kp was overpredicted in tissues like brain, where efflux transporters predominate, but under predicted in other tissues like liver, where uptake transporters predominate.
Table 2.
Comparison of predicted in silico partition coefficient (Kp) to measured tissue: plasma ratios of unchanged drug derived from data generated in pharmacokinetic or metabolism studies
| Tissue: plasma ratio | K p |
|---|---|
| Measured value from animal pharmacokinetic or metabolism studies | Usually an in silico prediction considering structural properties and organ characteristics |
| Typically from a single dose but calculated at multiple sample times | One value – steady state |
| Can be drug-related material (radioactivity) or unchanged drug | Unchanged drug |
| Intrinsically considers the influence of transporters and clearance | Prediction does not consider transporters or clearance |
| Typically varies with sample time, dose route, and dose level | One value – steady state – which does not vary with sample time, dose route, or dose level |
| Typically guides safety assessment on likely target organs | Typically guides PBPK models which guide pharmacology and safety |
Comparison of in vivo tissue distribution data from QWBA studies with measured and predicted drug properties
The analysis interrogated QWBA data comprising greater than 30,000 T:B (Tissue: Blood AUC ratios of radioactivity) from >200 structurally diverse molecules across 150 different tissue types. QWBA study data, T:B from selected tissues and those used to create Figs.6 along with corresponding drug property data are provided in Table S2. At the onset of this project, we used the QWBA distribution data to compare T:B and T:P AUC ratios with individual Tissue: Blood ratios of radioactivity at different sample times in order to select a best measure of tissue distribution (data not shown). Each of these measures demonstrated similar relationships across many different comparisons. The individual sample time data were not pursued since they biased analyses to those molecules where radioactivity was measurable at most sample times. Instead, T:B AUC ratio of radioactivity was selected as the measure of choice since blood concentration of radioactivity is quantified as part of the QWBA experiments, AUC ratio considers the whole concentration/time course and, also, only one value is generated per tissue per dose.
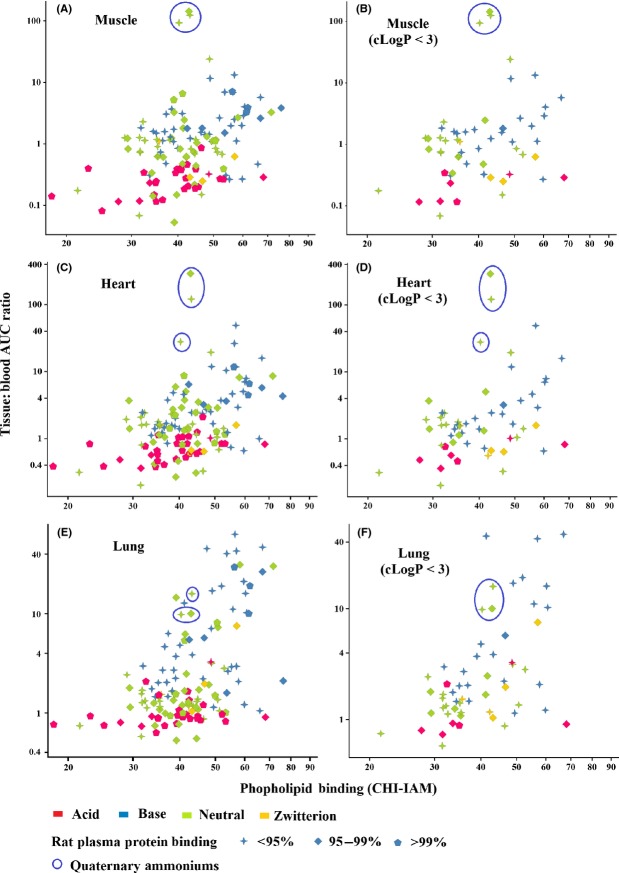
Figure 6.
Using phospholipid and plasma protein binding to visualize molecules whose distribution is less governed by nonspecific binding. Three molecules containing quaternary ammonium groups are well distributed into muscular tissue (heart and skeletal shown here) but not other tissues (e.g., lung) by a mechanism less influenced by nonspecific binding. Reducing lipophilicity (e.g., by excluding molecules where cLogP > 3) decreases the influence of nonspecific binding on drug distribution.
Distribution of acidic and basic molecules (ionization state)
Tissue distribution of basic molecules (containing a basic moiety with pKa > 7) and acidic molecules (containing an acidic moiety with pKa < 7) is compared in Fig.3A and B, respectively. Basic drugs were generally better distributed than acidic drugs with the range of T:B spanning an extra order of magnitude. For basic molecules, the greatest distribution was clearly associated with the melanin containing tissues of the uveal tract in the eye including choroid/retina, ciliary bodies, and iris. Drug-related material was less well distributed into other parts of the eye. Similarly, basic molecules were better distributed into pigmented skin (containing melanin) than nonpigmented skin. These observations illustrate the influence of binding on drug distribution. For acidic molecules, particularly those with a low acid pKa, there was no consistent target tissue.
Figure 3.
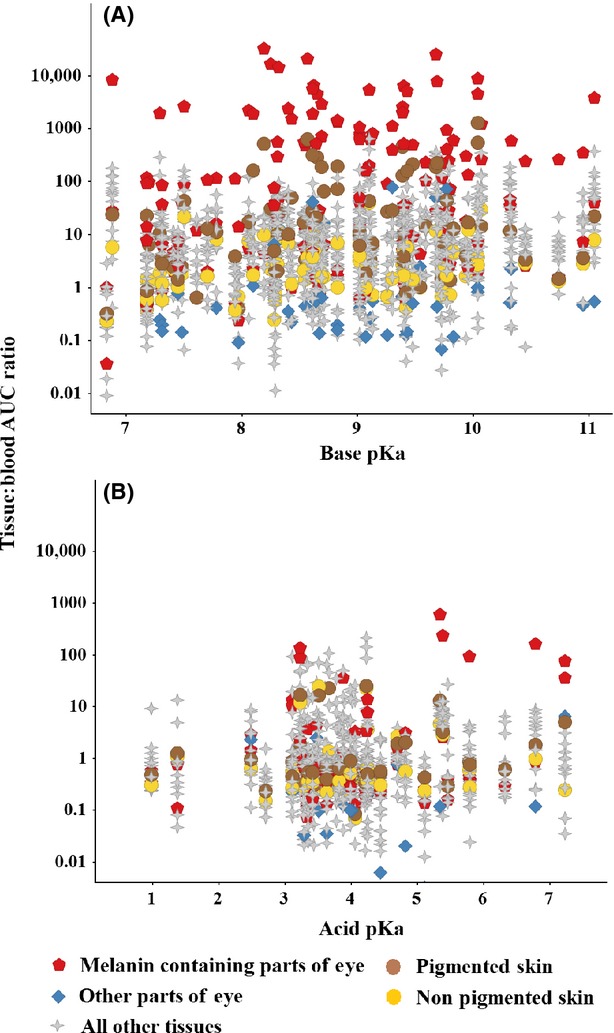
Comparison of the distribution of basic and acidic molecules using all tissues in the data set. Basic drugs (Panel A) were more highly distributed than acidic drugs (Panel B). Distribution of bases into melanin containing tissues of the eye such as choroid/retina, iris and ciliary bodies was consistently greater than for all other tissues including nonmelanin containing parts of the eye (aqueous humor, cornea, lens, eyelid, glands, and optic nerve – only highest T:B AUC ratio for each compound/dose/route plotted on Fig.3). Distribution into pigmented skin (containing melanin) and nonpigmented skin is also compared. These observations highlight the influence of binding on distribution of total drug.
For a proportion of basic molecules, tissue distribution was dramatically increased if the basic pKa was greater than physiological tissue pH, where the drug would predominantly exist in its ionized form within the tissue (Fig.4A). On the other hand, tissue distribution did not dramatically increase when the acid pKa was less than the physiological tissue pH (Fig.4B) suggesting that ionized form in tissue is an important factor governing distribution of basic drugs but is less influential on the distribution of acidic molecules. A cluster of acidic molecules with pKa 3–4, however, showed enhanced uptake into the liver, adrenals, and kidney (tissues where anionic uptake transporters are known to be expressed). This same pattern could not be recreated in other tissues where anionic transporters have less expression (e.g., testis, lung).
Figure 4.
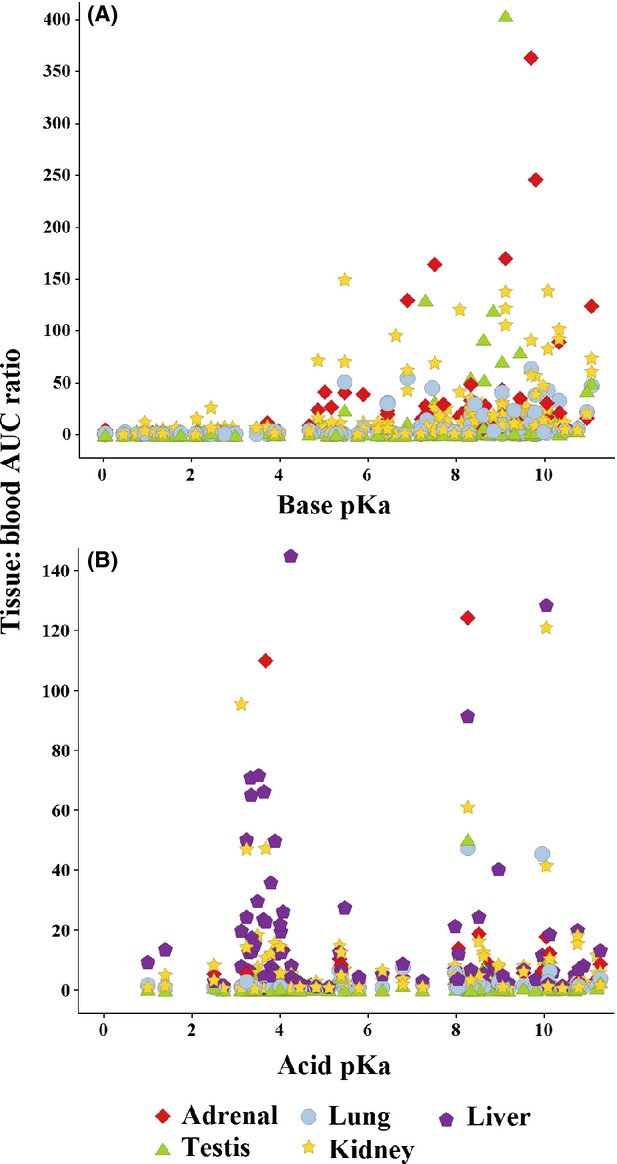
Influence of base (Panel A) and acid (Panel B) pKa on the distribution of drugs using adrenal lung, kidney, testis, and liver (Panel B only) as representative tissues. The most highly distributed bases tended to have a basic pKa greater than physiological tissue pH, that is, where the ionized form predominates in tissues. Acidic drugs with an acid pKa lower than physiological tissue pH, however, did not show the same relationship. The most highly distributed acids had an acid pKa between approximately 3 and 4 and were well distributed into tissues where anionic tissue transporters are highly expressed (liver, kidney, adrenals).
Plasma protein and tissue binding
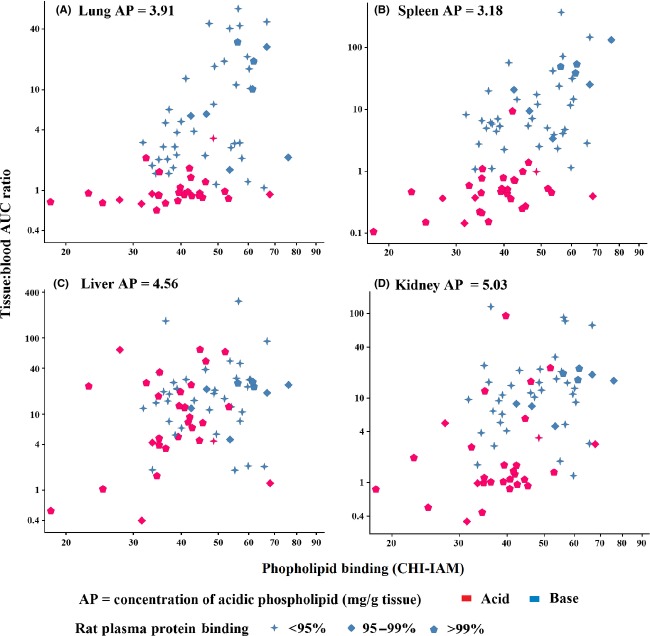
The influence of tissue and plasma binding on the distribution of acids and bases is further explored in Fig.5. Lung, spleen, liver, and kidney were selected as specific tissues of interest since they contain the highest concentrations of acidic phospholipid (Rodgers et al. 2005). Acidic and basic molecules were compared using rat plasma protein binding and phospholipid (CHI-IAM) binding as markers for plasma and tissue binding, respectively. In lung and spleen, the most highly distributed drugs tended to be basic with a high proportion demonstrating low plasma protein binding and high phospholipid binding (CHI-IAM > 50). Acidic drugs generally demonstrated higher plasma protein binding and were less well distributed. Those acidic drugs with high phospholipid binding (CHI-IAM > 50) as well as high plasma protein binding were still relatively poorly distributed compared to basic drugs implying high plasma protein binding limits distribution even when tissue binding is expected to be higher. Most other tissues (including heart and thymus which also contain high acid phospholipid content) demonstrated a similar relationship as lung and spleen. Notable exceptions were the liver and kidney (Panels C and D in Fig.5) where a proportion of acidic drugs were highly distributed probably through the action of anionic transporters which are known to be expressed in these tissues.
Figure 5.
Effect of rat plasma protein and phospholipid (CHI-IAM) binding on tissue distribution of acids and bases. Lung, spleen, liver, and kidney cortex (Panels A, B, C, and D, respectively) were selected since these tissues contained the highest phospholipid concentration according to Rodgers et al. (2005). In general, the most highly distributed bases in lung and spleen were molecules with strongest phospholipid binding. The same relationship did not apply to acidic drugs. A proportion of acidic drugs were better distributed into tissues like liver and kidney, known to express anionic transporters.
Lipophilicity and nonspecific binding
In Fig.6, we have used the same phospholipid (CHI-IAM) binding plots as in Fig.5 to discriminate tissue-specific distribution from nonspecific binding. Nonspecific binding is guided by rat plasma protein binding and phospholipid binding. Distribution of all molecules in the data set (including neutrals and zwitterions) was compared between muscular tissue (heart and skeletal muscle) with the lung shown as a representative of other tissue types. Three molecules, all containing a positively charged quaternary ammonium group, were unusually well distributed into muscular tissue. By excluding molecules with high lipophilicity (cLogP > 3) the number of molecules with high plasma protein binding (mainly acids) and high phospholipid binding (CHI-IAM > 50 – mainly bases) is reduced showing how nonspecific binding can be reduced through lowering lipophilicity. Distribution of the remaining molecules is less influenced, therefore, by nonspecific binding. The quaternary ammonium molecules were not lipophilic (cLogP < 3) and displayed only modest plasma protein and phospholipid (CHI-IAM) binding. Distribution of these molecules into muscular tissue, therefore, is unlikely due to nonspecific binding and more likely due to a tissue-specific characteristic like a transporter or specific tissue-binding component.
Discussion
Studying distribution of radioactivity as a surrogate for unchanged drug has been justified in at least two previous publications. Richter et al. (2006), while comparing the radioactive plasma partition coefficient between muscle and other tissues, concluded a comparable relationship between single parent molecules and radioactive “mixtures” of parent molecules and their metabolites. Xia et al. (2012) compared distribution of radioactivity from QWBA experiments to distribution of unchanged drug determined using specific assay. They also concluded that distribution of radioactivity was similar to unchanged drug and justified fitting a PBPK (physiologically based pharmacokinetic) model to tissue radioactivity concentrations from a QWBA study. The data presented here support the assertions of Richter and Xia providing further confidence that measuring radioactivity concentrations in tissues (especially nonhepatic tissues) is a suitable way to study drug distribution of parent drug.
The influence of acidity and basicity on total drug distribution is well established (Rodgers et al. 2005; Rodgers and Rowland 2006) and is summarized in Fig.7. Acidic molecules containing an acid group with pKa < 6.8 (plasma pH) will carry a net negative charge in both plasma and tissues. Acidic drugs tend to bind strongly to plasma proteins (particularly to serum albumin) and are, therefore, relatively poorly distributed. In contrast, molecules containing a basic group with pKa > 7.3 (pH of interstitial fluid) will carry a net positive charge in plasma and tissues. Basic drugs tend to bind poorly to plasma proteins – binding preferentially to alpha acid glycoprotein which is less prevalent in plasma than serum albumin. The distribution of basic drugs is also influenced by two additional processes not present with acidic or neutral drugs and driven by a net positive charge, namely sequestration in acidic subcellular compartments, such as lysosomes and the mitochondrial intermembrane space, and electrostatic interactions with phospholipids. Murakami and Yumoto (2011) and Yata et al. (1990) demonstrate that tissue distribution of basic molecules depend on tissue phospholipid concentration and the corresponding drug-binding affinities – basic molecules having high affinity for phospholipid membranes due to interactions with phospholipid acidic head groups. These attributes result in basic drugs being more highly distributed than acidic drugs and with a larger interorgan variation. The data trends we have observed here from in vivo studies (Figs.6) are consistent with these known characteristics of acids and bases and reaffirm that ionization state is an important feature governing distribution of total drug.
Figure 7.
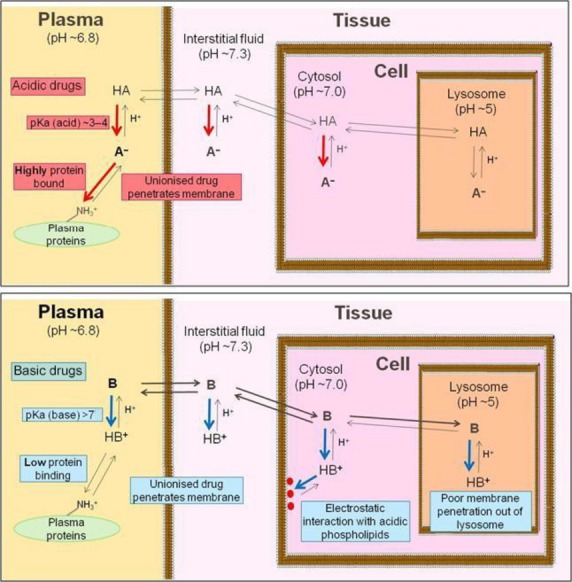
Diagrammatic representation of factors governing distribution of acidic drugs (upper panel) and basic drugs (lower panel). Strongly acidic moieties (acidic pKa < 7) and strongly basic moieites (basic pKa > 7) are ionized at physiological pHs. Whereas acidic moieties bind to serum albumin in plasma, basic moieties bind to phoshoplipids in cells or can be sequestered in acidic organelles.
We have shown that a high proportion of well-distributed drugs are likely associated with strong phospholipid binding (CHI-IAM; Figs.5, 6). We have also shown that distribution of bases into the melanin containing tissues of the uveal tract in the eye was consistently higher than any other tissue studied (Fig.3). Furthermore, basic molecules were consistently better distributed into melanin containing tissues of the eye, compared to those parts of the eye without melanin, and into pigmented skin (containing melanin) compared to unpigmented skin (without melanin). The data, therefore, illustrate the strong influence of binding on the distribution of total drug. A drawback of studying distribution of radioactivity is, however, that it only informs on total drug and does not inform on the free drug concentration in the tissue in question. The free drug hypothesis states that drug efficacy is dictated by the unbound drug concentration at target and that unbound drug concentration in body water will be equivalent at steady state throughout the body except where distribution is influenced by active transporters and/or permeability barriers (Trainor 2007; Smith et al. 2010; Liu et al. 2014). Drugs which are well distributed into a target tissue because of high binding are not, therefore, available to exert a pharmacological effect. Furthermore, it is also established that in vitro fractional drug binding (plasma and/or tissue) does not influence the unbound drug concentration in vivo in body water (Smith et al. 2010; Liu et al. 2014) with unbound drug concentration being influenced by parameters such as absorbed dose and intrinsic clearance, not the drug binding properties. Decreasing fractional drug binding (tissues and/or plasma) will not increase free drug concentration because the total drug concentration (bound plus unbound) is lowered as a result of increased drug clearance. Current scientific thinking, therefore, strongly questions the biological relevance of bound drug in a tissue.
Although drug binding will not influence free drug concentration, it is well established that active transport influences tissue concentrations of both total and unbound drug and several observations we have made support the influence of transporters in drug distribution. In Fig.4, we have linked the distribution of a cluster of acidic drugs with an acid pKa between 3 and 4 to those tissues known to express anion transporters. Acid pKa may, therefore, be a molecular property which can be used to avoid or promote the action of these transporters. Comparisons between tissue distribution and predicted Kp partition coefficient also infer that transporters play a significant role in drug distribution (Fig.2).
It is common during discovery research to use PBPK models to track bound and unbound, plasma and tissue concentrations. These multicompartment models rely on tissue-specific Kp predictions which are based solely on molecular properties and the variant physiology and composition of the different tissues. PBPK models are often fitted to measured plasma rather than tissue concentration profiles and it is common, therefore, for these models to disregard the influence of transporters on estimates of volume of distribution. Our work has demonstrated, therefore, how transporters can influence tissue concentrations in tissues where transporters are highly expressed. Using PB/PK models to predict drug concentrations in such tissues may be best fitted using tissue rather than plasma concentrations to account for the action of these transporters. The advent of Matrix Assisted Laser Desorption Ionization (Castellino et al. 2011) presents an alternative approach to generate distribution data from unchanged drug but with the added benefit of being able to look for metabolites. If this technology can be adapted to capture whole body information it opens up new options to study drug distribution on repeat dose toxicology studies.
Delivering drug to its target is an important consideration during discovery research and in vivo characteristics such as absorbed dose and intrinsic clearance are important to maximize unbound drug concentrations in body water (Smith et al. 2010). It has been suggested that such properties can be optimized through greater focus on lowering lipophilicity and molecular weight (Gleeson 2008; Young et al. 2011). We have shown here how lipophilicity and nonspecific binding are closely related and that lowering lipophilicity also results in tissue distribution being less influenced by nonspecific binding (Fig.6). Whether reduced promiscuity and/or decreased tissue burden to total (bound) drug translate to a lower toxicology risk requires further research.
That molecules containing quaternary ammonium groups are unusually well distributed specifically to muscular tissues (Fig.6) is interesting since charged molecules of this type lack the lipophilicity needed to permeate cells. These molecules, therefore, must either bind directly to membrane sites on muscular tissue from the extracellular aqueous environment or permeate via transporters or aqueous pores (muscle cell membrane being more porous than the membranes in other tissues). In this case, the target receptor was located in the cell membrane of muscle, accessible from extracellular water. The relative success of these drugs may, therefore, be explained by their poor lipophilicity and good solubility.
In summary, we have shown that distribution of radioactivity can be used, with caution, to study the distribution of unchanged drug. We have demonstrated how QWBA data on a large number of molecules can be integrated to explore the relationship between drug distribution and physicochemical properties. Our results, consistent with current knowledge, show that distribution of total drug is influenced by physicochemical properties like ionization state and lipophilicity which, in turn, affect tissue and plasma binding. Tissue concentrations of a high proportion of well distributed basic drugs are, at least in part, a likely consequence of high nonspecific phospholipid binding. For these drugs, since unbound drug is important for efficacy, delivering bound drug to a target tissue should not be regarded as a good drug attribute. The findings of this work highlight the strong influence that binding has on the distribution pattern of a large proportion of molecules to most tissues. Reducing lipophilicity, a strategy often used in discovery to optimize pharmacokinetic properties such as absorption and clearance, decreases the influence of nonspecific binding on drug distribution. Several observations support a role for drug transporters in some tissues: uptake transporters, for example, in the liver, adrenals, and kidney; efflux transporters in the brain.
Author Contributions
Negash, Harrell, Valko, Sychterz, Ho participated in research design; Negash, Sychterz, Weber conducted the experiments; Harrell and Negash performed data analysis; Harrell, Negash, Valko, Sychterz, Ho wrote or contributed to the writing of the manuscript.
Disclosure
None declared.
Glossary
- AUC(0-inf)
AUC has been calculated by extrapolating the last measured sample time to infinity
- AUC(0-last)
AUC has been calculated to the last measureable sample time
- AUC
area under curve
- CHI-IAM
chromatographic hydrophobicity index – immobilized artificial membrane
- GSK
GlaxoSmithKline
- HPLC
high-performance liquid chromatography
- Kp
tissue: plasma partition coefficient
- LSC
liquid scintillation counting
- PBPK
physiologically based pharmacokinetic (model)
- QWBA
quantitative whole body autoradiography
- T:B
tissue: blood AUC ratio of radioactivity
- T:P
tissue: plasma ratio
- t0
start time on concentration/time curve
Supporting Information
Additional Supporting Information may be found in the online version of this article:
Table S1. Summarizing rat tissue distribution data from excretion and metabolism studies conducted at GSK using radioactive drug analogs for 46 molecules.
Table S2. Comparing tissue distribution from QWBA studies (in terms of tissue: blood AUC ratios) to drug property data for >200 structurally unrelated molecules.
References
- Castellino S, Groseclose MR, Wagner D. MALDI imaging mass spectrometry: bridging biology and chemistry in drug development. Bioanalysis. 2011;3:2427–2441. doi: 10.4155/bio.11.232. [DOI] [PubMed] [Google Scholar]
- Gleeson MP. Generation of a set of simple, interpretable ADMET rules of thumb. J Med Chem. 2008;51:817–834. doi: 10.1021/jm701122q. [DOI] [PubMed] [Google Scholar]
- Liu X, Wright M, Hop CECA. Rational use of plasma and tissue binding data in drug design. J Med Chem. 2014;57:8238–8248. doi: 10.1021/jm5007935. [DOI] [PubMed] [Google Scholar]
- Murakami T, Yumoto R. Role of phosphatidylserine binding in tissue distribution of amine-containing basic compounds. Expert Opin Drug Metab Toxicol. 2011;7:353–364. doi: 10.1517/17425255.2011.548805. [DOI] [PubMed] [Google Scholar]
- Richter WF, Volkmar S, Whitby B. The distribution pattern of radioactivity across different tissues in quantitative whole-body autoradiography studies. Eur J Pharm Sci. 2006;28:155–165. doi: 10.1016/j.ejps.2006.01.007. [DOI] [PubMed] [Google Scholar]
- Rodgers T, Rowland M. Physiologically based pharmacokinetic modelling 2: predicting the tissue distribution of acids, very weak bases, neutrals and zwitterions. J Pharm Sci. 2006;95:1238–1257. doi: 10.1002/jps.20502. [DOI] [PubMed] [Google Scholar]
- Rodgers T, Leahy D, Rowland M. Physiologically based pharmacokinetic modelling 1: predicting the tissue distribution of moderate to strong bases. J Pharm Sci. 2005;94:1259–1276. doi: 10.1002/jps.20322. [DOI] [PubMed] [Google Scholar]
- Smith DA, Di L, Kerns E. The effect of plasma protein binding on in vivo efficacy: misconceptions in drug discovery. Nat Rev Drug Discov. 2010;9:929–939. doi: 10.1038/nrd3287. [DOI] [PubMed] [Google Scholar]
- Solon E. Use of radioactive compounds and autoradiography to determine drug tissue distribution. Chem Res Toxicol. 2012;25:543–555. doi: 10.1021/tx200509f. [DOI] [PubMed] [Google Scholar]
- Trainor G. The importance of plasma protein binding in drug discovery. Expert Opin Drug Discov. 2007;2:51–64. doi: 10.1517/17460441.2.1.51. [DOI] [PubMed] [Google Scholar]
- Valko K. Models for distribution (Chapter 10) In: Valko K, editor. Physicochemical and biomimetic properties in drug discovery. Hoboken, NJ: J Wiley & Sons Publishers; 2014. pp. 242–302. , ed.. [Google Scholar]
- Valko K, Du CM, Bevan CD, Reynolds DP, Abraham MH. Rapid-gradient HPLC method for measuring drug interactions with immobilized artificial membrane: comparison with other lipophilicity measures. J Pharm Sci. 2000;89:1085–1096. doi: 10.1002/1520-6017(200008)89:8<1085::aid-jps13>3.0.co;2-n. [DOI] [PubMed] [Google Scholar]
- Wang L, Hong H, Zhang D. Application of quantitative whole body autoradiography (QWBA) in drug discovery and development in ADME. In: Zhang D, Surapanemi S, editors. Enabling technologies in drug design and development. Hoboken, NJ: J Wiley & Sons Publishers; 2012. pp. 419–434. , eds.. [Google Scholar]
- Xia B, Heimbach T, Lin TH, He H, Wang Y, Tan E. Novel physiologically based pharmacokinetic modelling of patupilone for human pharmacokinetic predictions. Cancer Chemother Pharmacol. 2012;69:1567–1582. doi: 10.1007/s00280-012-1863-5. [DOI] [PubMed] [Google Scholar]
- Yata N, Toyoda T, Murakami T, Nishiura A, Higashi Y. Phosphatidylserine as a determinant for the tissue distribution of weakly basic drugs in rats. Pharm Res. 1990;7:1019–1025. doi: 10.1023/a:1015935031933. [DOI] [PubMed] [Google Scholar]
- Young RJ, Green DV, Luscombe CN, Hill AP. Getting physical in drug discovery II: the impact of chromatographic hydrophobicity measurements and aromaticity. Drug Discovery Today. 2011;16:822–830. doi: 10.1016/j.drudis.2011.06.001. [DOI] [PubMed] [Google Scholar]
Associated Data
This section collects any data citations, data availability statements, or supplementary materials included in this article.
Supplementary Materials
Table S1. Summarizing rat tissue distribution data from excretion and metabolism studies conducted at GSK using radioactive drug analogs for 46 molecules.
Table S2. Comparing tissue distribution from QWBA studies (in terms of tissue: blood AUC ratios) to drug property data for >200 structurally unrelated molecules.


