

Abstract
An earlier version of this article was originally submitted for publication in early 2000 to introduce a new dimensional of concept of Attention Deficit Hyperactivity Disorder (ADHD) provided by the Strengths and Weaknesses of ADHD-symptoms and Normal-behavior (SWAN) rating scale. The SWAN was developed to correct some obvious deficiencies of the Swanson, Nolan and Pelham (SNAP) rating scale that was based on the categorical concept of ADHD. The first submission was not accepted for publication, so a draft of the article was posted on a website (www.ADHD.net). The SWAN scale was published as a table in a review article (Swanson et al, 2001) to make it available to those interested in this dimensional approach to assessment of ADHD. Despite its relative inaccessibility, the SWAN has been used in several genetic studies of ADHD (e.g., Hay, Bennett, Levy, Sergeant, & Swanson, 2005; Cornish et al, 2005) and has been translated into several languages for European studies of ADHD (e.g., Lubke et al, 2006; Polderman et al, 2010) and into Spanish for studies in the United States (e.g., Lakes, Swanson, & Riggs, 2011; Kudo et al., this issue). Recently, invitations to include the SWAN in the PhenX Toolkit (www.phenx.org) for genomic studies (Hamilton et al, 2011) and to describe thedimensional approach of the SWAN for discussion of diagnostic (Swanson, Wigal, & Lakes, 2009) and ethical (Swanson, Wigal, Lakes, &Volkow, 2011) issues has convinced us that the unpublished article is still relevant after more than a decade, so it is presented here with some minor updates. We use examples (a) to document some consequences (e.g., over-identification of extreme cases) of using statistical cutoffs based on the assumption for a distribution of SNAP ratings that is highly skewed and (b) to show how the SWAN corrects the skewness of the SNAP by rewording the items on the scale and using a wider range of rating alternatives, which corrects the tendency to over-identify extreme cases.
Keywords: ADHD rating scale, dimensional scale, SNAP, SWAN
Introduction
In 1980, the historic revision of the Diagnostic and Statistical Manual (DSM) of the American Psychiatric Association (i. e., DSM-III, 1980) re-conceptualized the prior diagnosis of hyperkinetic reaction of childhood (DSM-II, 1978) and defined the diagnostic categories of Attention Deficit Disorder with Hyperactivity (ADDH) or without (ADD). The DSM-III criteria were based on 16 symptoms listed in 3 domains -- 5 inattention (IN), 6 impulsivity (IMP), and 5 hyperactivity (HY) symptoms. These symptoms and domains were gleaned from clinical wisdom (see Cantwell, 1980).
Soon after the release of DSM-III, the Swanson, Nolan and Pelham (SNAP) rating scale was developed (see Swanson et al., 1981). Each DSM item was used verbatim from the symptom list (including the word “often”), which required a judgment about psychopathology based on degree of presence that is maladaptive and inconsistent with developmental level. Borrowing from the literature on teacher rating scales (e.g., Eisenberg et al., 1962; Conners et al., 1969), the SNAP-III rating scale used a 4-point scale (Not at All = 0, Just a Little = 1, Pretty Much = 2, and Very Much = 3). The first alternative in the 4-point rating scale indicates the absence of psychopathology, and the other alternatives reflect the degree of symptom presence. Instead of a symptom count as specified by the DSM-criteria, a summary score was used to define placement on the symptom-severity dimension.
The SNAP-III was developed to evaluate response to treatment with stimulant medication. The initial publication accomplished this purpose, and the venue was a medical journal (Pediatrics: Swanson et al., 1983), which provided a list of the items of the scale (as a table in the article) but did not provide norms or psychometric properties. Interested users had to rely on a presentation at the American Psychological Association (Swanson, 1981) that was deposited in the Education Resources Information Center (ERIC: www.eric.ed.gov). Based on regular classrooms in elementary schools in Canada (Toronto) and the United States (Florida), norms were developed to provide the age and sex means (average rating per item) and standard deviations (sd). The mean and sd were presented for each of the 3 symptom domains (IN, IMP and HY) and the two diagnostic categories (ADD and ADDH). Typical test-retest reliabilities were obtained for the average ratings of the three domains (r’s = 0.66, 0.78, and 0.92), and high correlations were obtained across the age and sex subgroups (r’s = 0.86 to 0.91) for the summary rating of ADDH with the summary rating of the Conners Teacher scale (the 10-item Index score). Subsequent use of the SNAP provided additional detail regarding assessment with this instrument, including a series of studies with direct classroom observations (Atkins et al., 1985; 1988; 1989) that contributed to the validity of the SNAP-III as a diagnostic instrument.
In parallel with the revisions of the DSM criteria in 1987 (DSM-III-R) and 1991 (DSM-IV-Work in Progress), the SNAP-III-R and SNAP-IV rating scales were formulated using slightly different sets of items to define domains (see Swanson, 1992). The SNAP-IV consisted of the 18 items for DSM-IV-Work-in-Progress category of Attention Deficit Hyperactivity Disorder (ADHD), separated into sets of 9 symptoms for the domains of Inattention (INN, to distinguish the DSM-IV set of symptoms from the DSM-III set labeled IN) and Hyperactivity/Impulsivity (HY/IMP). In addition, the 14 items not included in DSM-IV but previously included in the symptom lists for ADD and ADDH in DSM-III and for ADHD in DSM-III-R were retained. Also, 12 items for ODD from the DSM III, III-R, and IV criteria were included. The 43 items could be combined to represent the diagnostic categories of ADD, ADDH, ADHD, and ODD that were specified in DSM-III, DSM-III-R, and DSM-IV. The SNAP-IV rating scale was adopted for use in the Multimodal Treatment study of ADHD (MTA) that was launched just as the DSM-IV criteria were being finalized. The ADHD domain scores emerged as the main outcome measures of the MTA (see MTA Group, 1999 and 2004; Jensen et al., 2007).
Several similar questionnaires based on the DSM ADHD symptoms have been developed. Pelham et al. (1992) used the DSM-III-R (1987) symptoms list and the same 4-point rating scheme to construct the Disruptive Behavior Disorder (DBD) rating scale. Gaub and Carlson (1997) used the SNAP-IV to evaluate subtypes of ADHD on the school-aged population. The DSM-IV (1994) symptom list was used to construct the Vanderbilt (Wolraich et al., 1998) and ADHD (DuPaul et al., 1998) rating scales. These two variants dropped the word “often” from each item, and used a 4-point rating scheme to capture the frequency of occurrence of the item (0 = Never, Rarely, 1 = Sometimes, 2 = Often, or 3 = Very Often). Conners (1997) embedded the DSM-IV items into the longer Conners Teacher and Parent rating scales. In the revision, Conners (2008) used degree of presence as well as frequency as alternatives for ratings (0 = Not at All or Rarely, 1 = Just a Little or Sometimes, 2 = Pretty Much or Often, and 3 = Very Much or Very Often). In some versions of the SNAP-IV, the rating alternative “Pretty Much” was changed to “Quite a Bit” to improve grammar and avoid the repetition of the word “much”.
Norms for these scales have been developed, based on mean (or total) and sd for the ratings of the items in the ADHD domains. It is remarkable that despite the various ways of asking for ratings on the 4-point (0 to 3) ADHD rating scales, the average rating of ADHD symptoms has been about the same for the school-aged population of children. There are some age and sex effects, which were expected and have been reported for the ratings for DSM-IV ADHD symptoms (e.g., see Swanson, 1992; DuPaul et al., 1998; Conners et al., 2008), but the usual finding is that for the general (non-clinical) population the average rating is between “Not at All” and “Just a Little”, yielding an average for the domain score of less than 1.0. If the population distribution of summary scores were truly normal, then the cutoff criterion based on the mean and sd could be used to estimate the percentage of individuals in the population considered to be extreme based on a z-score (mean = 0 and sd = 1) or T-score (mean = 50 and sd = 10). The standard assumptions should hold: a cutoff equal to the mean + 1 sd (z = 1 or T = 60) should identify about here 17% of the population and a cutoff equal to the mean + 2 sd (z = 2 or T = 70) should identify about 2% of the population as extreme. Of course, if the assumption of normality were not met, then the expected percentage of cases in the population identified as extreme by these statistical cutoffs would be unexpectedly low or high.
Logically, the distribution of summary scores for the general population would not be normal for ratings of the presence of psychopathology that by definition is rare in the population. Ullman, Sleator, and Sprague (1985) pointed this out for the Conners (1969) rating scale and the Hyperactivity Index. They described the observed population distribution of the summary score (the total rating across the 10-items) as highly skewed to the right or “J-shaped” rather than normal, and they noted that the standard cutoff (a total score over 15) contributed to over-identification of extreme cases. Apparently, the ADHD rating scales with similar items and response alternatives (0–3 ratings of psychopathology) have similar unfortunate properties.
For example, for DSM-III criteria, Swanson et al. (1992) presented theoretical cutoffs based on mean and sd values for the DSM-III domains of IN, IMP, and HY for age and sex, but also discussed some consequences of the use of these cutoffs, including higher percentages exceeding the cutoff due to non-normal distributions in the population. The cutoffs utilized were 2.5 for boys under the age of 8 years and over 2.0 for older boys or girls of all ages. For DSM-III-R criteria, Pelham et al. (1992) recommended that ratings of 3 (Very Much) be considered as a criterion for symptom presence, and for the DSM-III-R criteria for ADHD (presence of 8 or more of the 14 symptoms) this identified about 6% of elementary school-aged boys, and a lower percentage of girls, for a total of about 4% of the elementary school population. For DSM-IV criteria, DuPaul (1998) recommended that a score of 2 or 3 be accepted as indicating symptom presence, which for the teacher ratings resulted in a prevalence estimate of ADHD in school-age children of over 20%. Means and sd’s of total scores on the ADHD Rating Scale were provided for age and sex subgroups, but they were not used and instead empirical percentile cutoffs were provided to identify a given percentage (2%) of extreme cases. It is noteworthy that the empirical cutoffs were higher than the theoretical cutoffs calculated from the mean and sd value. For example, for 5–7 year old boys, with the mean = 5.94 and sd = 5.08, the theoretical 2% cutoff (mean + 2 sd) would be 16.1, but the empirical 98th percentile cutoff was 20.0.
In 2000, we were perplexed by the variety and weaknesses of the norms of the ADHD rating scales. When we conducted this research and prepared the first draft of this article, our purposes were (1) to demonstrate some obvious consequences of applying statistical cutoffs based on population norms when the assumptions of the normal distribution are not met and (2) to develop a new scale of measurement that yields a closer approximation to the normal distribution and avoids a possible fatal flaw in the use of norms for ADHD rating scales.
Study 1: Method
We obtained ratings using the SNAP-IV rating scale (see Table 1) for students in two elementary schools (kindergarten to grade 6) in a public school district in Orange County, California. Based on an approved protocol for an anonymous survey of classrooms, we obtained ratings of 847 students in 31 classrooms. Each of the teachers rated every student in the classroom.
Table 1.
The SNAP-IV Rating Scale

|
Results
A factor analysis was performed with SPSS, using the principal component method and varimax rotation. As expected, a 2-factor solution was obtained, Inattention representing the ADHD-INN domain and Hyperactivity/ Impulsivity representing the ADHD-HY/IMP domain. These two factors explained 77.78% of the variance, with the rotated factors each accounting for about the same percentage of variance in this sample (see Table 2). The Inattention factor accounted for 41.52% of the variance and the Hyperactivity/Impulsivity factor accounted for 36.26% of the variance.
Table 2.
SNAP-IV Factor Loading
| SNAP-IV Question # | Factor 1 | Factor 2 |
|---|---|---|
| 1 Difficulty attending to detail | .840 | .226 |
| 2 Difficulty sustaining attention | .862 | .347 |
| 3 Does not listen | .805 | .340 |
| 4 Does not follow through on instructions | .891 | .225 |
| 5 Difficulty organizing tasks | .910 | .203 |
| 6 Avoids sustained mental effort | .874 | .234 |
| 7 Loses things | .820 | .304 |
| 8 Distracted | .789 | .441 |
| 9 Forgetful | .884 | .248 |
| 10 Fidgets or squirms | .520 | .658 |
| 11 Leaves seat | .425 | .737 |
| 12 Runs about or climbs | .265 | .731 |
| 13 Difficulty playing quietly | .398 | .736 |
| 14 On the go or driven by a motor | .228 | .843 |
| 15 Talks excessively | .263 | .797 |
| 16 Blurts out answers to questions | .179 | .866 |
| 17 Difficulty awaiting turn | .202 | .899 |
| 18 Interrupts or intrudes | .205 | .887 |
| % of Variance Accounted for by Factor | 41.52 | 36.26 |
The mean rating across all of the 847 children based on the 18 ADHD items (i. e., the ADHD-Combined summary score) was .54, with sd= .67 and skewness = 1.474. The mean, sd and skewness for the ADHD-INN subscale were .73, .86, and 1.12, respectively; for ADHD-HY/IMP, they were .34, .61, and 2.36 respectively. The population distribution of ADHD-Combined (ADHD-C) summary scores is presented in Figure 1.
Figure 1.

Population Distribution of the ADHD-C Rating
As expected from a general (non-clinical) population, most scores were equal to or below 1.0, which represents a normal level of behavior (i.e., “Just a Little” or less) that would not meet the DSM-IV criteria for symptom presence. This extreme rightward skewness also held at the item level: 75% to 96% of the sample had scores of 1 or less (“Just a Little” or “Not at All”) on the ADHD items of the SNAP-IV. In this sample 79.9% of all students had scores equal to or below 1.0. Different procedures can be used to develop statistical norms based on absolute or relative evaluation of ADHD symptoms with respect to age and sex. In the example above, the average rating was calculated across all students, but averages based on age and gender subgroups have also been used (see Swanson, 1992; DuPaul, 1998; Conners, 2008). By the former absolute method, a higher percentage of young and male cases are expected to be identified as extreme (as in clinical practice), while by the latter relative method, an equal percentage of cases in the age and gender subgroups are expected to be identified as extreme.
As an exercise to demonstrate some consequences of using statistical cutoffs from a non-normal (skewed) distribution, we applied theoretical cutoffs based on the assumption that the distribution was normal. Using a standard theoretical cutoff equal to the mean + 1.65 sd, about 5% of the sample (about 42 cases) would be expected to be identified as extreme. However, as expected for a skewed distribution, this theoretical cutoff identified a significantly higher number of cases than expected. Based on the ADHD-C score, 71 individuals had scores above the theoretical 5% cutoff (8.4%). A comparison of the expected and observed proportions was statistically significant (Z = −4.53, p< .01).
As an additional exercise, we also used the theoretical cutoffs to estimate prevalence of ADHD based on exceeding the cutoff on domains of the SNAP-IV as an operational definition of symptom presence. In this sample, of n = 847, the difference between the observed percentage (9.2%) identified by the theoretical cutoff on the ADHD-INN subscale (78 cases rather than 42) was also statistically significant compared to the expected value of 5% (Z = −5.86, p < .01), as was the percentage (7.6%, or 64 cases) identified by the theoretical cutoff on the ADHD-HY/IMP subscale (Z = −3.47, p< .01).
A Venn diagram (see Figure 2) shows the overlap of extreme cases identified by the multiple cutoff values for the three subtypes: ADHD-C, ADHD-I, and ADHD-HI. This diagram makes it clear that few cases met the criteria for ADHD-C, ADHD-INN, and ADHD-HY/IMP simultaneously (n = 31, or 3.7%), or the criteria for ADHD-I only (n=28, 3.3%) or ADHD-HI only (n=13, 2.4%). Some cases met the criteria for ADHD-C but not ADHD-I (n = 20, 2.4%) or not ADHD-HI (n = 19, 2.2%). One case (0.1%) met the cutoff criteria for ADHD-C but not for ADHD-I or ADHD-HI. A total of 112 cases (n=28+19+31+20+13+1=112) or 13.2% met the cutoff criteria for these subtypes of ADHD.
Figure 2.

Venn Diagram of Overlap of Subsets Identified by Statistical Cutoffs
Discussion
In the DSM-III, III-R, and IV manuals, the prevalence of ADHD was assumed to be about 3–5% of the school-aged population. In 1990, one of the main concerns that led to changes in Federal legislation governing educational disabilities was that ADHD was under-recognized (see the Notice of Inquiry, 1990), and this concern led to recognition of ADHD as a disabling condition (see the Individuals with Disabilities Education Act, 1990). However, in the early 1990s, there was a dramatic increase in recognition of ADHD and the use of stimulant medications to treat it (see Swanson et al, 1995). At that time, we were concerned that the norms based on a highly skewed distribution of symptom-severity ratings may contribute to over-recognition of ADHD. Our example showed how an operational definition of symptom presence could result in a high prevalence (13.2%), which seemed to confirm this possibility. In the initial draft of this article (Swanson et al., 2000), we suggested that due to the non-normality in the population, the use of norms based on statistical properties of summary scores on the SNAP-IV rating scale could produce over-identification of extreme cases.
In our example, we demonstrated how a theoretical statistical cutoff (mean + 1.65 sd) would identify almost 1.7 times the expected percentage of extreme cases (i. e., 8.4% rather than 5%). The obvious reason usually given is that the distribution of summary scores does not meet the assumptions of normality and has a positive (rightward) skewness. McCleary (personal communication) evaluated the characteristic of the observed distribution of SNAP summary scores from this sample. Rather than a normal distribution, the Poisson distribution was considered, which described the expected distribution for a summary score based on independent items that take on two values to designate absence or presence of symptoms of a psychiatric disorder: a value of 0 (“Not at All” or “Just a Little”) for absence or value of 1 (“Pretty Much” or “Very Much”) for presence. However, a defining characteristic of the Poisson distribution (i.e., mean = variance) was not met: the variance was less than the mean. The observed distribution was described by the “contagious Poisson” distribution (or negative binomial), which is the expected pattern for a summary score when the items are not independent. In fact, when factor analysis identifies items with high intercorrelations (as for the domains for ADHD), then the assumption based on independence of items should not hold. When factors represent the ADHD domains, then a score on one item (e.g., a 0 for a subject without symptoms) of the domain predicts the same score on all other items in the domain. Variation within the domain is considered to be random noise or “Gaussian” variation. This non-independence results in a reduction of the variance of the distribution of summary scores that is even beyond the expected reduced variance of the Poisson distribution relative to the normal distribution.
In the initial draft of this article, we considered what might be done to correct the observed tendency of statistical over-identification of extreme cases based on symptom severity ratings of the ADHD domains on the SNAP-IV rating scale. Since the over-identification is related to reduced variance as well as shape of the distribution of the summary score in the population, we considered ways that the full range of variability might be truncated in the SNAP-IV domains of ADHD-C, ADHD-INN, and ADHD-HY/IMP. In Study II, we maintained the DSM-IV content for the ADHD items, but we re-worded them and changed the range of possible ratings to capture the variability of behavior that underlies the ADHD domain scores that we expected to be present in the population but unmeasured by the SNAP-IV rating scale.
Study 2
The wording of the items in the DSM-IV manual (and on the SNAP-IV) describes extreme behavior that would qualify as a symptom of a disorder if it is present more than usual (i.e., more than “Just a Little”) or more frequently than usual (i.e., “Often”). By this definition, extreme behavior would not be present in most individuals in the population, and for most individuals, a score of zero to one should be assigned by a veridical rater on each item. Study I shows that this does happen when a school-wide sample is evaluated using an ADHD rating scale. This was also confirmed in the MTA, which used the SNAP-IV to evaluate a sample of non-clinical school-aged children – classmates of students with ADHD who were called the Local Normative Comparison Group (LNCG). The population distribution of the summary score on the SNAP was skewed to the right, and about 80% of the LNCG had ADHD-C domain scores of 1.0 or less (see Swanson et al., 2001).
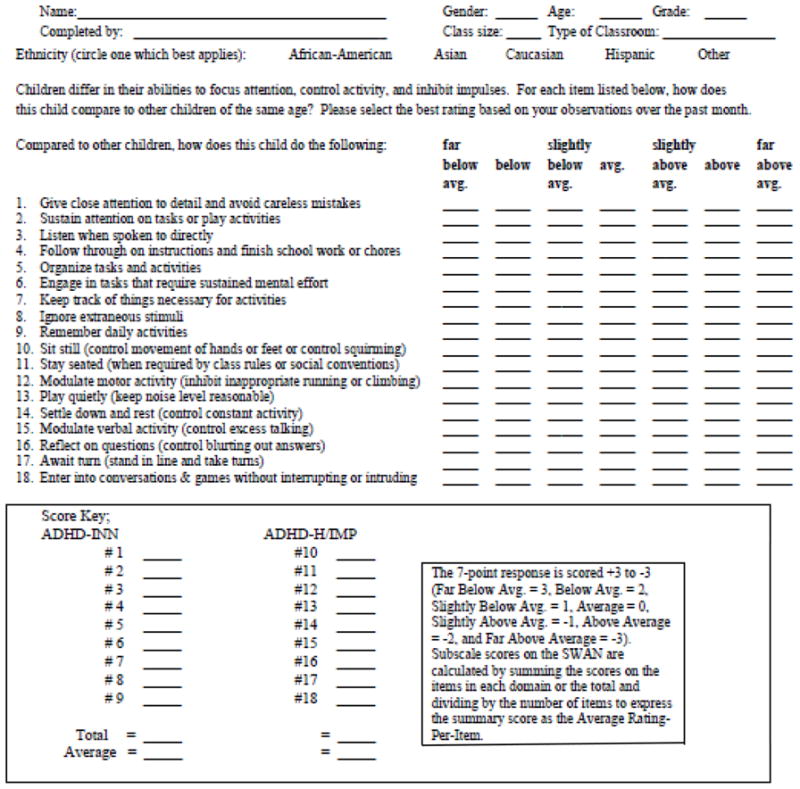
The categorical definition of items in terms of psychopathology may fail to capture variation in the population related to strengths as well as weaknesses of individuals. Due to the wording and scoring of the items, an individual who has strengths (and thus has extreme placement on the dimension but in the opposite direction than an individual with a weakness) would receive the same ratings and scores as an average individual with respect to symptom presence (e.g., Not at All= 0). To capture the population variation presumed to exist in nature (but truncated by the wording and scoring of items of the SNAP-IV), we re-worded the DSM-IV items of ADHD as shown in Table 3. For example, consider the first symptom listed in the DSM-IV criteria for ADHD – “Often fails to give close attention to detail or make careless mistakes.” Instead of using the DSM-IV formulation of this item as a categorical question (“Does this child often fail to give close attention to detail and make careless mistakes?”) we re-worded the item as a dimensional question and asked, “How does this child pay attention to detail?” Also, instead of scoring the re-worded item on a 4-point scale to measure presence of psychopathology (i. e., Not at All = 0, Just a Little = 1, Pretty Much = 2, and “Very Much = 3), we extended the 4-point scale to reflect strengths as well as weaknesses by using a 7-point scale anchored to average behavior (i.e., Far Below Average = 3, Below Average = 2, Somewhat Below Average = 1, Average = 0, Somewhat Above Average = −1, Above Average = −2, and Far Above Average = −3). We called this revision of the SNAP-IV the Strengths and Weakness of ADHD-symptoms and Normal-behavior (SWAN) scale.
Table 3.
The SWAN Rating Scale
|
Method
We collected teacher ratings using the SWAN scale for 327 elementary school-aged children in 12 classrooms. Each teacher completed the revised rating scale shown in Table 3 for each student in the classroom. Each item was scored on the full 7-point scale (−3 to +3) that measures both strengths and weaknesses (SWAN scoring), as well as the truncated 4-point scale (0 to 3) for symptom presence that collapses all behaviors average or better into the same rating (0) and measures just variation in weaknesses (SNAP scoring).
Results
We performed factor analysis for the summary scores derived from the SWAN (-3 to +3) scoring. As shown in Table 4, the SWAN items loaded on two factors as expected from the DSM-IV criteria (and similar to the SNAP items in Study I). The factor analysis of the SWAN ratings produced about a 10% increase in the percentage of variance explained by the two factors (87.87%) compared to the factor analysis of the SNAP ratings in Study I (77.78%). Also, there was a slight difference in the order of higher loading (higher loadings of the SWAN ADHD-HY/IMP items on Factor 1, in contrast to the higher loadings of the SNAP ADHD-INN items on Factor 1).
Table 4.
SWAN Factor Loadings
| SWAN Items | Factor 1 | Factor 2 |
|---|---|---|
| 1 Attending to detail | .362 | .835 |
| 2 Sustaining attention | .445 | .845 |
| 3 Listening | .498 | .782 |
| 4 Following through | .398 | .864 |
| 5 Organizing | .435 | .857 |
| 6 Engaging in sustained effort | .329 | .853 |
| 7 Keeping track of things | .429 | .851 |
| 8 Ignoring extraneous stimuli | .616 | .697 |
| 9 Remembering | .469 | .816 |
| 10 Sitting still | .781 | .529 |
| 11 Staying seated | .802 | .505 |
| 12 Modulating motor activity | .816 | .476 |
| 13 Playing quietly | .843 | .415 |
| 14 Settling down | .867 | .407 |
| 15 Modulating verbal activity | .857 | .375 |
| 16 Reflecting on questions | .842 | .372 |
| 17 Awaiting turn | .854 | .363 |
| 18 Entering into games or conversations | .816 | .400 |
| % of Variance Accounted for by Factor | 44.65 | 43.22 |
The distributions for the ADHD-C summary scores based on the SWAN scale and scoring are presented in Figure 3. The summary statistics for the ADHD-C score were mean = −.57, sd = 1.63, and skewness = .07. The summary statistics for the ADHD-INN and ADHD-HY/IMP scores were similar (mean = −.43, sd = .1.76, and skewness = .12 and mean = −.72, sd = 1.65, and skewness = .17, respectively). The positive skewness of these distributions was less than for the SNAP distribution in Study I and not statistically significant compared to the expectation of zero for a normal distribution. As shown in Figure 3, the distributions of the summary scores based on SWAN scoring suggest that these summary scores have uniform distributions (about 10%) over most of the range of possible scores with a reduced percentage (5% or less) at the “far below average” extreme.
Figure 3.

Population Distribution of the SWAN Rating
For each summary score, a statistical cutoff (mean + 1.65 sd) was calculated, and the cutoff scores were 2.11 for ADHD-C, 2.48 for ADHD-I, and 2.00 for ADHD-HI. In this sample, these cutoff scores identified less than the expected 5% extreme cases for ADHD-C (n=14, 4.28%), ADHD-I (n=13, 3.98%, and ADHD-HI (n=14, 4.28%). None of the differences were statistically significant from the expected value (5%) based on the normal distribution. The slight under-identification is expected for the slight positive (rightward) skewness observed for this sample.
A Venn diagram (see Figure 4) shows the overlap of extreme cases identified by these statistical cutoffs. A total of 23 cases (7.0%) were identified by meeting the p< .05 cutoff values for the SWAN on at least one of the subtypes of ADHD, compared to 13.2% identified by the p< .05 cutoff values for the SNAP in Study I (see Figure 2). This total (7+1+5+1+7+2=23) for the SWAN was based on cases meeting the cutoff criteria only for ADHD-I (n=7), for ADHD-I and ADHD-C but not ADHD-HI (n=1), for ADHD-C as well as ADHD-I and ADHD-HI (n=5), for ADHD-C but not ADHD-I or ADHD-HI (n=1), for ADHD-HI and ADHD-C but not ADHD-I (n=7), and for only ADHD-HI (n=2).
Figure 4.

Venn Diagram for Subsets with SWAN Scoring
We also used the 4-point scale similar to the SNAP for scoring the SWAN items. The similarity was based on collapsing the ratings of categories representing average or higher placement in the dimension (0 to −3) into one rating class (0). This transforms the 7-point scale into a 4-point scale: Average or better = 0, Somewhat below Average = 1, Below Average = 2, and Far Below Average = 3. As shown in Table 5, the distributions based on truncated scoring of the SWAN matched the distributions of the SNAP obtained in the first study.
Table 5.
Distribution of SWAN-C Ratings for Two Scoring Methods
| SNAP | SWAN with SNAP Scoring | ||||
|---|---|---|---|---|---|
| Score | N | % | Score | N | % |
| 0.5 | 543 | 64.1 | 0.5 | 228 | 69.7 |
| 1.0 | 134 | 15.8 | 1.0 | 33 | 10.1 |
| 1.5 | 81 | 9.6 | 1.5 | 35 | 10.7 |
| 2.0 | 48 | 5.7 | 2.0 | 17 | 5.2 |
| 2.5 | 30 | 3.5 | 2.5 | 8 | 2.4 |
| 3.0 | 11 | 1.3 | 3.0 | 6 | 1.8 |
Discussion
The use of statistical cutoffs from population distributions of ratings of items that are stated as symptoms of a psychiatric disorder may have a serious flaw. The rating of extreme behavior that represents psychopathology (and is by definition relatively rare in the population) should not be expected to follow a normal distribution. The population distributions for item scores and summary scores are likely to approximate the “contagious Poisson” distribution, with a high percentage of scores centered between 0 and 1. We demonstrated that theoretical cutoffs defined by z-scores or T-scores based on the assumption of normality inflate the number of cases considered to be extreme. In our example, for a standard cutoff (e. g., mean + 1.65 sd) for the SNAP-IV, the magnitude of over-identification of extreme cases was about 1.7 (e. g., 8.4% rather than the expected 5%).
These properties of symptom-based rating scales create problems for norms based on the assumption of a normal distribution, which is discussed in the manuals for the various ADHD rating scales. For example, for the Conners rating scales (Conners, 2008), norms are provided for both percentiles and T-scores, and the manual discusses the different uses of these norms. A complex procedure is necessary to assign T-scores to raw scores and to derive percentiles, which is similar to the procedure described for other rating scales of child psychopathology, such as the Achenbach System of Empirically Based Assessment (ASEBA: Achenbach and Rescorla, 2001, p 95). “To prevent overinterpretation of differences among low scores that are well within the normal range” (p. 163), Conners (2008) assigned a T score of 50 to all raw scores that were at or below approximately the 50th percentile of the normative sample. In the middle range of the non-normal distribution, T scores of 51 to 70 are assigned according to the percentiles of the normative sample. At the upper extreme, T scores were 71 to 100 in relation to the equal intervals of the raw scores that were above the 2 sd cutoff (the 98th percentile) in the normative sample, but since the DSM subscales had few raw scores above the 98th percentile, T = 100 was set as an upper limit.
Conners (2008) recommended that empirical, rather than theoretical, percentiles be used for interpretation. This rationale for this was provided: “The construction of theoretical percentiles involves the use of the normal distribution”; “… however, many of the Conners 3 scores are not normally distributed, and it would be inappropriate to interpret these scores with respect to the normal distribution.” The large difference between “…. the theoretical and empirical percentile is due to the fact that this scale is highly skewed” (p. 163).
Instead of making adjustments to T-scores or z-scores to take into account the skewness of the population (as well as the reduced variance of the “contagious Poisson” distribution), we reworded the ADHD symptoms to reflect the underlying range of behavior instead of the extreme (or psychopathology), and we used a 7-point scale to cover the full range of behavior in the non-clinical as well as clinical populations. By re-wording the items on the SWAN to render them dimensional, the SWAN scale captures variation related to strengths as well as weaknesses. This produces a distribution that approximates the normal distribution. The use of statistical norms for the domains of ADHD based on z-scores from the SWAN, which uses a dimensional definition of items, does not result in over-identification of extreme cases.
Another feature of the SWAN that distinguishes it from the SNAP (and other ADHD rating scales) is that it does not use all negative items. When the items are defined as symptoms of a disorder (as in the DSM criteria) or problem behaviors, as in a rating scale such as the Conner (1969) Rating scale or the Child Behavior Checklist (CBCL), the items are all negative. However, on some rating scales, such as the Strengths and Difficulties Questionnaire (SDQ: Goodman, 1997), some items have been worded to be positive in order to represent the opposite of symptoms. The SDQ has 25 items, and some are worded to reflect strengths and others to reflect difficulties (but no item has both extremes). The Difficulties are rated on a 3-point scale (0 = ”Not True”, 1 = “Somewhat True”, or 2 = “Certainly True”) and the Strengths are rated on a reversed 3-point scale (2 = “Not True”, 1 = “Somewhat True”, and 0 = “Certainly True”). The scoring of Strengths is reversed compared to Weaknesses (see above), so the scores of all items vary from 0 (Strengths) to 2 (Weaknesses).
The SDQ has 5 subscales each with 5 five items, and the number of items worded to reflect strengths and difficulties varies across the subscales. The SDQ Hyperactivity-Inattention subscale lists three Difficulties (“Restless, overactive, cannot stay still for long”, “Constantly fidgeting or squirming”, “Easily distracted, concentration wanders”) and two Strengths (“Thinks things out before acting” and “Sees tasks through to the end, good attention span”). The range of the Hyperactivity-Inattention subscale is 0 to 10, with a score of 0 indicating extreme lack of difficulties (i.e., good attention) and a 10 indicating an extreme presence of difficulties (i.e., poor attention or “attention deficit”). The SDQ Total Score serves as a dimensional measure of risk for psychiatric diagnosis across the range of behavior (Goodman and Goodman, 2009), but due to the unidirectional wording (i.e., either as a Strength or a Weakness, but not both) and the decision to use “reversed scoring” of items reflecting Strengths (2 to 0) compared to Weaknesses (0 to 2), the distribution of the SDQ Hyperactivity-Inattention subscale is highly skewed (see Swanson et al, 2011).
The use of the SWAN in twin studies (e. g., see Hay et al, 2006; Polderman et al., 2009) may reduce the “contrast effect” that has been hypothesized as a weakness of the twin methodology. Its use in molecular genetic studies may allow for the selection of subsets of cases from both ends of the population distribution, which is not practical based on the ADHD rating scales that truncate the range of possible ratings (see Cornish et al., 2005). In epidemiologic studies of the population, it is clear that variance is captured by the SWAN that is present in the population but is unmeasured by other rating scales (see Polderman et al., 2009). The truncation of the SWAN ratings to make them represent symptom-scores that are skewed has been demonstrated in population-based studies (see Lubke et al., 2006).
In summary, the examples provided here suggest how to create with a scale based on a new dimensional definition of items. This allows for use of parametric statistics and corrects the over identification flaw likely to be present with scales that are based on a categorical definition of items. Moreover, we provided the history, rationale, and evidence for the SWAN rating scale, which is increasingly appearing in the literature (e.g., Poderman et al., 2009; Lubke et al., 2006; Lakes, Swanson, & Riggs, 2011; Kudo et al., this issue).
Contributor Information
James M. Swanson, University of California, Irvine and Florida International University
Sabrina Schuck, University of California, Irvine.
Miranda Mann Porter, University of Texas and INC Research, Raleigh, NC.
Caryn Carlson, University of Texas.
Catharina A. Hartman, University Medical Center Groningen, University of Groningen
Joseph A. Sergeant, VrijeUniversiteit, Amsterdam
Walter Clevenger, University of California, Irvine and The Dairy Kings, Costa Mesa, CA.
Michael Wasdell, University of California, Irvine and Bridgepoint Collaboratory for Research and Innovation, Toronto Canada.
Richard McCleary, University of California, Irvine.
Kimberley Lakes, University of California, Irvine.
Timothy Wigal, University of California, Irvine.
References
- Achenbach TM, Rescorla L. Manual for ASEBA School-Age Forms & Profiles. Burlington, VT: University of Vermont, Research Center for Children, Youth, & Families; 2001. [Google Scholar]
- American Psychiatric Association. Diagnostic and statistical manual of mental disorders. 3. Arlington, VA: American Psychiatric Association; 1980. [Google Scholar]
- American Psychiatric Association. Diagnostic and statistical manual of mental disorders. 4. Arlington, VA: American Psychiatric Association; 1994. [Google Scholar]
- Atkins MS, Pelham WE, Lich MH. A Comparison of Objective Classroom Measures and Teacher Ratings of Attention Deficit Disorder. Journal of Abnormal Child Psychology. 1985;13:155–167. doi: 10.1007/BF00918379. [DOI] [PubMed] [Google Scholar]
- Atkins MS, Pelham WE, Lich MH. The Development and Validation of Objective Classroom Measures for Conduct and Attention Deficit Disorders. Greenwich, Connecticut: Jai Press; 1988. [Google Scholar]
- Atkins MS, Pelham WE, Lich MH. The differential validity of teacher ratings of Inattention/Overactivity and Aggression. Journal of Abnormal Child Psychology. 1989;17:423–435. doi: 10.1007/BF00915036. [DOI] [PubMed] [Google Scholar]
- Cantwell DP. The diagnostic process and diagnostic classification in child psychiatry--DSM-III. Journal of American Academy of Child Psychiatry. 1980;19:345–55. doi: 10.1016/s0002-7138(09)61058-x. [DOI] [PubMed] [Google Scholar]
- Conners CK. A teacher rating scale for use in drug studies with children. American Journal of Psychiatry. 1969;126:884–8. doi: 10.1176/ajp.126.6.884. [DOI] [PubMed] [Google Scholar]
- Conners CK. Conners’ Rating Scales Manual. Toronto, Canada: Multi-Health Systems, Inc; 1989. [Google Scholar]
- Conners CK. Conners’ Revised Rating Scales, Technical Manual. Toronto, Ontario: Multi-Health Systems, Inc; 1997. [Google Scholar]
- Conners CK. MHS Manual. 3. Tonawanda, New York: MHS; 2008. Conners. [Google Scholar]
- Cornish KM, Manly T, Savage R, Swanson JM, Morisano D, Butler N, Grant C, Cross G, Bentley L, Hollis CP. Association of the dopamine transporter (DAT1) 10/10-repeat genotype with ADHD symptoms and response inhibition in a general population sample. Mol Psychiatry. 2005;10:686–98. doi: 10.1038/sj.mp.4001641. [DOI] [PubMed] [Google Scholar]
- DuPaul GJ, Power TJ, Anastopulos AD, Reid R. ADHD Rating Scale IV: Checklist, norms, and clinical interpretation. New York, NY: The Guilford Press; 1998. [Google Scholar]
- Eisenberg L, Lansdowne EJ, Wilner DM, Imber SD. The use of teacher ratings in a mental health study: a method for measuring the effectiveness of a therapeutic nursery program. American Journal of Publics Health. 1962;52:18–28. doi: 10.2105/ajph.52.1.18. [DOI] [PMC free article] [PubMed] [Google Scholar]
- Gaub M, Carlson C. Behavioral characteristics of DSM-IV ADHD subtypes in a school-based population. Journal of Abnormal Child Psychology. 1997;25:103–111. doi: 10.1023/a:1025775311259. [DOI] [PubMed] [Google Scholar]
- Goodman A, Goodman R. Strengths and Difficulties Questionnaire as a Dimensional Measure of Child Mental Health. Journal of the American Academy of Child & Adolescent Psychiatry. 2009;48:400–403. doi: 10.1097/CHI.0b013e3181985068. [DOI] [PubMed] [Google Scholar]
- Hay D, Bennett K, Levy F, Sergeant J, Swanson J. A twin study of attention-deficit/ hyperactive disorder dimensions rated by the strengths and weaknesses of ADHD-symptoms and normal-behavior (SWAN) scale. Biolological Psychiatry. 2006;61:700–705. doi: 10.1016/j.biopsych.2006.04.040. [DOI] [PubMed] [Google Scholar]
- Jensen PS, Arnold LE, Swanson JM, Vitiello B, Abikoff HB, Greenhill LL, Hechtman L, Hinshaw SP, Pelham WE, Wells KC, Conners CK, Elliott GR, Epstein JN, Hoza B, March JS, Molina BS, Newcorn JH, Severe JB, Wigal T, Gibbons RD, Hur K. 3-year follow-up of the NIMH MTA study. Journal of American Academy of Child Adolescent Psychiatry. 2007;46:989–1002. doi: 10.1097/CHI.0b013e3180686d48. [DOI] [PubMed] [Google Scholar]
- Kudo M, Altamirano W, Mearns J, Stehli A, Wigal T, Swanson JM. SWAN Preschool Rating Scale (SWAN-P): Validity Evidence for English and Spanish Versions. International Journal of Educational and Psychological Assessment 2011 [Google Scholar]
- Lakes KD, Swanson JM, Riggs M. The reliability and validity of the English and Spanish Strengths and Weaknesses of ADHD and Normal Behavior (SWAN) rating scales: Continuum measures of hyperactivity and inattention. Journal of Attention Disorders. 2011 doi: 10.1177/1087054711413550. [DOI] [PMC free article] [PubMed] [Google Scholar]
- Lubke GH, Muthén B, Moilanen IK, McGough JJ, Loo SK, Swanson JM, Yang MH, Taanila A, Hurtig T, Järvelin MR, Smalley SL. Subtypes versus severity differences in attention-deficit/hyperactivity disorder in the Northern Finnish Birth Cohort. Journal of American Academy of Child Adolescent Psychiatry. 2007;46:1584–93. doi: 10.1097/chi.0b013e31815750dd. [DOI] [PubMed] [Google Scholar]
- MTA Cooperative Group. A 14-month randomized clinical trial of treatment strategies for attention deficit hyperactivity disorder. Arch Gen Psychiatry. 1999;56:1073–1086. doi: 10.1001/archpsyc.56.12.1073. [DOI] [PubMed] [Google Scholar]
- MTA Cooperative Group. National Institute of Mental Health Multimodal Treatment Study of ADHD follow-up: 24-month outcomes of treatment strategies for attention-deficit/hyperactivity disorder (ADHD) Pediatrics. 2004;113:754–761. doi: 10.1542/peds.113.4.754. [DOI] [PubMed] [Google Scholar]
- Pelham WE, Jr, Gnagy EM, Greenslade KE, Milich R. Teacher ratings of DSM-III-R symptoms for the disruptive behavior disorders. J Am Acad Child Adolesc Psychiatry. 1992;31:210–8. doi: 10.1097/00004583-199203000-00006. [DOI] [PubMed] [Google Scholar]
- PhenXTookit. n.d www.phenx.org.
- Polderman TJC, Derks EM, Hudziak JJ, Verhulst FC, Posthuma D, Boomsma DI. Across the continuum of attention skills: A twin study of the SWAN ADHD rating scale. Journal of Child Psychology and Psychiatry. 2007;48:1080–1087. doi: 10.1111/j.1469-7610.2007.01783.x. [DOI] [PubMed] [Google Scholar]
- Swanson JM. School-Based Assessment and Interventions for ADD Students. Irvine, CA: KC Publications; 1992. [Google Scholar]
- Swanson J, Deutsch C, Cantwell D, Posner M, Kennedy J, Barr C, Moyzis R, Schuck S, Flodman P, Spence A. Genes and attention-deficit hyperactivity disorder. Clinical Neuroscience Research. 2001;1:207–216. [Google Scholar]
- Swanson J, Nolan W, Pelham WE. The SNAP rating scale for the diagnosis of attention deficit disorder. Paper presented at the meeting of the American Psychological Association; Los Angeles. 1981. Aug, [Google Scholar]
- Swanson JM, Sandman CA, Deutsch C, Baren M. Methylphenidate hydrochloride given with or before breakfast: I. Behavioral, cognitive, and electrophysiologic effects. Pediatrics. 1983;72:49–55. [PubMed] [Google Scholar]
- Swanson JM, Wigal TL, Lakes KD. DSM V and the future of diagnosis of Attention Deficit Hyperactivity Disorder. Current Psychiatry Reports. 2009;11(5):399–406. doi: 10.1007/s11920-009-0060-7. [DOI] [PMC free article] [PubMed] [Google Scholar]
- Swanson JM, Wigal TL, Lakes KD, Volkow N. Attention Deficit Hyperactivity Disorder: Defining a spectrum disorder and considering neuroethical implications. In: Illes J, Shahakian B, editors. TheOxford Handbook of Neuroethics. Great Britain: Oxford University Press; 2011. pp. 309–340. [Google Scholar]
- Task force on DSM-IV. DSM-IV Options Book: Work in progress (1991) Washington, DC: American Psychiatric Association; 1991. [Google Scholar]
- Ullmann RK, Sleator EK, Sprague RL. A change of mind: the Conners abbreviated rating scales reconsidered. Journal of Abnormal Child Psychology. 1985;13:553–65. doi: 10.1007/BF00923141. [DOI] [PubMed] [Google Scholar]
- Wolraich ML, Feurer ID, Hannah JN, Baumgaertel A, Pinnock TY. Obtaining systematic teacher reports of disruptive behavior disorders utilizing DSM-IV. J Abnormal Psychol. 1998;26:141–152. doi: 10.1023/a:1022673906401. [DOI] [PubMed] [Google Scholar]