Abstract
Objectives
Use of the American College of Radiology (ACR) Breast Imaging Reporting and Data System (BI-RADS®) Atlas for ultrasound (US) qualitatively describes the echogenicity and attenuation of a mass where fat lobules serve as a standard for comparison. This study aims to estimate acoustic properties of breast fat under clinical imaging conditions to determine the degree to which properties vary among subjects.
Methods
Twenty-four women with solid breast masses scheduled for biopsy were scanned using Siemens S2000 and 18L6 linear array transducers. Offline analysis estimated attenuation (Att) and backscatter coefficients (BSC) from breast fat using the reference phantom method. The average backscatter coefficient (ABSC) was calculated over 6–12MHz to objectively quantify the US-BIRADS echo pattern descriptor, and effective scatterer diameters (ESD) were also estimated.
Results
A power law fit to the attenuation coefficient vs. frequency yielded Att=1.28 dB·cm−1MHz−0.73. The mean attenuation coefficient vs. frequency slope at 7 MHz is 0.73 ± 0.23 dB·cm−1MHz−1 in agreement with previously reported values. BSC versus frequency exhibited close agreement among all subjects, both in magnitude and frequency dependence with a power law fit of (0.6±0.25) ×10−4 sr−1cm−1MHz−2.49. The average backscatter in the 6–12 MHz range is 0.004±0.002 sr−1cm−1. The mean effective scatterer diameter for fat is 60 ± 9.3 μm.
Conclusions
The agreement in parameter estimates for breast fat among subjects supports the use of fat as a standard for comparison with tumors. Results also suggest that objective quantification of these US-BIRADS descriptors may reduce subjectivity when interpreting B-mode image data.
Keywords: breast fat, Attenuation, backscatter coefficient, quantitative ultrasound, US BIRADS
INTRODUCTION
Breast cancer is the second most common cancer among women and the second leading cause of cancer death of women in the United States.1 The common screening tests for breast cancer include clinical breast exams, breast self-exams, and mammography. The American Cancer Society recommends annual mammograms for women age 40 and over, continuing as long as a patient is in good health. For women with a family history of breast cancer, or having certain other risk factors, magnetic resonance imaging (MRI) is recommended in addition to mammograms.2 To aid with the communication of image interpretation, the American College of Radiology published the Breast Imaging Reporting and Database System (BI-RADS®). This system improves patient care because it implements common terminology for diagnostic descriptions and generally leads to proper follow-up tests and procedures.3
Breast ultrasound has become a valuable diagnostic tool to use in conjunction with mammography because equipment is widely available and cost-effective, and ultrasound provides unique soft tissue information. Ultrasound is most useful in assessing very dense breasts due to the low sensitivity of mammography in these cases. Berg et al.4 studied 2662 women, among which there were 4814 incidence screens (annual ultrasound screens for second and third years of study). In that group, they observed sensitivity and specificity for mammography of about 0.52 and 0.91, respectively. The sensitivity for mammography plus ultrasound increased to 0.76, but the specificity decreased to 0.84. The sensitivity for MRI and mammography plus ultrasound was further increased to 1.00, but the specificity further decreased to0.65.
Several studies have evaluated inter-observer variability when interpreting sonographic features of solid breast masses. Arger et al.5 found that the interpretations of four different readers were comparable when standardized descriptors of breast masses were applied. Similarly, Rahbar et al.6 found that ultrasound features can be effective when differentiating benign from malignant masses. However, the authors stressed that interpreter variability needs to be dealt with. Useful diagnostic features on ultrasound B-mode images of breast tumors include the tumor margin, shape, and internal echo pattern. Malignant masses often have poorly defined margins and irregular borders, are hypoechoic (compared to nearby breast fat), and exhibit posterior shadowing. These features have become part of the ultrasound breast imaging BI-RADS lexicon.3
Interpretation of ultrasound images to diagnose solid breast masses generally includes comparing B-mode image features of a mass with those of surrounding fat and parenchymal tissue. In the US-BIRADS lexicon, 3 internal echo patterns of masses are categorized as anechoic, hypo-echoic, iso-echoic, hyper-echoic, or complex. Although these descriptors are closely related to the backscatter properties of breast masses, the evaluation of these features is qualitative, subjective, and coarsely assigned (most breast tumors are described as ‘hypoechoic’ but there is no mention of ‘how hypoechoic’). Specifically, clinicians utilize breast fat as a standard for comparison of the echogenicity and the attenuation (shadowing) features of masses.
Although it serves as a source for comparison, there is little data in the literature demonstrating the range of acoustic properties of in-vivo breast fat. Foster et al.7 measured attenuation coefficients and backscatter coefficients at 13 MHz for excised breast specimens that included fat. Edmonds et al.8 measured attenuation coefficient vs. frequency slopes for excised breast tissues, including fat, over the 3–8 MHz range. D’Astous and Foster9 developed a novel tissue analysis system to measure attenuation and backscatter coefficients for excised breast tissue specimens under controlled conditions. In-vivo data were obtained by Anderson et al.10 who measured BSCs of fibro-glandular and fatty breast tissue in the 5.25–13 MHz frequency range using a reference phantom method.
In this study, use of fat as a clinical reference tissue for US-BIRADS descriptors is examined using quantitative ultrasound (QUS). QUS enables accurate, clinically-based estimates of acoustic properties of in-vivo tissues by accounting for instrumentation and wave propagation dependencies on pulse-echo data. QUS parameters, including ultrasound backscatter coefficients and slopes of the attenuation coefficient vs. frequency, have been used to differentiate fatty liver from normal liver,11,12 characterize trabecular bone13 and cortical bone,14 and assess properties of the breast.15 In addition, spectral analysis of backscattered echo signals has been used to differentiate between benign and malignant masses in the eyes16 and in lymph nodes,17,18 to outline high-risk regions to guide prostate biopsies,19 and to monitor changes in glomerular and arteriole sizes in kidneys.20,21 Estimation of the effective scatter diameter differentiated rat mammary fibroadenomas from 4T1 mouse carcinomas in a pre-clinical study.22
Here we used radiofrequency data from conventional clinical ultrasound imaging equipment with a linear array transducer to determine acoustic properties of breast fat under clinical imaging conditions at frequencies used in breast ultrasonography. Attenuation coefficients, backscatter coefficients, and features derived from the frequency dependence of scattering were computed.
MATERIAL AND METHODS
Radiofrequency (RF) echo data were acquired from 117 human subjects who were scheduled for breast core biopsy because of a suspicious mass detected by palpation or on mammography. The protocol used in the study is University of Wisconsin Health Sciences Institutional Review Board approved and Health Insurance Portability and Accountability Act (HIPAA) compliant. Subjects were scanned using a Siemens S2000 scanner (Siemens Medical Solutions USA, Inc, Malvern, PA) equipped with an 18L6 linear array transducer that was driven at 15 MHz. The probe incorporates a Hanafy lens, which effectively varies the elevational aperture size with frequency23. The system was equipped with the Axius Direct Ultrasound Research Interface24 that allows acquisition of beam-formed RF echo signals following time-gain compensation but before envelope detection and post processing. For each subject, multiple planes of RF data were collected, with the image plane centered on the mass and depicting surrounding subcutaneous fat. The transmit focus was placed below the mass, usually at approximately 6 cm. To minimize any effects of nonlinear propagation, the transmit power was well below maximum setting, resulting in mechanical index (MI) values between 0.4–0.8 for these transmit focal depths.
RF data also were obtained from a well-characterized reference phantom scanned using the same transducer and system settings. The reference phantom material is an emulsion of 70% safflower oil immersed in a gelatin-water mixture composed of propylene glycol, deionized water, dry gelatin and 7.5 grams of Germall Plus® to preserve it at 50°C. The phantom also contains 6.4 g of 3000e glass beads (Potter industries, Malvern, PA) per 1600 cc oil in gelatin emulsion. The volume of the phantom is about 1.6 liter and the mass density is1.04 g/cm3.
The acoustic properties of the reference phantom were determined using a laboratory-based, narrowband substitution method to measure attenuation and speed of sound25,26 and a planar reflector method to measure backscatter coefficients.27 The sound speed of the phantom is 1492m/s; the attenuation coefficient vs. frequency, α(f), is represented by α(f) = 0.54f dB/cm, where f is the frequency in MHz, and the backscatter coefficient at 5MHz is 1.37E-03cm−1sr−1. The tissue mimicking material was cast into an acrylic box with a 25μm-thick Saran™ film scanning window (Dow Chemical, Midland MI, USA).28–32 Reference phantom data were used during the analysis to account for system dependencies on the echo data. This method was tested in multiple research studies and demonstrated system-independent estimates as well as agreement between theory and experiments.33–38
Data from 24 subjects were selected for this analysis. On B-mode images, most fat lobules appeared to be homogeneous in their backscatter properties, though some exhibited heterogeneity. For data analysis we excluded heterogeneous fat lobules since radiologists compare echogenicity of a suspicious mass to that of fat using the average brightness, ignoring any specular reflectors or other heterogeneity that might be present. QUS parameter estimation techniques can provide reliable estimates for structures larger than 5 mm; in our study most of the fat lobules were large enough to effectively estimate QUS parameters. Criteria for analysis were image data that depicted large (> 1 cm) and homogeneous (no noticeable internal specular reflectors) fat lobules to obtain reliable estimates of acoustic properties.
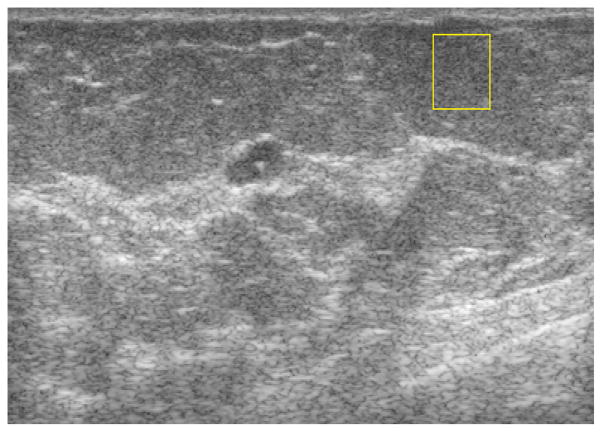
A typical example is shown in Figure 1 in which a manually selected region of interest (ROI) within a fat lobule is outlined on the B-mode image. Analysis of the attenuation (Att), the backscatter coefficient (BSC), and an “effective scatterer diameter” (ESD) were carried out over such ROI’s for each subject to characterize breast fat (SF).
Figure 1.
Typical breast ultrasound image from this study showing an example of breast fat ROI selection (rectangle in the upper right).
Attenuation estimation
Data analysis was performed offline using routines written in Matlab (the Mathworks, Natick, MA). Rectangular parameter estimation regions (PERs) were identified within a uniform ROI of a fat lobule selected as outlined above for each patient. Echo signal power spectra were calculated as a function of depth for data segments within this region for both the sample and reference phantom. To calculate a power spectrum, 4 mm × 4 mm power spectrum analysis windows, overlapping by 75% both axially and laterally, were defined. For each RF line within the window, the Fourier transform was computed using a multi-taper technique with a time-half bandwidth product35,39 (NW) of 4. The results for beam lines over the window were then averaged. For a homogenous parameter estimation region, the ratio of the echo signal power spectrum from the sample to the power spectrum for the reference phantom is given by36:
| (1) |
where S(f, z) represents the power spectra, the subscripts s and r refer to the sample and reference, αs and αr are attenuation coefficients, f is the frequency and z is the depth. The term bfn represents the backscatter coefficient, modeled here as a power law in frequency for both media. As Yao36 has shown, the ratio in Eq. 1 eliminates transducer and system dependencies on the data.
The exponential term contains the difference between the attenuation coefficients of the sample and of the reference phantom. This difference is estimated from the rate of change of the power spectra ratio with depth. Then, since the attenuation coefficient of the reference phantom is known, this yields the attenuation coefficient of the fat lobule sample at each frequency.
Although the average speed of sound within the lobule as well as in any overlying tissues is not known, having the transmit focus set distal to the ROI minimizes any bias in attenuation estimates caused by sound speed mismatches.40 The maximum frequency band, over which the echo signal power spectrum, that was at least 10 dB above the noise floor was selected for each subject. When reporting final results, the maximum frequency range common among all data sets was used.
Backscatter coefficient estimation
The backscatter coefficient (BSC) is defined as the differential scattering cross section per unit volume for a scattering angle of 180°. The reference phantom used for attenuation estimates within each fat lobule method which is accurate over homogeneous regions. An alternative strategy had to be applied, however, to correct for the attenuation over the more inhomogeneous tissue paths between the ultrasound transducer and the ROI during BSC estimates. Here we applied a modified version of the least squares method developed by Nam et al.,40 to estimate an “effective attenuation coefficient” over the path between the ultrasound transducer and the center of each gated region within the ROI. In the Nam method, ultrasound attenuation is approximated as a linear function of frequency:
| (2) |
where α0 is the attenuation coefficient versus frequency slope and, α1 is a positive constant representing the intercept and is set to zero in the Nam method.
Thus, the cumulative attenuation A(f, z) from the transducer to depth z is approximated by
| (3) |
Similarly, the backscatter coefficient B(f) within the ROI is modeled as a power law.
Recent experiments34 suggest that the attenuation coefficient for breast tissue likely is not linearly proportional to frequency. To take this into consideration, a modification of the Nam method, an “iterative Least Squares Method” (ILSM), is applied in this study. We first take the natural log of the ratio of the power spectra in Eq.1, yielding,
| (4) |
To simplify, we apply the following substitutions
| (5) |
Thus,
| (6) |
A three parameter least squares linear fit (based on power law models for tissue attenuation and backscatter) is used to solve for the unknowns, b, n and α that are consistent with the power spectrum data within the frequency band. Thus,
| (7) |
where b̂, n̂ and α̂ are the estimated parameters and K is the number of frequency components to be used for the least squares fitting.
Nam et al.41 apply Eq. 7 to the entire echo signal frequency spectrum. However, in the iterative method used here, we divide the echo signal frequency band into subbands 2MHz wide with 50% overlap. By using relatively narrow frequency ranges for analysis, the approximation that attenuation is linearly dependent on frequency over that narrow frequency range is reasonably accurate. Starting at the lower band, i.e., where the echo signal power spectrum first exceeds the noise floor by 10 dB, values for b̂, n̂ and α̂ are determined.
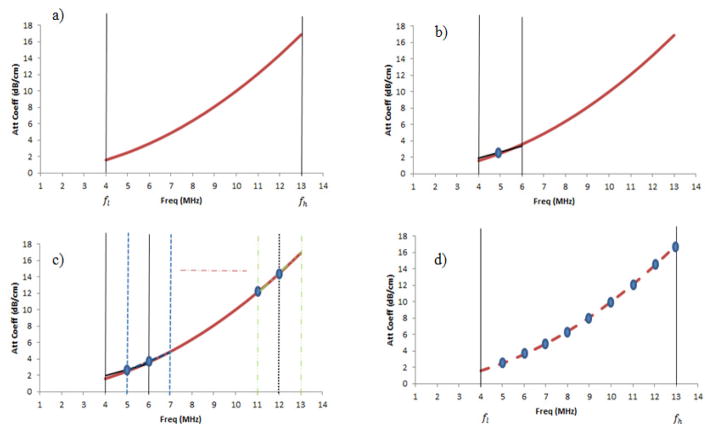
The resulting value for the attenuation coefficient over the first subband then serves as a starting point, α1 in Eq. 2, for a subsequent fit to the data over the next subband, as shown in Figure 2. The process continues over the interval for which the echo signal power spectrum exceeds the noise floor as above. The estimation results from each subband are then combined into a single power law attenuation model to smooth out the stepwise linear function and obtain an estimate of the effective attenuation coefficient vs. frequency. Once an accurate estimate for the effective attenuation coefficient and its frequency dependence is obtained over the entire frequency band, the BSC for the fat lobule can be estimated as a function of frequency using the reference phantom technique, but inserting the effective attenuation coefficient into Eq. 1.
Figure 2.
Iterative least squares method (ILSM) for attenuation estimation, where the solid curved line is the underlying attenuation coefficient vs. frequency to be estimated. In a) the first frequency subband is chosen, b) a linear fit is applied to the first subband, c) the process is repeated for multiple subbands overlapping by 50% where the resulting value for the attenuation coefficient in the previous subband serves as the starting point for the next subband, d) a power law attenuation fit among the stepwise linear fits from each subband is obtained. fl and fh stands for lower and higher frequency limits respectively.
Besides the BSC(f) function, for each subject an average BSC (ABSC) was computed over the same (6–12 MHz) frequency range used for attenuation coefficients.
Effective scatter diameter (ESD) estimation
An “effective scatter diameter” (ESD) was estimated over regions of interest within the fat lobules to characterize the frequency dependence of the scattering. A Gaussian form factor was utilized to model soft tissue backscatter.42 The ESD is determined by finding the backscatter model that yields the minimum average squared deviation between the theoretical model (for a particular size scattering source) and measured form factors using Chi-squared statistics for the “best fit” metric. The ESD estimated here does not identify a microscopic scattering structure but simply parameterizes the frequency dependence of scattering.
RESULTS
Attenuation coefficients vs. frequency results for the selected fat lobule in each patient are presented in Figure 3, while a summary plot for data over the 4–12 MHz range is presented in Figure 4. These are computed directly using the reference phantom method and Eq. 1. The results in Figure 3 exhibit significant variation in overall magnitude from one patient to another. For example, at 8 MHz, breast fat attenuation coefficients ranging from 3.2 dB/cm up to 7.5 dB/cm were obtained. A similar range and variability is seen at other frequencies (above about 6 MHz).
Figure 3.
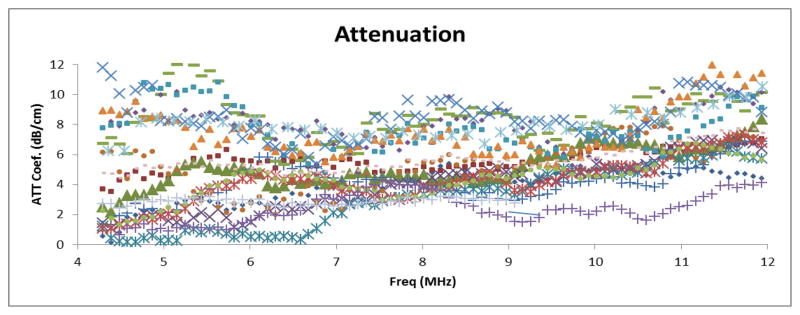
Attenuation coefficient vs. frequency in breast fat for individual subjects
Figure 4.
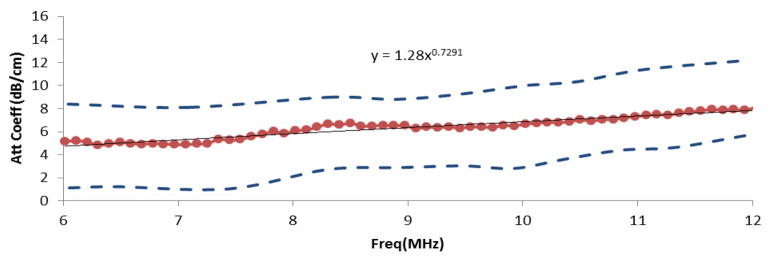
The mean attenuation coefficient estimates (dots) of breast fat among 24 subjects, the standard deviations (dashed line) and the combined power law fit for the attenuation coefficient vs. frequency.
The attenuation coefficient versus frequency data in the 4–6 MHz range exhibits unexpected behavior in that some patients’ data suggest a decrease in attenuation with frequency over this range. It is likely that there exist non-apparent sources of echo signal coherence, such as interfaces or isolated strong scatterers, within the attenuation PERs that would violate assumptions used in attenuation estimation, and that these may be more prominent at lower frequencies. Thus, the summary plot for the attenuation results (Figure 4) excludes the 4–6 MHz frequency range.
A power law fit for the attenuation for the combined data set (24 subjects) for the 6–12MHz frequency range resulted in α(f) = 1.28 dB·cm−1MHz−0.73. A plot of the mean attenuation coefficient vs. frequency is shown in Fig. 4.
As mentioned above, for each patient, attenuation coefficients were computed for several PERs within the ROI. For determining the variability among patients and to facilitate comparison with results of previous investigators, we fit the data to a straight line with zero intercept and estimated the slope of the attenuation coefficient vs. frequency at 7 MHz for each PER. We then computed an average and standard deviation of these values within the ROI from independent PERs. Results are presented in Figure 5 for each of the 24 subjects. The average attenuation coefficient vs. frequency slope among all subjects was 0.73 ± 0.23 dB·cm−1MHz−1. The mean over all patients of the fat lobule BSC vs. frequency follows a power law fit of (0.6±0.25) ×10−4 sr−1cm−1MHz−2.49. The average backscatter coefficient (ABSC) in the 6–12 MHz range is 0.004±0.002 cm−1sr−1. Individual ABSC’s were plotted on a logarithmic scale to study deviations from the average value among subjects and results are shown in Figure 6 for all subjects. The results showed that the ABSC range among subjects is about 10 dB. Such variations would be barely perceptible on a gray scale ultrasound image, where a compression setting of 70 dB in the displayed echo dynamic range usually is used for breast imaging.
Figure 5.

Slope of the attenuation coefficient vs. frequency computed at 7MHz for each subject. The circles represent the mean for each subject and the bars show the corresponding standard deviations.
Figure 6.

ABSC estimates for breast fat for each subject, shown relative to the mean value among all subjects (solid line). The dashed lines indicate the upper and lower range of values.
Effective scatterer diameters were estimated to characterize the frequency dependence of backscatter. The mean ESD among all subjects is 60.2 ± 9.5 μm. Figure 7 shows ESD estimates for each subject compared to the mean value among estimates.
Figure 7.

Effective scatterer diameter (ESD) estimates for breast fat for each subject. The solid line shows the mean value among ESD estimates.
DISCUSSION
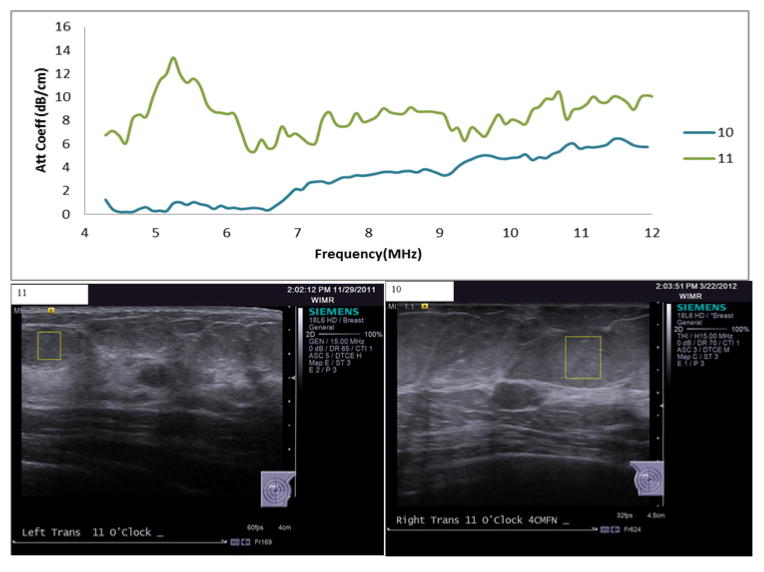
The in-vivo results for subcutaneous fat showed noticeable variability in attenuation estimates in the 4–6MHz frequency range. Intra-subject variability of about 6% was observed in attenuation estimates among the different ROIs selected within the same fat lobule. Attenuation estimate variance among subjects would likely have been smaller if larger ROIs were used and those ROIs were tested to demonstrate a lack of echo signal coherence and homogeneity of parameter estimates within the ROI. Attenuation is assumed to increase with frequency, but Figure 8 shows attenuation coefficient and B-mode images of two cases that do not follow this assumption. In one case, high attenuation values were estimated in the lower frequency band compared to the higher frequency band. In the other case, the attenuation estimates in the lower frequency band are very close to zero. In both cases it is possible that sources of echo signal coherence were present in the ROI. Systematic analysis of echo signal data that first tests for the presence of echo signal coherence prior to QUS parameter estimates that assume incoherent scattering are currently being implemented43 and will be employed in future analysis.
Figure 8.
Top: attenuation coefficient vs. frequency estimates for two cases (case 1:upper line, case 2: lower line) of unexpected behavior of attenuation vs. frequency. Bottom: Associated B-mode images with the ROI (outlined boxes) within which the attenuation coefficients were estimated.
Attenuation and backscatter coefficient estimates in this study were compared with previously published work. D’Astous and Foster9 reported a mean attenuation coefficient vs frequency of 0.16±0.03 dB·cm−1MHz−1.7, and a backscatter coefficient of (0.92±0.65) × 10−4sr−1·cm−1·MHz−1.9 for ex vivo breast fat. Thus, their attenuation coefficient vs. frequency slope for fat at 7 MHz would be about 0.62±0.12 dB·cm−1MHz−1 (compared to 0.73 ± 0.23 dB·cm−1MHz−1for in vivo estimates in our study). Figure 9 shows our individual in-vivo results for the attenuation coefficient versus frequency slope compared with the excised breast tissue estimates reported by D’Astous and Foster. Our values appear, on average, to be slightly higher than those of D’Astous and Foster, although the standard deviations among estimates certainly overlap.
Figure 9.

Attenuation coefficient vs. frequency slopes reported in Fig 5 for breast fat (data points), compared to mean values for the same parameters for ex-vivo breast fat reported by D’Astous and Foster.
In other reports, Foster et al.7 measured attenuation and backscatter coefficients for excised breast specimens at 13MHz; Edmonds et al.8 measured attenuation coefficient vs. frequency slopes for fat over the 3–8MHz range; Anderson et al.10 measured the backscatter coefficient of subcutaneous fat from 5.25 to 13 MHz; and Raju et al.44 measured attenuation and backscatter coefficients of subcutaneous fat in vivo at the wrist and elbow in the range 14 to 34MHz. Table 1 shows the average values measured for the 24 subjects in the current study along with values reported by these researchers.
Table 1.
Average values of the attenuation coefficient modeled as a linear function of frequency (Att), the backscatter coefficient (BSC) modeled as a power law and the average backscatter coefficient (ABSC) of breast fat versus literature values
| Data | Frequency (MHz) | Att (dB·cm−1MHz−1) | BSC (bfn) | ABSC* (sr−1 cm−1) | |||
|---|---|---|---|---|---|---|---|
|
|
|||||||
| mean | Stdev. | b (×10−4) | n | mean | Stdev. | ||
| D’Astous and Foster9 | 3–7 | 0.62 | 0.12 | 0.92±0.65 | 1.9 | 0.004 | 0.003 |
| Anderson et al. 10 | 5.25–13 | - | - | 0.259 | 3.4 | 0.003 | 0.003 |
| Edmonds et al. 8 | 3–8 | 2.00 | 0.65 | - | - | - | - |
| Raju et al. 38 | 14–34 | 1.84 | - | - | 0.073 | 0.072 | |
| Foster et al. 7 | 13 | 1.1 | 0.3 | 1.4±0.6 | - | 0.014 | 0.006 |
| Current study results | 6–12 | 0.73 | 0.23 | 0.6±0.25 | 2.5 | 0.004 | 0.002 |
ABSC shown corresponds to the frequency range stated in the table.
For visual comparisons between our in-vivo data and the data from these previous studies, values are plotted on a logarithmic scale, and are shown in Figure 10. The plots suggest very consistent results among current and previously published data over the frequency ranges tested.
Figure 10.
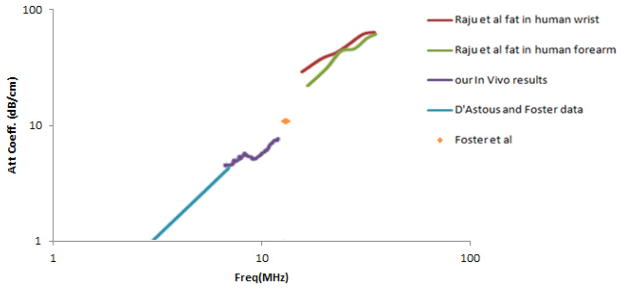
Attenuation coefficient vs. frequency for breast fat comparing in-vivo breast measurements to previously reported results.
Focusing on the low frequency data, Figure 11 shows the ex-vivo results from D’Astous and Foster as well as from Foster et al. compared to our in vivo results. The regions shown are defined by the mean plus and the mean minus one standard deviation of the reported results.
Figure 11.
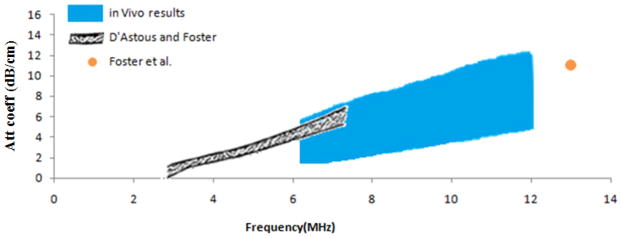
Attenuation coefficient vs. frequency for breast fat, comparing ex-vivo results of D’Astous and Foster, Foster et al., and the in-vivo results reported in this study.
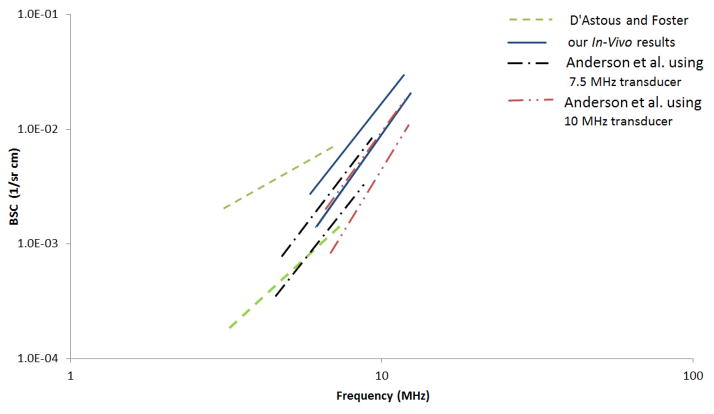
The measured BSC versus frequency for breast fat in this study exhibited close agreement among all 24 subjects both in magnitude and frequency dependence. A graphic comparison on a log-log plot of these results with those of D’Astous and Foster and those of Anderson et al. using 7.5 and 10 MHz transducers is presented in Figure 12. The upper and lower curves shown are defined by the mean plus and the mean minus one standard deviation of the reported results.
Figure 12.
BSC vs. frequency for breast fat as reported by D’Astous and Foster, Anderson et al., and this paper.
CONCLUSION
The results reported here show consistency in acoustic properties of breast fat among twenty four subjects. The range of average backscatter coefficient in the 6–12 MHz frequency range for breast fat in each subject is within 5 dB of the mean ABSC value across subjects. These findings quantitatively support the use of fat as a reference tissue for US-BIRADS. The consistency in the characteristics of breast fat encourages future use of quantitative measures, for example to specify the degree to which a mass is “hypo-echoic.” Similarly, reporting the attenuation coefficient versus frequency slope, or some equivalent measure, may reduce the subjectivity in describing ‘posterior acoustic features’ which depend on both the attenuation in the mass and its dimension along the acoustic beam path. This could in turn improve BIRADS descriptors of ultrasound breast data.
Acknowledgments
The authors would like to thank Sarah Kohn for scanning the subjects in the study. We also thank Ernest Madsen and Gary Frank for making the reference phantom used in the study. This work was supported, in part, by NIH grants R01CA111289 & R01CA140271, the University of Wisconsin Foundation, and technical support from Siemens Ultrasound.
References
- 1.Online Cancer Statistics 2014. American Cancer Society, Inc; [Accessed June 2014]. website. http://www.cancer.org/cancer/breastcancer/detailedguide/breast-cancer-key-statistics. [Google Scholar]
- 2.Online American Cancer Society recommendations for early breast cancer detection in women without breast symptoms. American Cancer Society, Inc; [Accessed June 2014]. website. http://www.cancer.org/cancer/breastcancer/moreinformation/breastcancerearlydetection/breast-cancer-early-detection-acs-recs. [Google Scholar]
- 3.Online American College of Radiology. [Accessed June 2014];BI-RADS: Ultrasound. (1). Website. http://www.acr.org/Quality-Safety/Resources/BIRADS/Ultrasound.
- 4.Berg WA, Zhang Z, Lehrer D, Jong RA, Pisano ED, Barr RG, et al. Detection of Breast Cancer With Addition of Annual Screening Ultrasound or a Single Screening MRI to Mammography in Women With Elevated Breast Cancer Risk. JAMA. 2012;307(13):1394–1404. doi: 10.1001/jama.2012.388. [DOI] [PMC free article] [PubMed] [Google Scholar]
- 5.Arger PH, Sehgal CM, Conant EF, Zuckerman J, Rowling SE, Patton JA. Interreader variability and predictive value of US descriptions of solid breast masses: piot study. Acad Radiol. 2001;8(4):335–342. doi: 10.1016/S1076-6332(03)80503-2. [DOI] [PubMed] [Google Scholar]
- 6.Rahbar G, Sie AC, Hansen GC, Prince JS, Melany ML, Reynolds HE, et al. Benign versus malignant solid breast masses: US differentiation. Radiology. 1999;213:889–894. doi: 10.1148/radiology.213.3.r99dc20889. [DOI] [PubMed] [Google Scholar]
- 7.Foster FS, Strban M, Austin G. The Ultrasound Macroscope: Initial Studies of Breast Tissue. Ultrason Imaging. 1984;6(3):243–261. doi: 10.1177/016173468400600301. [DOI] [PubMed] [Google Scholar]
- 8.Edmonds PD, Mortensen CL, Hill JR, Holland SK, Jensen JF, Schattner P, et al. Ultrasound Tissue Characterization Of Breast Biopsy Specimens. Ultrason Imaging. 1991;13(2):162–185. doi: 10.1177/016173469101300204. [DOI] [PubMed] [Google Scholar]
- 9.D’Astous FT, Foster FS. Frequency-dependence of ultrasound attenuation and backscatter in breast-tissue. Ultrasound Med Biol. 1986;12(10):795–808. doi: 10.1016/0301-5629(86)90077-3. [DOI] [PubMed] [Google Scholar]
- 10.Anderson ME, Soo MS, Trahey GE. In vivo breast tissue backscatter measurements with 7. 5-and 10-MHz transducers. Ultrasound Med Biol. 2001;27(1):75–81. doi: 10.1016/s0301-5629(00)00310-0. [DOI] [PubMed] [Google Scholar]
- 11.Fujii Y, Taniguchi N, Itoh K, Shigeta K, Wang Y, Tsao W, et al. A new method for attenuation coefficient measurement in the liver: comparison with the spectral shift central frequency method. J Ultrasound Med. 2002;21(7):783–788. doi: 10.7863/jum.2002.21.7.783. [DOI] [PubMed] [Google Scholar]
- 12.Narayana PA, Ophir J. On the frequency dependence of attenuation in normal and fatty liver. IEEE Trans Son Ultrason. 1983;SU-30(6):379–383. [Google Scholar]
- 13.Wear KA. Characterization of trabecular bone using the backscattered spectral centroid shift. IEEE Trans Ultrason Ferroelectr Freq Control. 2003;50(4):402–407. doi: 10.1109/tuffc.2003.1197963. [DOI] [PMC free article] [PubMed] [Google Scholar]
- 14.Sasso M, Haïat G, Yamato Y, Naili S, Matsukawa M. Dependence of ultrasonic attenuation on bone mass and microstructure in bovine cortical bone. J Biomech. 2008;41(2):347–355. doi: 10.1016/j.jbiomech.2007.09.001. [DOI] [PubMed] [Google Scholar]
- 15.Golub RM, Parsons RE, Sigel B, Feleppa EJ, Justin J, Zaren HA, et al. Differentiation of breast tumors by ultrasonic tissue characterization. J Ultrasound Med. 1993;12(10):601–608. doi: 10.7863/jum.1993.12.10.601. [DOI] [PubMed] [Google Scholar]
- 16.Liu T, Lizzi FL, Silverman RH, Kutcher GJ. Ultrasonic tissue characterization using 2-D spectrum analysis and its application in ocular tumor diagnosis. Med Phys. 2004;31(5):1032–1039. doi: 10.1118/1.1690196. [DOI] [PMC free article] [PubMed] [Google Scholar]
- 17.Feleppa EJ, Machi J, Noritomi T, Tateishi T, Oishi R, Yanagihara E, Jucha J. Differentiation of Metastatic from benign lymph nodes by spectrum analysis in vitro. Proc IEEE Ultrason Symp. 1997;2:1137–1142. [Google Scholar]
- 18.Mamou J, Coron A, Hata M, Machi J, Yanagihara E, Laugier P, et al. Three-dimensional high-frequency characterization of excised human lymph nodes. Proc IEEE Ultrason Symp. 2009:45–48. [Google Scholar]
- 19.Feleppa EJ, Urban S, Kalisz A, Lizzi FL, Fair WR, Porter CR. Advanced ultrasonic imaging of the prostate for guiding biopsies and for planning and monitoring therapy. Proc IEEE Ultrason Symp. 2000;2:1399–1403. [Google Scholar]
- 20.Hall TJ, Insana MF, Harrison LA, Cox GG. Ultrasonic measurement odf glomerular diameters in normal adult human. Ultrasound Med Biol. 1996;22(8):987–997. doi: 10.1016/s0301-5629(96)00142-1. [DOI] [PubMed] [Google Scholar]
- 21.Insana MF, Wood JG, Hall TJ. Identifying Acoustic Scattering Sources In Normal Renal Parenchyma In Vivo By Varying Arterial And Ureteral Pressures. Ultrasound Med Biol. 1992;18(6–7):587–599. doi: 10.1016/0301-5629(92)90073-j. [DOI] [PubMed] [Google Scholar]
- 22.Oelze ML, O’Brien WD, Blue JP, Zachary JF. Differentiation and characterization of rat mammary fibroadenomas and 4T1 mouse carcinomas using quantitative ultrasound imaging. IEEE Trans Med Imaging. 2004;23(6):764–771. doi: 10.1109/tmi.2004.826953. [DOI] [PubMed] [Google Scholar]
- 23.Hanafy AM. patent no. US 5976091 A Limited diffraction broadband phased array transducer with frequency controlled two dimensional aperture capability. 1999
- 24.Brunke SS, Insana MF, Dahl JJ, Hansen C, Ashfaq M, Emert H. An ultrasound research interface for a clinical system. IEEE Trans Ultrason Ferroelectr Freq Control. 2007;54(1):198–210. doi: 10.1109/tuffc.2007.226. [DOI] [PubMed] [Google Scholar]
- 25.Madsen EL, Frank GR, Carson PL, Edmonds PD, Frizzell LA, Herman BA, et al. Inter-laboratory comparison of ultrasonic attenuation and speed measurements. J Ultrasound Med. 1986;5:569–576. doi: 10.7863/jum.1986.5.10.569. [DOI] [PubMed] [Google Scholar]
- 26.Madsen EL, Hobson MA, Shi H, Varghese T, Frank GR. Stability of heterogeneous elastography phantoms made from dispersions in aqueous gels. Ultrasound Med Biol. 2006;32(2):261–270. doi: 10.1016/j.ultrasmedbio.2005.10.009. [DOI] [PMC free article] [PubMed] [Google Scholar]
- 27.Chen JF, Zagzebski JA, Madsen EL. Tests of backscatter coefficient measurement using broadband pulses. IEEE Trans Ultrason Ferroelectr Freq Control. 1993;40(5):603–607. doi: 10.1109/58.238114. [DOI] [PubMed] [Google Scholar]
- 28.Wear KA, Stiles TA, Frank GR, Madsen EL, Cheng F, Feleppa EJ, et al. Interlaboratory comparison of ultrasonic backscatter coefficient measurements from 2 to 9 MHz. J Ultrasound Med. 2005;24:1235–1250. doi: 10.7863/jum.2005.24.9.1235. [DOI] [PubMed] [Google Scholar]
- 29.Madsen EL, Zagzebski JA, MacDonald MC, Frank GR. Ultrasound focal lesion detectability phantoms. Med Phys. 1991;18:1171. doi: 10.1118/1.596589. [DOI] [PubMed] [Google Scholar]
- 30.Burlew MM, Madsen EL, Zagzebski JA, Banjavic RA, Sum SW. A new ultrasound tissue-equivalent material. Radiology. 1980;134:517. doi: 10.1148/radiology.134.2.7352242. [DOI] [PubMed] [Google Scholar]
- 31.Insana MF, Wagner RF, Brown DG, Hall TJ. Describing small-scale structure in random media using pulse-echo ultrasound. J Acoust Soc Am. 1990;87(1):79–192. doi: 10.1121/1.399283. [DOI] [PMC free article] [PubMed] [Google Scholar]
- 32.Insana MF, Hall TJ. Parametric ultrasound imaging from backscatter coefficient measurements: Image formation and interpretation. Ultrason Imaging. 1990;12:254. doi: 10.1177/016173469001200402. [DOI] [PubMed] [Google Scholar]
- 33.Nam K, Rosado-Mendez IM, Wirtzfeld LA, Pawlicki AD, Kumar V, Madsen EL, et al. Ultrasonic attenuation and backscatter coefficient estimates of rodent tumor mimicking structures: comparison of results among clinical scanners. Ultrason Imaging. 2011;33(4):233–250. doi: 10.1177/016173461103300403. [DOI] [PMC free article] [PubMed] [Google Scholar]
- 34.Wirtzfeld LA, Nam K, Labyed Y, Ghoshal G, Haak A, Sen-Gupta E, et al. Techniques and evaluation from a cross platform imaging comparison of quantitative ultrasound parameters in an In-Vivo rodent Fibroadenoma model. IEEE Trans Ultrason Ferroelectr Freq Control. 2013;60(7):1386–1400. doi: 10.1109/TUFFC.2013.2711. [DOI] [PMC free article] [PubMed] [Google Scholar]
- 35.Rosado-Mendez IM, Nam K, Hall TJ, Zagzebski JA. Task-oriented comparison of power spectral density estimation methods for quantifying acoustic attenuation in diagnostic ultrasound using reference phantom method. Ultrason imaging. 2013;35(3):214–234. doi: 10.1177/0161734613495524. [DOI] [PMC free article] [PubMed] [Google Scholar]
- 36.Yao LX, Zagzebski JA, Madsen EL. Backscatter coefficient measurements using a reference phantom to extract depth-dependent instrumentation factors. Ultrason Imaging. 1990;12:58–7. doi: 10.1177/016173469001200105. [DOI] [PubMed] [Google Scholar]
- 37.Nam K, Zagzebski JA, Hall TJ. Quantitative assessment of in vivo breast masses using ultrasound attenuation and backscatter. Ultrason Imaging. 2013;35(2):146–61. doi: 10.1177/0161734613480281. [DOI] [PMC free article] [PubMed] [Google Scholar]
- 38.Anderson JJ, Herd MT, King MR, Haak A, Hafez ZT, Song J, et al. Interlaboratory Comparison of Backscatter Coefficient Estimates for Tissue-Mimicking Phantoms. Ultrason Imaging. 2010 Jan;32(1):48–64. doi: 10.1177/016173461003200104. [DOI] [PMC free article] [PubMed] [Google Scholar]
- 39.Percival DP, Walden AT. Spectral Analysis for Physics Applications: Multitaper and conventional univariate techniques. New York, NY: Cambridge University Press; 1993. [Google Scholar]
- 40.Nam K, Rosado-Mendez IM, Rubert NC, Madsen EL, Zagzebski JA, Hall TJ. Ultrasound attenuation measurements using a reference phantom with sound speed mismatch. Ultrason Imaging. 2011;33(4):251–63. doi: 10.1177/016173461103300404. [DOI] [PMC free article] [PubMed] [Google Scholar]
- 41.Nam K, Zagzebski JA, Hall TJ. Simultaneous backscatter and attenuation estimation using al east squares method with constraints. Ultrasound Med Biol. 2011;37(12):2096–2104. doi: 10.1016/j.ultrasmedbio.2011.08.008. [DOI] [PMC free article] [PubMed] [Google Scholar]
- 42.Oelze ML, Zachary JF, O’Brien WD., Jr Characterization of tissue microstructure using ultrasonic backscatter: Theory and technique for optimization using a Gaussian form factor. J Acoust Soc Am. 2002;112(3):1202–1211. doi: 10.1121/1.1501278. [DOI] [PubMed] [Google Scholar]
- 43.Rosado-Mendez IM. Doctoral thesis. University of Wisconsin Madison; 2014. Advanced Spectral Analysis Methods for Quantification of Coherent Ultrasound Scattering: Applications in the Breast. [Google Scholar]
- 44.Raju B, Srinivasan M. High-frequency ultrasonic attenuation and backscatter coefficients of in vivo normal human dermis and subcutaneous fat. Ultrasound Med Biol. 2001;27(11):1543–1556. doi: 10.1016/s0301-5629(01)00456-2. [DOI] [PubMed] [Google Scholar]


