

Abstract
Overlap of metabolites is a major limitation in one-dimensional (1D) spectral-based single voxel MR Spectroscopy (MRS) and multivoxel-based MR spectroscopic imaging (MRSI). By combining echo-planar spectroscopic imaging (EPSI) with two-dimensional (2D) J resolved spectroscopic sequence (JPRESS), 2D spectra can be recorded in multiple locations in a single slice of prostate using four dimensional (4D) Echo-Planar J-Resolved Spectroscopic Imaging (EP-JRESI). The goal of the present work was to validate two different non-linear reconstruction methods independently using compressed sensing based 4D EP-JRESI in Prostate Cancer (PCa): Maximum Entropy (MaxEnt) and Total Variation (TV). Twenty two prostate cancer patients with a mean age of 63.8 years (range: 46–79 years) were investigated in this study. A 4D non-uniformly under-sampled (NUS) EP-JRESI sequence was implemented on the Siemens 3T MRI scanner. The NUS data was reconstructed using two non-linear reconstruction methods, namely MaxEnt and TV. Using both TV and MaxEnt reconstruction methods, following observations were made in cancer compared to non-cancerous locations: 1) higher mean (Ch+Cr)/Cit metabolite ratios. 2) Increased levels of (Ch+Cr)/Spm, (Ch+Cr)/mI and decreased levels of (Ch+Cr)/Glx. We have shown that it is possible to accelerate the 4D EP-JRESI sequence by 4X and that the data can be reliably reconstructed using the TV and MaxEnt methods. The total acquisition duration was less than 13 minutes and we were able to detect and quantify several metabolites.
Keywords: Magnetic Resonance Spectroscopy, Prostate Cancer, 4D EP-JRESI, Citrate, Myo-inositol, Glx, Echo planar spectroscopic imaging
Introduction
Prostate cancer (PCa) is the most commonly diagnosed noncutaneous malignancy in the USA and is the second-leading cause of cancer-related death in men (1). One in 6 men will be diagnosed with PCa during his lifetime but only one in 36 will die of this disease. Currently, the annual prostate specific antigen (PSA) test and digital rectal examination (DRE) are routinely performed (2) for screening. The PSA screening test measures the serum level of PSA in blood samples. However, it is a controversial test because 65–75 % of PSA screening gives false-positive results leading to over-diagnosis (3). The use of systematic transrectal biopsy can miss significant prostate cancers, because of both a random sampling error (4), and because up to a third of significant tumors lie in the anterior part of the gland, based on studies of radical prostatectomy specimens (5). Hence, there is an immediate need for early yet accurate detection of PCa to improve disease outcomes.
Proton MR Spectroscopy (1H-MRS) enables detecting a range of biochemicals in prostate by making use of the proton signals in these molecules. Detection of biochemicals in vivo is limited to concentrations of more than 0.5–1 mM. Signals of citrate (Cit), creatine (Cr), choline (Ch) and spermine (Spm) can be detected throughout the prostate, with increased levels of Ch and decreased levels of Cit being indicative of cancer (6–8).
Current limitations of single voxel based MRS and MR spectroscopic imaging (MRSI) in prostate are due to the overlap of metabolite resonances, allowing the quantification of only a few metabolites (Cit, Ch, Cr and Spm) and use of long echo times. The conventional MRSI technique can be accelerated by echo-planar spectroscopic imaging (EPSI) (9–13). The EPSI speeds up MRSI by using an echo-planar read-out of one spectral and one spatial dimension, thereby achieving an acceleration factor equal to the number of points along one of the spatial dimensions. For example, a 2D spatial matrix array (16*16) would be acquired sixteen times faster with EPSI than the conventional MRSI. However, the acceleration may be at the cost of signal to noise ratio (SNR) (14) and spectra could be affected by Nyquist ghost artifacts (15).
A single-voxel based 2D JPRESS has been evaluated in PCa, and showed improved spectral dispersion due to the added spectral dimension (16, 17). New computational methods have made compressed sensing feasible to accelerate MRI by exploiting the sparsity of the images in a known transform domain to reconstruct non-uniformly undersampled (NUS) k-space data (18). For further acceleration, application of compressed sensing for MR spectroscopic imaging is apt exploiting sparsity in multiple dimensions of frequency and space in transform domains of wavelets and total variation (19, 20). By combining EPSI with JPRESS, 2D spectra can be recorded in multiple locations in prostate using four dimensional (4D) Echo-Planar J-Resolved Spectroscopic Imaging (EP-JRESI), which combines 2 spectral with 2 spatial dimensions. A pilot feasibility was demonstrated recently to map metabolites in the healthy human prostate and brain (21, 22).
MaxEnt reconstruction finds the spectrum that maximizes the entropy while maintaining consistency with the measured data. MaxEnt reconstruction is an alternative non-linear reconstruction technique to compressed sensing. MaxEnt has been successfully used to reconstruct undersampled images in astronomy and multidimensional spectra in NMR (23–25) but has not been applied to the spatial-spectral domain (ky-t1) of 4D EP-JRESI of prostate cancer. Maximum entropy and total variation (TV) algorithms have been used to reconstruct the NUS indirect spectral and spatial dimensions (26, 21).
The TV algorithm was first proposed by Rudin et al. (27) for image denoising and since then has been successfully used for image restoration. In the TV algorithm, an objective function using the TV norm is minimized subject to a data fidelity term posed by the acquired projection data. Minimizing the image gradient essentially suppresses those high spatial frequency parts such as streaking artifacts and noise in the reconstructed images.
The goal of the present work was to validate the MaxEnt and TV non-linear reconstruction algorithm separately in PCa patients using the compressed sensing based 4D EP-JRESI data.
Materials and Methods
Patients
Between March 2012 and May 2013, twenty two PCa patients with a mean age of 63.8 years (range: 46–79 years) who subsequently underwent radical prostatectomy were selected for the study. Patients’ Gleason scores varied between 6 and 9. Prostate-specific antigen (PSA) levels varied from 0.7 to 22.8 ng/mL (mean of 6.23 ng/mL). These patients were scanned using a 3T Siemens (Siemens Medical Solution, Erlangen, Germany) MRI scanner with an endorectal “receive” coil. The protocol combining MRI and MRS was performed at least 8 weeks after the transrectal ultrasound-guided sextant biopsy. The entire protocol was approved by the Institutional Review Board, and informed consent was obtained from each patient. Prostate cancer was histopathologically confirmed after radical prostatectomy. The voxels covering the tumorous lesions from the peripheral zone (PZ) were selected and indicated as tumor voxels which is confirmed by the pathology report. After reconstruction the EP-JRESI data were overlaid onto MRI images.
MRI and MRSI
A body matrix phased-array coil assembly combined with an endorectal coil was used in the “receive” mode while a quadrature body “transmit” coil was used. All patients were imaged in supine (feet-first) position. Axial images were oriented to be perpendicular to the long axis of the prostate, which was guided by the sagittal images. Axial, coronal, and sagittal T2-weighted (T2W) turbo spin-echo images were recorded using the following parameters: repetition time/echo time (TR/TE), 3850–4200/96–101 ms; slice thickness, 3 mm; field of view, 20 × 20 cm2; echo train length (ETL), 13 and data matrix, 320 × 256.
A compressed sensing based 4D EP-JRESI sequence was validated on the 3T MRI scanner and the volume of interest (VOI) was localized using three slice-selective radio-frequency (RF) pulses (90°-180°-180°) (Fig. 1). The total time for acquiring a fully sampled 4D EP-JRESI scan (TR of 1.5s, 16ky*16kx, 64-100t1, 512t2) can be more than 25 minutes. The parameters for the EP-JRESI were: TR/TE/Avg = 1500/30ms/2, 16 phase encoding steps, 512 complex points with an F2 bandwidth of 1190Hz along the detected dimension. For the second dimension (F1), 64 increments with bandwidths of 1000Hz were used. The in plane spatial resolution and slice thickness were 1×1cm2 and 1cm, respectively. Since the EPSI readout simultaneously acquires one spatially encoded dimension (kx) and one temporal dimension (t2), we propose the use of nonuniform undersampling (NUS) in the remaining ky-t1 plane followed by CS reconstruction (MaxEnt and TV). A 4X NUS was imposed along the plane containing incremented spectral and spatial dimensions (t1 and ky). Despite the mixing of spatial and spectral dimensions in the reconstruction, the sparsity requirement for reconstruction is shown to still be satisfied, as required by CS. Since the ky t1 plane is incrementally acquired, NUS can be applied along the incrementally acquired ky-t1 plane.
Fig. 1.

Schematic diagram of the 4D EP-JRESI pulse sequence with volume of interest (VOI) localized using PRESS with three RF pulses (90°, 180°, 180°). The indirect dimension (t1) was introduced before last 180° pulse. ADC: analog to digital converter; GS, GP and GF are the gradients for slice selection, phase encoding and frequency encoding respectively; t2: detected dimension; n: number of EPI bipolar readouts.
The individual voxel volume in human prostate was 1ml. Two sets of data were collected, one water suppressed scan (WS) with a total scan time of 12 minutes and a second non-water suppressed scan (NWS) using one average and one t1 increment (30 seconds). The NWS scan was used for phase corrections (eddy current corrections). The full width half maximum (FWHM) of the water peak in the cancer and non-cancer locations were between 20–25Hz.
Data Analysis
The NUS data were reconstructed by MaxEnt and TV separately. A modified Split-Bregman algorithm (28) solves the unconstrained TV optimization problem as shown in Eqn.(1) below:
| (1) |
where ∇ is the gradient operator, m is the reconstructed data, ||x||1 is the l1-norm, λ is a regularization parameter, Fu is the under sampled Fourier transform, and y is the under-sampled data. The above equation removes the incoherent artifacts due to NUS by minimizing the total variation (TV) while maintaining consistency with the sampled measurements. The TV regularization parameters were the same as reported by Burns et al. (29). We have used the Split-Bregman reconstruction method primarily for its robustness against the regularization parameters chosen. Because of the use of Bregman parameters in the reconstruction algorithm which are calculated using the difference between the reconstruction and the sampled data at each iteration, the influence of the regularization parameters is greatly lessened compared to other algorithms that solve the TV problems. While the choice of parameters can influence the reconstruction, the algorithm allows for a wider range of possible values in order to achieve roughly the same results.
MaxEnt is a constrained convex optimization algorithm that uses a variant of the conjugate gradient method to iteratively solve the inverse problem (23, 25, 28):
| (2) |
where f is the estimated fully-sampled spectrum at each iteration, F−1 is the inverse Fourier transform, K is the NUS matrix, D is the measured time-domain data, σ is the noise standard deviation, and S1/2(f) is the spin-½ entropy of the estimated spectrum (24). As suggested by Hoch et al. (25) Co was calculated as the standard deviation of a noise free region in the data; def was calculated for data of length N as sqrt (Co/N); ker was calculated using the 2D Poisson Gap algorithm (26) to generate the stochastic sample masks used on the scanner. A detailed discussion of the calculation of ker and the 2D Poisson Gap algorithm can be found in the recent work by Burns et al. (30). All compressed sensing 4D EP-JRESI data were processed using TV and MaxEnt reconstruction with custom MATLAB software. The reconstruction time for each method took about 25 minutes using 8GB RAM, Intel Core i7-2600 CPU @ 3.40GHz 3.40 GHz. For the 2D data processing, the raw matrix was apodized with phase shifted and squared sine bell functions along t1 and t2 and zero-filled to 128 × 1024 prior to fast Fourier transformation along the two dimensions. All 2D spectra were presented as contour plots, and the 2D spectral matrices were not skewed by 45° about F1 = 0 Hz.
Statistical Analysis
Statistical analyses were performed with SPSS 21 (SPSS Inc., Chicago, IL, USA). Using logistic regression analysis, areas under the curve (AUC) of the receiver operating characteristic (ROC) were calculated for various metabolites in discriminating between MaxEnt and TV reconstruction methods. Also the paired t-test was used to determine the various metabolite ratios in cancer and non-cancer locations. A p-value less than 0.05 was considered statistically significant.
Results
Using this pilot validation, 2D peaks due to Cit, Ch, Cr, Spm, myo-inositol (mI), and glutamate plus glutamine (Glx) were quantified in cancer and non-cancer locations using the peak integration MATLAB code. Figs. 2 shows the (Ch+Cr)/Cit, (Ch+Cr)/Spm, (Ch+Cr)/mI, and (Ch+Cr)/Glx of cancerous and non-cancerous locations processed by TV and MaxEnt. The mean metabolite ratios (±standard deviations, SD) of Cit, Spm, mI and Glx of the non-cancerous locations processed using TV were: 1.158 ±0.830, 2.396 ±1.95, 5.325 ±2.42, 5.404 ±2.74. In the cancerous locations, the metabolites ratios were: 4.209 ±2.132, 2.808 ±1.77, 5.640 ±2.18, 5.275 ±2.80. Similarly the mean metabolite ratios (±SD) of Cit, Spm, mI and Glx of the non-cancerous location calculated using the MaxEnt-reconstructed data were: 1.079 ±0.795, 2.096 ±1.06, 4.967 ±2.114, 5.902 ±3.40. In the cancerous locations, the metabolite ratios were: 3.620 ±1.759, 2.727 ±1.46, 6.008 ±2.57, 5.275 ±3.19.
Fig. 2.
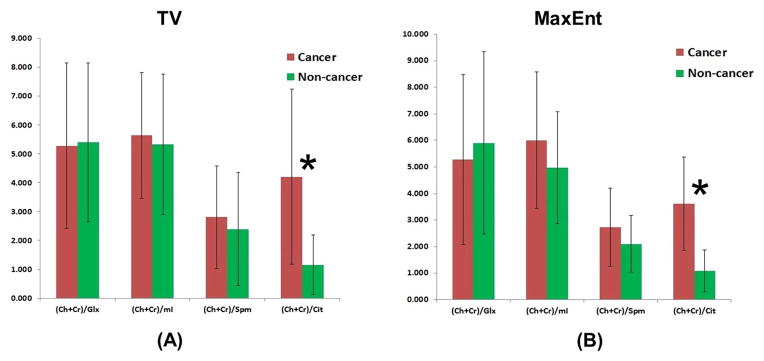
Metabolite ratios of Cit, Spm, mI and Glx in cancer and non-cancer locations processed by non-linear reconstruction methods using TV and MaxEnt.
We found that mean Cit metabolite ratios were significantly higher in cancerous locations compared to non-cancerous locations in both TV and MaxEnt reconstruction (p<0.005). Increased levels of Spm (p=0.46), mI (p=0.65) and decreased levels of Glx (p=0.88) ratios were observed in cancerous locations compared to non-cancerous locations in the TV reconstruction. Similarly in the MaxEnt reconstruction, increased levels of Spm (p=0.25), mI (p=0.15) and decreased levels of Glx (p=0.81) ratios were observed in cancerous locations compared to non-cancerous locations. None of the ratios could significantly discriminate between differing grades (Gleason scores) of PCa because of overlap of ratio values.
Fig. 3 shows spatial maps of (Ch+Cr) for the TV and MaxEnt reconstructed data acquired in a 74 year old PCa patient. The MaxEnt and TV reconstructions of cancer (B&D) and non-cancer (C&E) locations extracted from the JPRESS spectrum extracted from the 4D EP-JRESI data are shown in Fig. 4. Figure 4C illustrates the region of interest (ROI) used for the peak integration. We have compared and correlated the TV with MaxEnt reconstruction methods of Cit, Spm, mI and Glx in the cancer and non-cancer locations. The correlation of the (Ch+Cr)/Cit, (Ch+Cr)/Spm, (Ch+Cr)/mI and (Ch+Cr)/Glx ratios for the MaxEnt and TV reconstructions in the cancer locations are shown in Fig. 5. For each patient, 2 to 3 voxels were selected in the peripheral zone of the cancer and non-cancer locations and the average values for each location were reported. A positive correlation was found in the following metabolites in cancer locations: (Ch+Cr)/Cit (R2=0.85), (Ch+Cr)/Glx (R2=0.96), (Ch+Cr)/Spm (R2=0.86) and (Ch+Cr)/mI (R2=0.95). The concentration of Cit is higher in healthy prostate. Hence, if the Cit peak was higher than the Ch peak, the voxel was considered noncancerous for (Ch+Cr)/Cit values smaller than 0.5; and malignant for (Ch+Cr)/Cit) values greater than 0.5. These values were selected manually on each subject.
Fig. 3.

Spatial maps of (Ch +Cr) for TV and MaxEnt non-linear reconstruction methods of the 4D EP-JRESI data recorded in a 74 year old PCa patient. The EP-JRESI was overlaid on top of the T2 weighted MRI.
Fig. 4.

EP-JRESI voxel localization on top of the T2 weighted MRI; 2D JPRESS spectra extracted from (A) the MaxEnt and TV reconstructions of cancer (B&D) and non-cancer (C&E) locations.
Fig. 5.

Correlation of MaxEnt and TV non-linear reconstruction methods for Cit, Glx, mI and Spm in cancer locations. R2 values are shown here for each metabolite.
Results of the logistic regression analysis and consequent receiver operating characteristic (ROC) curve analyses are given in Table 1 including the sensitivity, specificity, positive predictive value (PPV), negative predictive value (NPV), area under curve (AUC), and accuracy for classifying the MaxEnt and TV methods. ROC curve analyses for differentiating the metabolite ratios of cancer and non-cancer locations in MaxEnt suggest that Cit ratio gives the best predictability with sensitivity 86.4%, specificity 90.0%, accuracy 88.6% and AUC 94.0%. Also the overall sensitivity, specificity, accuracy and AUC of mI and Spm were slightly better in MaxEnt compared to TV.
Table 1.
Measures of Sensitivity, Specificity, PPV, NPV, and Accuracy of MaxEnt and TV Method using the ROC Curve Analysis
| MaxEnt | ||||||
|---|---|---|---|---|---|---|
| Metabolites | Sensitivity % | Specificity % | Accuracy % | PPV % | NPV % | AUC % |
| Cit | 86.4 | 90.0 | 88.6 | 90.5 | 87.0 | 94.0 |
| Glx | 66.6 | 31.8 | 47.7 | 48.3 | 46.7 | 56.9 |
| mI | 54.5 | 63.6 | 59.1 | 60.0 | 58.3 | 65.1 |
| Spm | 50.0 | 72.7 | 61.4 | 64.7 | 59.3 | 64.9 |
| TV | ||||||
| Cit | 86.4 | 90.9 | 88.6 | 90.5 | 87.0 | 92.1 |
| Glx | 63.6 | 36.4 | 50.0 | 50.0 | 50.0 | 57.2 |
| mI | 40.9 | 59.1 | 50.0 | 50.0 | 50.0 | 58.5 |
| Spm | 50.0 | 63.6 | 56.8 | 57.9 | 56.0 | 58.5 |
Discussion
Using the NUS data with non-linear iterative reconstruction, we have validated the TV and MaxEnt reconstruction methods independently in PCa patients using EP-JRESI in a clinically feasible time. In addition to significantly increased Cit ratio in cancer locations, increased metabolite ratios of Spm, mI and decreased Glx were found in cancer locations compared to non-cancer locations. Even though TV and MaxEnt reconstruction methods showed comparable results in cancer and non-cancer locations, the sensitivity, accuracy and AUC were slightly increased in MaxEnt reconstruction.
In the present study, we report the ratios of (Ch+Cr)/Cit, (Ch+Cr)/Spm, (Ch+Cr)/mI and (Ch+Cr)/Glx, because of the proximity of the total Cr peak (3.0 ppm) to the total Ch peak (3.2 ppm) in these in vivo MR spectra and was not always be separable. In this study, significantly higher ratios of Cit were observed in the peripheral zone of cancer locations.
It is likely that the drop in Cit levels precedes malignant transformation (31). It has been suggested that, due to a metabolic switch, neoplastic cells would lead to Cit oxidizing, unlike normal prostatic cells that show a low Cit-oxidizing capability (32). Decreased levels of zinc, which would relieve m-aconitase from inhibition, has been proposed as one of the reasons for the decreased level of Cit in PCa (31).
Choline is an essential component of cell membrane synthesis and phospholipid metabolism and functions as an important methyl donor. Choline-containing molecules are an essential component of cell membranes, which are more highly concentrated in tumorous areas within the prostate than in healthy prostate tissue. (33,34). Choline groups are precursors and breakdown products of the phospholipid phosphatidylcholine, a major cell membrane compound (35). Increased Ch is observed due to an altered phospholipid metabolism in PCa cell lines (34). This alteration is most likely due to an increased expression and activity of choline-kinase, a higher rate of choline transport, and an increased phospholipase activity (35).
The polyamines spermine, spermidine, and putrescine are essential for the differentiation and proliferation of cells, the synthesis of DNA, RNA, and proteins, and the stabilization of cell membranes and cytoskeletal structures (36). Previous studies observed high levels of spermine in healthy prostate tissue and BPH and reduced spermine levels in malignant prostate tissue (17, 37–39).
The osmoregulator myo-inositol is expressed in a variety of tissues, and its decrease was observed in PCa within human expressed prostatic secretions (EPS) using high resolution NMR (40) and in breast tumors (41). In our study, slightly increased mI ratios were observed in cancer locations but were not statistically significant.
Glu and Gln are difficult to be resolved, owing to the overlap of resonances. As a result, most MRS studies use the sum of Glu and Gln (expressed as Glx or Glu + Gln). Glutamate is extensively involved in metabolic and oncogenic pathways. Koochekpour (42) showed that serum glutamate levels directly correlated with Gleason scores (<6 vs. >8) and primary PCa aggressiveness. In our study, decreased Glx ratios were found in the cancer locations but were not statistically significant.
There was an overlap between cancer and non-cancer locations, possibly due to the low signal-to-noise ratio of the Cr peak. Due to patient movement and B0-inhomogeneity, resonances of Ch, Cr and Spm are difficult to resolve especially in cancer locations, adding to the uncertainty in quantitation. However, using prior knowledge fitting (ProFit), may improve accurate metabolite (43) quantification, which warrants future investigation. Due to the limited patient population, we did not find any significant changes in other metabolites. Also this study focused in the peripheral zone of the prostate only where 80% of cancer occurs. The advantage of compressed sensing based 4D EP-JRESI sequence is in recording short TE-based spectra from multiple regions of human prostate and more metabolites, such as myo-inositol, spermine and Glx in addition to the normally detected citrate, creatine and choline.
The pilot work demonstrated the slice based 4D EP-JRESI and future work will focus on the volume based five dimensional (5D) EP-JRESI in the prostate cancer. The compressed sensing based 4D EP-JRESI shortens the total acquisition time effectively enabling future potentials to extend to the pathological evaluations in a clinical set up. The current validation method may need further optimization to improve the overall performance. As reported by Burns et al. (26), the sample mask is crucial to the SNR of each reconstructed prostate metabolites for the 4D EP-JRESI data. Further optimization of reduction of the non-linearity of the reconstructed peaks to make accurate quantification will be essential. In addition, future work will address the use of Poisson-gap versus deterministic sample masks, and the optimization of the modulation functions for specific metabolites relevant to PCa.
Conclusion
We were able to detect metabolites in PCa using compressed sensing based 4D EP-JRESI data acquired in clinically acceptable times (<12 minutes). We have shown that it is possible to undersample the 4D EP-JRESI sequence with an acceleration factor of 4X and that the data can be reliably reconstructed using the TV and MaxEnt methods. Both non-linear reconstruction methods provided comparable results.
Acknowledgments
This work was supported by CDMRP grant from the US Army Prostate Cancer Research Program: (#W81XWH-11-1-0248) and NIH/NCI (P50CA092131).
Abbreviations used
- PCa
prostate cancer
- PSA
prostate specific antigen
- DRE
digital rectal examination
- MaxEnt
maximum entropy
- TV
total variation
- NUS
non-uniform undersampling
- VOI
volume of interest
- ROC
receiver operating characteristic
- PPV
positive predictive value
- NPV
negative predictive value
- MRSI
magnetic resonance spectroscopic imaging
- CS
compressed sensing
- JPRESS
J-resolved spectroscopy
- Ch
choline
- Cr
creatine
- Cit
citrate
- Spm
spermine
- mI
myo-inositol
- Glu
glutamate
- Gln
glutamine
- 1D
one-dimensional
- 2D
two-dimensional
- 3D
three-dimensional
- 4D
four-dimensional
- RF
radio-frequency
- SNR
signal to noise ratio
- EPSI
echo planar spectroscopic imaging
- EP-JRESI
echo-planar J-resolved spectroscopic imaging
References
- 1.Siegel R, Naishadham D, Jemal A. Cancer statistics, 2013. CA Cancer J Clin. 2013 Jan;63(1):11–30. doi: 10.3322/caac.21166. [DOI] [PubMed] [Google Scholar]
- 2.Andriole GL, Crawford ED, Grubb RL, 3rd, Buys SS, et al. Mortality results from a randomized prostate-cancer screening trial. N Engl J Med. 2009;360:1310–1319. doi: 10.1056/NEJMoa0810696. [DOI] [PMC free article] [PubMed] [Google Scholar]
- 3.Smith DS, Humphrey PA, Catalona WJ. The early detection of prostate carcinoma with prostate specific antigen: the Washington University experience. Cancer. 1997;80:1852–1856. [PubMed] [Google Scholar]
- 4.Djavan B, Ravery V, Zlotta A, Dobronski P, Dobrovits M, Fakhari M, Seitz C, Susani M, Borkowski A, Boccon-Gibod L, Schulman CC, Marberger M. Prospective evaluation of prostate cancer detected on biopsies 1, 2, 3 and 4: when should we stop? J Urol. 2001;166:1679–1683. [PubMed] [Google Scholar]
- 5.McNeal JE, Redwine EA, Freiha FS, Stamey TA. Zonal distribution of prostatic adenocarcinoma. Correlation with histologic pattern and direction of spread. Am J Surg Pathol. 1988;12:897–906. doi: 10.1097/00000478-198812000-00001. [DOI] [PubMed] [Google Scholar]
- 6.Thomas MA, Narayan P, Kurhanewicz J, Jajodia P, Weiner MW. 1H MR spectroscopy of normal and malignant human prostates in vivo. J Magn Reson B. 1990;87:610–619. [Google Scholar]
- 7.Kurhanewicz J, Vigneron DB, Nelson SJ, Hricak H, MacDonald JM, Konety B, Narayan P. Citrate as an in vivo marker to discriminate prostate cancer from benign prostatic hyperplasia and normal prostate peripheral zone: detection via localized proton spectroscopy. Urology. 1995;45:459–466. doi: 10.1016/S0090-4295(99)80016-8. [DOI] [PubMed] [Google Scholar]
- 8.Kurhanewicz J, Vigneron DB, Hricak H, Narayan P, Carroll P, Nelson SJ. Three-dimensional H-1 MR spectroscopic imaging of the in situ human prostate with high (0.24–0.7-cm3) spatial resolution. Radiology. 1996;198:795–805. doi: 10.1148/radiology.198.3.8628874. [DOI] [PubMed] [Google Scholar]
- 9.Mansfield P. Spatial mapping of the chemical shift in NMR. Magn Reson Med. 1984;1:370–386. doi: 10.1002/mrm.1910010308. [DOI] [PubMed] [Google Scholar]
- 10.Matsui S, Sekihara K, Kohno H. High-speed spatially resolved high-resolution NMR spectroscopy. J Am Chem Soc. 1985;107:2817–2818. [Google Scholar]
- 11.Posse S, Tedeschi G, Risinger R, Ogg R, Bihan DL. High speed 1H spectroscopic imaging in human brain by echo planar spatial-spectral encoding. Magn Reson Med. 1995;33:34–40. doi: 10.1002/mrm.1910330106. [DOI] [PubMed] [Google Scholar]
- 12.Ericsson A, Weis J, Sperber GO, Hemmingsson A. Measurements of magnetic field variations in the human brain using a 3D-FT multiple gradient echo technique. Magn Reson Med. 1995;33:171–177. doi: 10.1002/mrm.1910330205. [DOI] [PubMed] [Google Scholar]
- 13.Ebel A, Soher BJ, Maudsley AA. Assessment of 3D proton MR echo-planar spectroscopic imaging using automated spectral analysis. Magn Reson Med. 2001;46:1072–1078. doi: 10.1002/mrm.1301. [DOI] [PubMed] [Google Scholar]
- 14.Posse S, Tedeschi G, Risinger R, Ogg R, Bihan DL. High Speed 1H Spectroscopic Imaging in Human Brain by Echo Planar Spatial-Spectral Encoding. Magn Reson Med. 1995;33(1):34–40. doi: 10.1002/mrm.1910330106. [DOI] [PubMed] [Google Scholar]
- 15.Du W, Du YP, Fan X, Zamora MA, Karczmar GS. Reduction of spectral ghost artifacts in high-resolution echo-planar spectroscopic imaging of water and fat resonances. Magn Reson Med. 2003;49(6):1113–1120. doi: 10.1002/mrm.10485. [DOI] [PubMed] [Google Scholar]
- 16.Ryner LN, Sorenson JA, Thomas MA. Localized 2D J-resolved 1H MR spectroscopy: strong coupling effects in vitro and in vivo. Magn Reson Imaging. 1995;13(6):853–69. doi: 10.1016/0730-725x(95)00031-b. [DOI] [PubMed] [Google Scholar]
- 17.Nagarajan R, Gomez AM, Raman SS, Margolis DJ, McClure T, Thomas MA. Correlation of endorectal 2D JPRESS findings with pathological Gleason scores in prostate cancer patients. NMR Biomed. 2010 Apr;23(3):257–61. doi: 10.1002/nbm.1446. [DOI] [PubMed] [Google Scholar]
- 18.Lustig M, Donoho D, Pauly JM. Sparse MRI: The application of compressed sensing for rapid MR imaging. Magn Reson Med. 2007 Dec;58(6):1182–95. doi: 10.1002/mrm.21391. [DOI] [PubMed] [Google Scholar]
- 19.Geethanath S, Baek HM, Ganji SK, Ding Y, Maher EA, Sims RD, Choi C, Lewis MA, Kodibagkar VD. Compressive sensing could accelerate 1H MR metabolic imaging in the clinic. Radiology. 2012 Mar;262(3):985–94. doi: 10.1148/radiol.11111098. [DOI] [PMC free article] [PubMed] [Google Scholar]
- 20.Cao P, Wu EX. Accelerating phase-encoded proton MR spectroscopic imaging by compressed sensing. J Magn Reson Imaging. 2015 Feb;41(2):487–95. doi: 10.1002/jmri.24553. [DOI] [PubMed] [Google Scholar]
- 21.Furuyama JK, Wilson NE, Burns BL, Nagarajan R, Margolis DJ, Thomas MA. Application of compressed sensing to multidimensional spectroscopic imaging in human prostate. Magn Reson Med. 2012 Jun;67(6):1499–505. doi: 10.1002/mrm.24265. [DOI] [PubMed] [Google Scholar]
- 22.Sarma MK, Nagarajan R, Macey PM. Accelerated Echo-Planar J-Resolved Spectroscopic Imaging in the Human Brain using Compressed Sensing: A Pilot Validation in Obstructive Sleep Apnea. AJNR Am J Neuroradiol. 2014 Jun;35(6 Suppl):S81–9. doi: 10.3174/ajnr.A3846. [DOI] [PMC free article] [PubMed] [Google Scholar]
- 23.Skilling J, Bryan RK. Maximum entropy image reconstruction: general algorithm. Monthly Notices R Astronom Soc. 1984;211(1):111–124. [Google Scholar]
- 24.Daniell GJ, Hore PJ. Maximum entropy and NMR–a new approach. J Magn Reson. 1989;4(3):515–536. [Google Scholar]
- 25.Hoch J, Stern AS. NMR Data Processing. Wiley; New York, NY: 1996. [Google Scholar]
- 26.Burns B, Wilson NE, Furuyama JK, Thomas MA. Non-uniformly under-sampled multi-dimensional spectroscopic imaging in vivo: maximum entropy versus compressed sensing reconstruction. NMR Biomed. 2014 Feb;27(2):191–201. doi: 10.1002/nbm.3052. [DOI] [PubMed] [Google Scholar]
- 27.Rudin L, Osher S, Fatemi E. Nonlinear total variation based noise removal algorithms. Physica D. 1992;60:259–268. [Google Scholar]
- 28.Goldstein T, Osher S. The Split Bregman Method for L1 Regularized Problems. SIAM J Imaging Sci. 2009;2:323–343. [Google Scholar]
- 29.Burns BL, Wilson NE, Thomas MA. Group Sparse Reconstruction of MultiDimensional Spectroscopic Imaging in Human Brain in vivo. Algorithms. 2014;7(3):276–294. [Google Scholar]
- 30.Burns BL. PhD Thesis. 2014. Sparse Image Reconstruction and Artifact Correction of MultiDimensional Spectroscopic Imaging Data. [Google Scholar]
- 31.Costello LC, Franklin RB. The intermediary metabolism of the prostate: a key to understanding the pathogenesis and progression of prostate malignancy. Oncology. 2000;59:269–282. doi: 10.1159/000012183. [DOI] [PMC free article] [PubMed] [Google Scholar]
- 32.Costello LC, Franklin RB, Narayan P. Citrate in the diagnosis of prostate cancer. Prostate. 1999;38:237–245. doi: 10.1002/(sici)1097-0045(19990215)38:3<237::aid-pros8>3.0.co;2-o. [DOI] [PMC free article] [PubMed] [Google Scholar]
- 33.Kurhanewicz J, Swanson MG, Nelson SJ, Vigneron DB. Combined magnetic resonance imaging and spectroscopic imaging approach to molecular imaging of prostate cancer. J Magn Reson Imaging. 2002 Oct;16(4):451–63. doi: 10.1002/jmri.10172. [DOI] [PMC free article] [PubMed] [Google Scholar]
- 34.Ackerstaff E, Pflug BR, Nelson JB, Bhujwalla ZM. Detection of increased choline compounds with proton nuclear magnetic resonance spectroscopy subsequent to malignant transformation of human prostatic epithelial cells. Cancer Res. 2001;61:3599–3603. [PubMed] [Google Scholar]
- 35.Glunde K, Bhujwalla ZM. Metabolic tumor imaging using magnetic resonance spectroscopy. Semin Oncol. 2011;38:26–41. doi: 10.1053/j.seminoncol.2010.11.001. [DOI] [PMC free article] [PubMed] [Google Scholar]
- 36.Jänne J, Pösöo H, Raina A. Polyamines in rapid growth and cancer. Biochim Biophys Acta. 1978;473:241–293. doi: 10.1016/0304-419x(78)90015-x. [DOI] [PubMed] [Google Scholar]
- 37.Van der Graaf M, Schipper RG, Oosterhof GO, Schalken JA, Verhofstad AA, Heerschap A. Proton MR spectroscopy of prostatic tissue focused on the detection of spermine, a possible biomarker of malignant behavior in prostate cancer. MAGMA. 2000;10:153–9. doi: 10.1007/BF02590640. [DOI] [PubMed] [Google Scholar]
- 38.Thomas MA, Nagarajan R, Huda A, Margolis D, Sarma MK, Sheng K, Reiter RE, Raman SS. Multidimensional MR spectroscopic imaging of prostate cancer in vivo. NMR Biomed. 2014 Jan;27(1):53–66. doi: 10.1002/nbm.2991. [DOI] [PubMed] [Google Scholar]
- 39.Yue K, Marumoto A, Binesh N, Thomas MA. 2D JPRESS of human prostates using an endorectal receiver coil. Magn Reson Med. 2002 Jun;47(6):1059–64. doi: 10.1002/mrm.10160. [DOI] [PubMed] [Google Scholar]
- 40.Serkova NJ, Gamito EJ, Jones RH, O’Donnell C, Brown JL, Green S, Sullivan H, Hedlund T, Crawford ED. The metabolites citrate, myo-inositol, and spermine are potential age-independent markers of prostate cancer in human expressed prostatic secretions. Prostate. 2008 May 1;68(6):620–8. doi: 10.1002/pros.20727. [DOI] [PubMed] [Google Scholar]
- 41.Griffin JL, Shockcor JP. Metabolic profiles of cancer cells. Nat Rev Cancer. 2004;4:551–561. doi: 10.1038/nrc1390. [DOI] [PubMed] [Google Scholar]
- 42.Koochekpour S. Glutamate, a metabolic biomarker of aggressiveness and potential therapeutic target for prostate cancer. Asian J Androl. 2013 Mar;15(2):212–3. doi: 10.1038/aja.2012.145. [DOI] [PMC free article] [PubMed] [Google Scholar]
- 43.Lange T, Schulte RF, Boesiger P. Quantitative J-resolved prostate spectroscopy using two-dimensional prior-knowledge fitting. Magn Reson Med. 2008 May;59(5):966–72. doi: 10.1002/mrm.21438. [DOI] [PubMed] [Google Scholar]