

Abstract
Nanoparticle (NP)-based combination chemotherapy has been proposed as an effective strategy for achieving synergistic effects and targeted drug delivery for colon cancer therapy. Here, we fabricated a series of hyaluronic acid (HA)-functionalized camptothecin (CPT)/curcumin (CUR)-loaded polymeric NPs (HA-CPT/CUR-NPs) with various weight ratios of CPT to CUR (1:1, 2:1 and 4:1). The resultant spherical HA-CPT/CUR-NPs had a desirable particle size (around 289 nm), relative narrow size distribution, and slightly negative zeta potential. These NPs exhibited a simultaneous sustained release profile for both drugs throughout the time frame examined. Subsequent cellular uptake experiments demonstrated that the introduction of HA to the NP surface endowed NPs with colon cancer-targeting capability and markedly increased cellular uptake efficiency compared with chitosan-coated NPs. Importantly, the combined delivery of CPT and CUR in one HA-functionalized NP exerted strong synergistic effects. HA-CPT/CUR-NP (1:1) showed the highest antitumor activity among the three HA-CPT/CUR-NPs, resulting in an extremely low combination index. Collectively, our findings indicate that this HA-CPT/CUR-NP can be exploited as an efficient formulation for colon cancer-targeted combination chemotherapy.
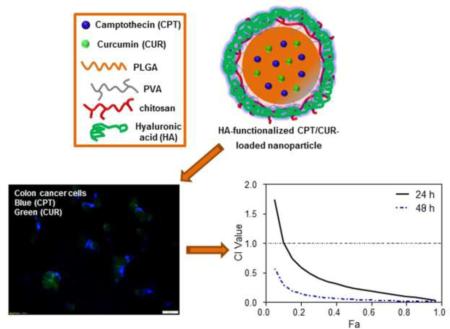
Graphical abstract
Camptothecin and curcumin have been co-loaded into hyaluronic acid-functionalized polymeric nanoparticles (NPs). The resultant NPs exhibited obvious colon cancer-targeted drug delivery capability and strong synergistic effects against colon cancer cells.
1. Introduction
Colon cancer, the third-most common malignant tumor, is associated with high morbidity and mortality, accounting for over 1.4 million new cases and approximately half a million deaths worldwide each year [1, 2]. Currently, chemotherapy is the most effective strategy for treating colon cancer [3]. Colon cancer is a complex disease involving various cellular pathways, and its progression is marked by numerous successive gene mutations [4]. Therefore, it is unlikely that a ‘magic bullet’ capable of achieving tumor recession by blocking a single pathway can be found. To address this problem, researchers have proposed multiple drug-based combination chemotherapy, targeting different cellular pathways, as a promising alternative strategy. This approach offers several advantages, including reducing drug dose and adverse effects and increasing therapeutic efficacy [5, 6]. Clinically, combination chemotherapy results in a better response and improved survival compared with single-agent therapy, and thus has been adopted as a standard regimen.
To date, different types of natural antitumor drugs have been widely used for chemotherapy. Camptothecin (CPT), a hydrophobic natural alkaloid extracted from Camptotheca acuminate, exhibits a broad spectrum of antitumor activity against various cancers, including colon cancer, small-cell lung carcinoma, and breast cancer [7]. In principle, CPT converts topoisomerase I into a cellular poison by inhibiting the progression of the replication fork, resulting in cell death [8, 9]. Although CPT has been demonstrated to possess impressive preclinical antitumor activities, its further clinical application has been seriously restricted by limited efficacy and dose-limiting toxicity. Therefore, CPT is often utilized in combination with other drugs [10-12]. Similarly, curcumin (CUR), another type of natural antitumor drug derived from herbal sources, has a number of therapeutic properties, including antioxidant, anti-inflammatory, and antitumor activities [13, 14]. CUR is relatively safe for humans, even when given at a high dose (12 g/day) for 3 months [15]. CUR has also demonstrated considerable potential in inhibiting various cellular pathways associated with tumor survival and progression [16]. In addition, CUR has the capacity to suppress chemoresistance by sensitizing cancer cells to conventional chemotherapeutic agents [17]. Accordingly, synergistic effects of CUR and various anticancer agents have been previously explored. Scarano et al. demonstrated synergistic effects of CUR and platinum against ovarian cancer cells, with a combination index (CI) ranging from 0.4 to 0.8 [13]. Ganta et al. also confirmed that the combination of CUR and paclitaxel was very effectively in promoting apoptotic responses and enhancing cytotoxicity in cancer cells [18]. Hence, considering the diverse antitumor mechanisms of CPT and CUR, their combination is predicted to offer a viable therapeutic option for colon cancer therapy.
It has been reported that the ratio of administered drugs, which determines the degree of synergy or antagonism, is highly relevant to the clinical outcome of combination chemotherapy [19]. Additionally, chemotherapeutic agents have different cellular uptake profiles, pharmacokinetics and systemic distributions, which can complicate dosing and administration [10, 20, 21]. Ideally, these issues could be overcome by simultaneously delivering multiple therapeutic agents using a nanocarrier system [22]. To date, various nanocarriers have been explored for combination chemotherapy, including liposomes, dendrimers, micelles, and nanoparticles (NPs) [23-25]. Of these, polymeric NPs have been the most widely used platform owing to their high stability, high drug encapsulation efficiency, controlled drug-release profiles, and availability of surface functional groups for ligand conjugation or coating [26]. Nevertheless, broader application of these NP-based approaches is seriously stymied by a lack of target specificity, which prevents accumulation of sufficient chemotherapeutic drugs in the tumor.
Tumor-targeted delivery of NPs can be achieved through passive or active targeting. Some reports demonstrate that NPs are likely to passively reach tumor tissues via the enhanced permeability and retention effect, which increases the local drug concentration and enhances antitumor effects [27]. Effective strategies for active targeting, which are expected to further improve selective drug accumulation at tumor sites and reduce adverse effects, are eagerly awaited. It is anticipated that interactions between targeting moieties and specific receptors at tumor sites can improve bio-adhesion of NPs to specific cells and further increase the extent of endocytosis via receptor-mediated internalization [28]. CD44, a single-chain glycoprotein with a molecular mass ranging from 80 to 250 kDa, has been reported to be over-expressed in a variety of cancers, including breast cancer, ovarian cancer, and colon cancer [29-31]. Recently, hyaluronic acid (HA), a linear glycosaminoglycan consisting of alternating ?-glucuronic acid and N-acetyl-?-glucosamine units, has been highlighted as a tumor-targeting moiety by virtue of its high affinity for the CD44 receptor [32]. In addition to this targeting function, HA-functionalized NPs can enter cells more efficiently through an HA receptor-mediated endocytosis pathway [33]. Exploiting the specific affinity of HA for CD44 is thus an attractive strategy for targeted cancer treatments. Poly(lactic acid/glycolic acid) (PLGA), a FDA-approved biodegradable copolymer, can efficiently encapsulate hydrophobic drugs to form NPs, and thus has been widely used in drug delivery by our group and others [27, 34, 35]. To our knowledge, little effort has been made to develop HA-functionalized PLGA NPs for CPT and CUR co-delivery. Thus, in the present study, we fabricated HA-functionalized CPT/CUR-loaded polymeric NPs (HA-CPT/CUR-NPs), as depicted in Scheme 1. We further characterized their physicochemical properties (e.g., hydrodynamic particle size, zeta potential and drug loading, as well as encapsulation efficiency) and colon cancer-targeted delivery profiles. In addition, we investigated in vitro cytotoxicity and synergistic effects of co-delivered CPT and CUR.
Scheme 1.

Schematic illustration of the fabrication process of HA-CPT/CUR-NPs, colon cancer cell-targeted drug delivery, and the release of CPT and CUR into the cytoplasm or nucleus.
2. Materials and Methods
2.1 Materials
PLGA (Mw = 38–54 kg/mol), poly(vinyl alcohol) (PVA, 86-89% hydrolyzed, low molecular weight), chitosan, sodium nitrite, CPT, CUR, accutase, Triton X-100 and azoxymethane (AOM) were purchased from Sigma-Aldrich (St. Louis, MO, USA). Molecular weight of chitosan was tailored by depolymerization using sodium nitrite following a reported method [36]. Viscosity-average molecular weight of the resulting chitosan was determined as 1.8×10⁴ using a reported method [37]. The depolymerized chitosan was used in the NPs fabrication process. HA was obtained from Lifecore Biomedical, LLC (Chaska, MN, USA). Paraformaldehyde stock solution (16%) was from Electron Microscopy Science (Hatfield, PA, USA). 3-(4,5-Dimethylthiazol-2-yl)-2,5-Diphenyl Tetrazolium Bromide assay (MTT) was supplied from Invitrogen (Eugene, OR, USA). All commercial products were used without further purification.
2.2 Fabrication of HA-CPT/CUR-NPs
NPs were prepared by a modified oil-in-water (O/W) emulsion-solvent evaporation technique. Briefly, 100 mg of PLGA and, optionally, various amounts of CPT and/or CUR (total 6 mg) were co-dissolved in 2 mL of dichloromethane (DCM)-methanol co-solvent (8:2). The resulting organic solution was added drop-wise to 4 mL PVA solutions (5%) with or without depolymerized chitosan (0.5%). Subsequently, the mixture was sonicated six times (10 s each time) at 50% amplitude in an ice bath using a Sonifier 450 (Branson Sonic Power, Danbury, CT, USA). This emulsion was immediately poured into 100 mL of aqueous solution containing 0.3% PVA with or without 0.03% depolymerized chitosan. After that, the organic solvent was evaporated under low vacuum conditions (Rotary evaporator, Yamato RE200, Santa Clara, CA, USA). The NPs formed by this method were collected by centrifugation at 12,000 g for 20 min, washed three times with deionized water, dried in a lyophilizer, and stored at −20 °C in airtight container.
As to fabrication of HA-functionalized NPs, 1 mL of chitosan-coated NPs in acetic buffer (pH = 6.0) was added to an equal volume of a HA solution with the concentration of 5, 10 or 20 mg/mL under vortex for 15 min. The corresponding HA-functionalized CPT-loaded NPs were named as HA-CPT-NPs-(I) (I = A, B and C), and the HA concentration (5, 10 or 20 mg/mL) were denoted by the capital letters in bracketed text. The resultant HA-functionalized CPT/CUR-loaded NPs were named HA-CPT/CUR-NPs (i) (i = 1:1, 2:1 and 4:1), and the feeding weight ratio of CPT/CUR were denoted by the numbers in bracketed text.
2.3 Characterization of NPs
Particle sizes (nm) and zeta potential (mV) of NPs were measured by dynamic light scattering (DLS) using 90 Plus/BI-MAS (Multi-angle particle sizing) or DLS after applying an electric field using a ZetaPlus (Zeta potential analyzer, Brookhaven Instruments Corporation). The average and standard deviations of the diameters (nm) or zeta potential (mV) were calculated using 3 runs. Each run is an average of 10 measurements.
The morphology of NPs was observed with a transmission electron microscope (TEM, LEO 906E, Zeiss, Germany). A drop of dilute NPs suspension was mounted onto 400-mesh carbon-coated copper grids and dried before analysis.
The UV-vis absorption intensity of CUR was measured at 435 nm on a Shimadzu UV-1700 UV/Vis spectrophotometer. Fluorescence spectra of CPT were measured at 435 nm emission wavelength (360 nm excitation wavelength) on a Shimadzu RF-5301 PC spectrofluorometer. The amount of CPT and CUR encapsulated in NPs was determined by measuring the intrinsic fluorescence of CPT and adsorption of CUR, respectively. Quartz cuvettes were used in all UV and fluorescent studies. In a typical example, NPs (3 mg) were dissolved in 1 mL of dimethyl sulfoxide (DMSO). Then the solution was diluted and transferred to quartz cuvette for measurement.
XRD spectra were examined using a Cu Ka-ray with tube conditions of 40 kV and 30 mA ranging from 10° to 50° (XRD-7000, Shimadzu, Japan).
2.4 Release profiles of CPT and CUR from NPs
The release behaviours of CPT and CUR from HA-CPT/CUR-NPs (1:1) were conducted by the dialysis method. Briefly, NPs were dispersed in PBS to form a suspension (equal to 250 μg of drug). The suspension was transferred into a regenerated Cellulose Dialysis tube (molecular weight cut-off = 10,000 Da) and the sample-filled tube was closed tightly at both ends to keep each tube surface area equivalent. The closed bag was subsequently put into a centrifuge tube, and immersed in 20 mL PBS release medium containing 0.5% Tween-80. Tween-80 was employed in PBS to maintain the solubility of drugs in aqueous phase. The tube was put in a water bath shaking at 100 rpm at 37 °C. At appropriate time points, outer solution was taken for measurement and fresh release medium was added. The amount of CPT and CUR in the outer solution was measured according to the method described in Section 2.3. All of the operations were carried out in triplicate.
2.5 Intracellular NPs uptake visualization
Colon-26 cells were seeded in eight-chamber tissue culture glass slide (BD Falcon, Bedford, MA, USA) at a density of 5.0×10⁴ cells/well and incubated overnight. The culture medium was exchanged to serum-free medium containing HA-CPT/CUR-NPs (1:1). The total drug concentration in the medium is set as 50 and 100 μM, respectively. After 3 h of co-culture, the cells were thoroughly rinsed with PBS for 3 times to eliminate excess of NPs, and then fixed in 4% paraformaldehyde for 15 min. Images were acquired using an Olympus equipped with a Hamamatsu Digital Camera ORCA-03G.
2.6 Quantification of cellular uptake using flow cytometry (FCM)
Colon-26 cells were seeded in 6-well plates at a density of 3×10⁵ cells/well and incubated overnight. The medium was exchanged to serum-free medium containing free CPT or various NPs (equal to 50 μM drug). Cells without treatment were used as negative controls. After 1.5 or 3 h of co-incubation, the cells were thoroughly rinsed with PBS to eliminate excess of NPs, which were not taken up by cells. Subsequently, the treated cells were harvested using accutase, transferred to centrifuge tubes, and centrifuged at 1,500 rpm for 5 min. Upon removal of the supernatant, the cells were re-suspended in 0.5 mL of FCM buffer, transferred to round-bottom polystyrene test tubes (BD Falcon, 12 × 75 mm), and kept at 4 °C until analysis. Analytical FCM was performed using the DAPI channel (CPT) and/or FITC channel (CUR) on the FCM Canto™ (BD Biosciences, San Jose, CA, USA). A total of 5,000 ungated cells were analyzed.
The competition assay was carried out to confirm the cellular uptake of HA-functionalized NPs. The uptake efficiency of Colon-26 cells with these NPs in the presence of free HA (5 mg/mL) as a competitor was tested by FCM.
2.7 Targeting properties ex vivo
C57BL/6 male mice (10 weeks of age, The Jackson Laboratory) were used in the animal experiments. Mice were group housed (25 °C), photoperiod (12:12-h light-dark cycle), and allowed unrestricted access to potables and standard mouse chow. All the animal experiments were approved by Georgia State University Institutional Animal Care and Use Committee. Colon cancer was induced as described in our previous report [38], with some modifications. Mice were IP injected with AOM (10 mg/kg body weight) and maintained on regular diet and water for 5 days. Mice were then subjected to three cycles of DSS treatment, in which each cycle consisted of 1.5% DSS for 7 days followed by a 14-day recovery period with regular water. Normal colon tissues or colon cancer tissues (6−8 mm) from healthy control or AOM/DSS-treated mice were placed in 24-well culture plates with the mucosal surface facing upwards. The wells were flooded in serum-free RPMI-1640 medium, and then HA-CUR-NPs suspensions (CUR, 100 μM) were added to each well. After 5 h of co-incubation, tissues were washed thoroughly with PBS for 3 times, and then embedded in OCT. Sections (5 μm) were fixed in 4% paraformaldehyde and further stained with DAPI. Images were acquired using an Olympus equipped with a Hamamatsu Digital Camera ORCA-03G.
2.8 MTT assay and synergy analysis
For MTT test, Colon-26 cells were seeded at a density of 2×10⁴ cells/well in 96-well plates and incubated overnight. The cells were incubated in the RPMI 1640 medium containing various amounts of drug (0 – 64 μM) for 24 h and 48 h, respectively. At the end of the incubation period, NPs-containing medium was removed and the cells were thoroughly rinsed twice with PBS. Cells were then incubated with MTT (0.5 mg/mL) at 37 °C for 4 h. Thereafter, the media were discarded and 50 μL DMSO was added to each well prior to spectrophotometric measurements at 570 nm. Untreated cells were used as negative references, whereas cells were treated with 0.5% Triton X-100 as positive controls.
CalcuSyn software 1.0 (Biosoft, Cambridge, UK) was used to calculate the CI value. The CI values were determined at the half maximal (50%) toxicity concentration (IC50). The interaction between treatment modalities was calculated by using the median-effect equation and CI analysis. Fa is the fraction of cells affected upon drug treatment. The occurrence of ratio-dependent synergy was determined by plotting the CI value (CI < 1, synergy; CI ~ 1, additivity; and CI > 1, antagonism) versus Fa.
2.9 Electrical impedance sensing (ECIS) technology
Cell-attachment assays were performed to investigate the real-time cytotoxicity of NPs using ECIS technology (Applied BioPhysics, Troy, NY, USA). The ECIS model 1600R was used for these experiments. The measurement system consists of an 8-well culture dish (ECIS 8W1E plate), the surface of which is seeded with Caco2-BBE cells at a density of 1×10⁶/well. Once cells reached confluence, various NPs were added to the wells and the drug concentration in the medium is set as 25 μM. Untreated cells were used as negative references, whereas cells were treated with 0.5% Triton X-100 as positive controls. Basal resistance measurements were performed using the ideal frequency for Caco2-BBE cells, 500 Hz, and a voltage of 1 V.
2.10 Statistical analysis
Statistical analysis was performed using Student's t-test. Data were expressed as mean ± standard error of mean (S.E.M.). Statistical significance was represented by *P<0.05 and **P<0.01.
3. Results and discussion
3.1 Fabrication of NPs
We fabricated various NPs using the emulsion-solvent evaporation method, a well-established technique for preparing active-substance–loaded NPs [39]. Theoretically, rapid addition of the organic phase (PLGA; optionally CPT/CUR) to the aqueous phase together with an emulsifier with sonication leads to the immediate formation of an oil/water emulsion based on the Gibbs-Marangoni effect and a capillary break-up mechanism [40]. Upon evaporation of organic solvents (DCM and methanol) under reduced pressure, CPT/CUR molecules are transferred to the PLGA hydrophobic core through the “like dissolves like” principle, and further solidify to form condensed NPs [41].
Emulsifiers presented at the interface serve to separate the oil phase and water phase, and are necessary to prevent aggregation of NPs [42]. PVA, an amphiphilic copolymer, is extensively utilized as an emulsifier for the fabrication of polyester NPs [43]. During NP formation, the hydrophobic segments of PVA penetrate into the organic phase and remain entrapped in the polymeric matrix of the NPs. In contrast, their hydrophilic segments surround NPs and stabilize them through steric hindrance. Chitosan, a natural, linear, cationic polymer, has long been used for surface modification of polyester NPs [44, 45]. This action of chitosan coating could be attributable to the effects of chain entanglement with PVA. Alternatively, it may reflect adsorption of positively charged chitosan to the negatively charged NP surface. After 15 min of further incubation with negatively charged HA polymer, chitosan-coated cationic NPs are further functionalized with HA through an electrostatically driven, layer-by-layer assembly process.
3.2 Physicochemical characterization of NPs
Particle size and zeta potential are critical parameters because they directly impact the stability, cellular uptake, and bio-distribution of NPs [40]. As shown in Fig. 1a, DLS measurements revealed that the average hydrodynamic diameter of chitosan-coated NPs was in the range of 221 to 264 nm. With the further introduction of HA to the surface, the particle size of all NPs clearly increased. Fig. 1b shows that chitosan-coated NPs were electropositive, whereas all HA-functionalized NPs had a negative zeta potential ranging from −10 to −20 mV, indicating the attachment of negatively charged HA to the surface of NPs.
Figure 1.

Particle size (a) and zeta potential (b) of various NPs. Data are presented as means ± S.E.M. (n = 3). Representative TEM images of chitosan-coated CPT/CUR-NPs (c) and HA-CPT/CUR-NPs (d). The inset highlights the TEM of an individual NP.
The morphology of NPs was evaluated by TEM. Representative TEM images showed that chitosan-coated CPT/CUR-NPs (Fig. 1c) and HA-CPT/CUR-NPs (Fig. 1d) are spherical in shape with mean diameters of approximately 93 and 122 nm, respectively. The modest deviation in diameter measured by TEM and DLS was ascribed to differences in the surface states of the NPs under the test conditions used, as was also described in our previous studies [46]. Specifically, NPs are in a fully hydrated (swollen) state when examined by DLS. In contrast, they must be strictly dehydrated for TEM characterization. It has been proposed that most cells preferentially internalize NPs that are smaller than 400 nm in diameter [47-49]. On the other hand, efficient endocytosis requires that NPs be large enough to prevent their rapid leakage into capillary blood vessels and to escape capture by macrophages lodged in the reticuloendothelial system. The size of NPs was thus regulated in such a way that the mean size of NPs was larger than 100 nm, but smaller than 400 nm. Therefore, the properties of the HA-CPT/CUR-NPs described above would be considered favorable for internalization into targeted cells.
Among various NPs, drug-loading capacity ranged from 2.1% to 5.1%, and the corresponding encapsulation efficiencies depended on the drug type and the number of drug types used in the fabrication process, with single drug-loaded NPs exhibiting high encapsulation efficiency, and dual drug-loaded NPs showing markedly decreased encapsulation efficiencies.
To evaluate interactions between drugs and the carrier matrix, we investigated the corresponding XRD patterns. As shown in Fig. 2, the representative XRD diffractograms of CPT and CUR exhibited numerous sharp and intense peaks at various 2θ scattering angles, reflecting their highly crystalline nature. Compared to CPT and CUR XRDs, the X-ray patterns of HA-CPT/CUR-NP (1:1) exhibited a complete absence of such characteristic peaks, possibly suggesting the formation of an amorphous complex through intermolecular interactions between CPT/CUR and matrix polymers. Thus, our results clearly indicate that the drugs were molecularly dispersed within the polymers, a result in good agreement with a previously published report [19].
Figure 2.

XRD patterns of free CPT (a), free CUR (b), and HA-CPT/CUR-NP (1:1) (c).
3.3 In vitro drug-release profile
Controlled release of CPT and CUR from NPs is an important prerequisite for colon cancer therapy. In vitro release profiles for drugs loaded in HA-CPT/CUR-NP (1:1) as a function of time are shown in Fig. 3. Compared with the release behavior of CPT, the release rate of CUR was slower, a difference that is attributable to differences in their hydrophobicity. Specifically, CPT is more water-soluble and thus more easily diffuses into solution from the polymer matrix compared with CUR, thereby exhibiting a faster release rate. We also found that CPT and CUR were released simultaneously, with a slight initial rapid release followed by a relatively slower release phase. As previously reported, drug release from PLGA NPs reflects the combined effects of swelling, diffusion, erosion, and degradation processes [50]. Accordingly, the initial burst release might be attributable to the diffusion of drugs presented at the surface of NPs. Subsequent migration of drugs from the core to the surface of the polymeric matrix results in a more moderate, sustained release behavior.
Figure 3.

In vitro cumulative release of CPT and CUR from HA-CPT/CUR-NP (1:1) in PBS containing 0.5% Tween-80 at 37 °C. Data are presented as means ± S.E.M. (n = 3).
3.4 Intracellular uptake
Efficient cellular uptake is a major requirement for the therapeutic efficacy of NPs [51]. Here, taking advantage of the intrinsic fluorescence properties of CPT and CUR, we investigated the intracellular delivery of both drugs into cancer cells. Colon-26 cells were treated for 3 hours with HA-CPT/CUR-NP (1:1) containing different drug concentrations (0, 50 and 100 μM). As expected, untreated control cells showed no fluorescence (data not shown). However, clear drug accumulation was detected in Colon-26 cells after treatment with NPs, as shown in Fig. 4. Furthermore, a weak CPT and CUR fluorescence signal was detected at a total drug concentration of 50 μM, but a much stronger signal was observed at a concentration of 100 μM. In addition, the presence of both CPT fluorescence and CUR fluorescence in individual cells demonstrated the colocalization of both drugs in Colon-26 cells.
Figure 4.

Cellular colocalization studies of HA-CPT/CUR-NP (1:1) in Colon-26 cells after treatment with drug concentrations of 50 or 100 μM for 3 hours. Fluorescence images show the colocalization of CPT and CUR in the cellular compartment of Colon-26 cells. Scale bar = 10 μm.
To further quantitatively compare the cellular uptake of different NPs, we treated Colon-26 cells with various HA-functionalized CPT-loaded NPs containing a constant amount of CPT (50 μM), and investigated their cellular-uptake profiles after 1.5 or 3 hours of co-incubation. The fluorescence emission intensities of Colon-26 cells treated with CPT-loaded NPs are presented in Fig. 5. Notably, after 1.5 hours of co-incubation, the fluorescence intensity of Colon-26 cells incubated with HA-CPT-NP (B) was 4.6-, 2.6- and 2.1-fold higher than that in cells incubated with CPT-NP, HA-CPT-NP (A) and HA-CPT-NP (C), respectively. This indicates that surface modification with HA endows NPs with enhanced cellular uptake ability, and this increased cellular uptake is dependent on HA concentration. These results are consistent with previous reports [52, 53]. After 3 hours of co-incubation with Colon-26 cells, HA-CPT-NP (B) and HA-CPT-NP (C) exhibited the highest internalization efficiency among tested NPs. Based on these results, we selected an HA concentration of 10 mg/mL, used to prepare HA-CPT-NP (B), for fabrication of all the HA-CUR-NPs and HA-CPT/CUR-NPs. In addition, we also incubated Colon-26 cells with empty NPs or HA-CPT/CUR-NPs (1:1) for 3 hours, and investigated the drug fluorescence in cells using FCM. As can be seen in ESI Fig. 1, CPT and CUR signals were simultaneously present in NPs-treated cells obviously, which further confirms the colocalization of both drugs in the same cells. This result is consistent with the data in Fig. 4.
Figure 5.

Quantification of cellular uptake of various NPs by Colon-26 cells. (a) Representative flow cytometry histograms of fluorescence intensity for cells treated with various NPs (50 μM CPT) for 3 hours. (b) Percentage of CPT-containing Colon-26 cells after treatment with various NPs (50 μM CPT) for 1.5 or 3 hours. Each point represents the mean ± S.E.M. (n = 3; *P < 0.05 and **P < 0.01, Student’s t-test). (c) Tissue uptake profiles of HA-CUR-NPs after co-incubating for 5 h with normal colon tissue or colon cancer tissue (red frame indicates colon tumour areas). Tissues were treated with NPs (CUR, 100 μM) and processed for fluorescence staining. Fixed cells were stained with DAPI for visualization of nuclei (purple). Scale bar represents 50 μm.
To confirm the HA receptor-mediated cellular uptake of HA-functionalized NPs, we also examined the cellular uptake efficiency of HA-CPT-NP (B) by Colon-26 cells in the presence of free HA, a competitor of the HA groups in HA-CPT-NP (B). As shown in Fig. 5b, the cellular uptake of HA-CPT-NP (B) decreased substantially in the presence of free HA, suggesting that the uptake of HA-functionalized NPs reflects HA receptor-mediated endocytosis.
3.5 Targeting properties ex vivo
Since our HA-NPs showed a considerable ability to target colon cancer cells in vitro, we next investigated their targeting properties in ex vivo using the AOM/DSS-induced colon cancer mouse model. Tissues from healthy control and AOM/DSS-treated mice were treated with HA-CUR-NPs and examined for CUR fluorescence. As shown in Fig. 5c, very few HA-CUR-NPs were retained in normal colon tissue surface after 5 h of co-incubation. However, co-incubation of NPs with colon cancer tissues revealed that large amounts of NPs efficiently penetrated into colon tumor areas and accumulated therein. Furthermore, HA-CUR-NPs also showed a substantially less accumulation in the tumor adjacent tissues. These results obviously indicated that HA-functionalized NPs could facilitate permeation and enrichment of NPs in colon cancer tissue.
3.6 In vitro cytotoxicity and synergistic effects
To confirm the synergistic effects of CPT and CUR loaded in NPs, we evaluated the in vitro cytotoxicity of various NPs using MTT assays. First, a test of blank HA-functionalized NPs showed no appreciable cytotoxicity throughout the entire range of concentrations. Cell viability remained greater than 85% after a 48-hour exposure, indicating that these NPs were biocompatible and well tolerated (ESI Fig. 2). In contrast, blank chitosan-coated NPs showed slight cytotoxicity compared with blank HA-functionalized NPs, an effect that could be attributable to cell membrane disruption caused by the cationic chitosan on the NP surface [54]. For blank HA-functionalized NPs, further coating of the outer surface of the chitosan layer with HA protected against destruction of plasma membrane, thereby reducing cytotoxicity.
Fig. 6 shows that the antitumor effects of all NPs were concentration-dependent. The enhanced cytotoxicity of HA-functionalized NPs compared to chitosan-coated NPs may reflect the enhanced intracellular uptake by a rapid, CD44 receptor-mediated endocytosis process. These results are consistent with FCM-based in vitro cellular-uptake studies. As shown in Table 2, IC50 of HA-CPT-NP (B) toward Colon-26 cells was 0.7 μM at both 24 and 48 hours. This value is much lower than those obtained for other single drug-loaded NPs at the corresponding times, indicating that CPT has a stronger cancer cell-killing effect than CUR and that HA-CPT-NP (B) exerts the highest antitumor activities among the four single drug-loaded NPs.
Figure 6.
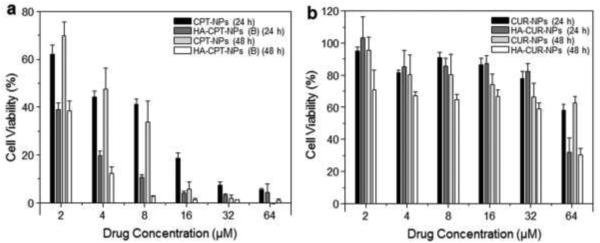
In vitro cytotoxicity of chitosan-coated NPs and HA-functionalized NPs against Colon-26 cells, determined by MTT assays. Cytotoxicity of CPT-loaded NPs (a) and CUR-loaded NPs (b) at different concentrations against Colon-26 cells after co-incubation for 24 or 48 hours. Triton X-100 (0.5%) was used as a positive control to produce a maximum cell death rate (100%), whereas cell culture medium was used as a negative control (death rate de?ned as 0%). Cytotoxicity is given as the percentage of viable cells remaining after treatment. Each point represents the mean ± S.E.M. (n = 5).
Table 2.
IC50 (μM, total drug concentration) of nanoparticles against Colon-26 cells line.
| Incubation time | CPT-NPs | HA-CPT-NPs (B) | CUR-NPs | HA-CUR-NPs | HA-CPT/CUR-NPs (1:1) | HA-CPT/CUR-NPs (2:1) | HA-CPT/CUR-NPs (4:1) |
|---|---|---|---|---|---|---|---|
| 24 h | 3.6 | 0.7 | 201.4 | 44.7 | 0.3 | 2.1 | 0.4 |
| 48 h | 3.8 | 0.7 | 97.4 | 32.0 | 0.1 | 2.1 | 1.5 |
The synergistic effect of multiple drugs depends largely on drug concentrations, combination ratios, and treatment time. Therefore, we analyzed the effects of drug combinations at different total drug concentrations, drug weight ratios, and treatment times. The total drug concentrations were calculated according to the drug loading results in Table 1. As shown in Fig. 7, HA-CPT/CUR-NP (1:1), with a drug weight ratio of 1:1, showed a clear synergic effect after incubation with cells for 24 and 48 hours. In contrast, HA-CPT/CUR-NP (2:1) and HA-CPT/CUR-NP (4:1) exhibited strong antagonism in Colon-26 cells. The strong synergy of HA-CPT/CUR-NP (1:1) was further reflected in the extremely low CI value. Importantly, we also found that the IC50 of HA-CPT/CUR-NP (1:1) was 2.3- and 7-times lower than that obtained for HA-CPT-NP (B) at 24 and 48 hours, respectively, further demonstrating the strong synergetic effect of CPT/CUR encapsulated in HA-functionalized NPs with a weight ratio of 1:1 (Table 2). Since HA-CPT/CUR-NP (1:1) displayed very pronounced synergistic cytotoxicity, it was selected for further studies.
Table 1.
Characteristics of the CPT/CUR-loaded nanoparticles (mean ± S.D.; n=3).
| Nanoparticles | Drug Loading (%) | Encapsulation Efficiency (%) | ||
|---|---|---|---|---|
| CPT | CUR | CPT | CUR | |
| CPT-NPs | 5.1 ± 0.3 | – | 86.0 ± 3.2 | – |
| CUR-NPs | – | 2.9 ± 0.2 | – | 48.8 ± 2.0 |
| CPT/CUR-NPs (1:1) | 1.2 ± 0.2 | 0.9 ± 0.1 | 38.0 ± 4.1 | 35.7 ± 1.1 |
| CPT/CUR-NPs (2:1) | 1.8 ± 0.2 | 0.8 ± 0.2 | 48.7 ± 3.2 | 44.8 ± 4.5 |
| CPT/CUR-NPs (4:1) | 2.8 ± 0.3 | 0.5 ± 0.1 | 51.3 ± 4.8 | 39.5 ± 3.8 |
Figure 7.

In vitro cytotoxicity of HA-CPT/CUR-NP (1:1) (a), HA-CPT/CUR-NP (2:1) (b) and HA-CPT/CUR-NP (4:1) (c) against Colon-26 cells, determined by MTT assays. CI versus Fa plots for HA-CPT/CUR-NP (1:1) (d), HA-CPT/CUR-NP (2:1) (e), and HA-CPT/CUR-NP (4:1) (f).
As indicated in a previously report, MTT assays are not suitable for real-time analysis of cellular transformation [55]. As an alternative, we employed ECIS, which is not yet widespread but bears a great potential for automated and real-time measuring cellular proliferation, in vitro cytotoxicity, and cell barrier function [56, 57]. By detecting the impedance of small gold electrodes used as substrata for cells over time, effects on cellular level can be monitored. Thus, it has been utilized in cancer research [58, 59]. As shown in Fig. 8, Caco2-BBE cells attached to the electrode surface to form a confluent monolayer with a resistance of approximately 35,000 Ohms. These cells were then incubated with various NPs containing the same drug concentration. Untreated Caco2-BBE monolayers showed a continuous increase in resistance, indicative of proliferation, whereas those treated with Triton X-100, used as a positive control (100% cell death), exhibited a sharp decrease in resistance. Interestingly, all NPs slightly increased resistance initially, followed by a subsequent decrease. This bimodal response might indicate that the efficient controlled drug release behavior of NPs restricted the initial burst effect. Notably, HA-CPT/CUR-NP (1:1) produced the lowest resistance, indicating that this NP formulation yielded the strongest antitumor activity among these three types of NPs.
Figure 8.

In vitro cytotoxicity of various NPs against Caco2-BBE cells based on ECIS technology. ECIS was used to determine cell viability in real time during an extended exposure to an NP suspension with a total drug concentration of 25 μM. As controls, ECIS was also performed on untreated cells or cells treated with Triton X-100 (0.5%) in DMEM.
4. Conclusion
In the present study, HA-functionalized PLGA NPs were employed as carriers to co-deliver CPT and CUR for colon cancer-targeted combination chemotherapy. The resultant NPs had a desirable diameter and slightly negative zeta potential. Studies on the drug release and cellular uptake properties of the co-delivery system showed that both drugs were released simultaneously and were effectively taken up by cells. The HA-CPT/CUR-NPs had excellent colon cancer cell-targeting ability and exhibited clear synergistic effects against Colon-26 cells. Furthermore, these synergistic effects were dependent on drug ratios, with NPs with a CPT/CUR weight ratio of 1:1 showing the greatest antitumor activity against Colon-26 cells. These studies unambiguously demonstrate that our HA-CPT/CUR-NPs promote colon cancer-targeted delivery and synergistic activity of co-delivered CPT and CUR to effectively increase the therapeutic efficacy of these drugs against colon cancer.
Supplementary Material
Acknowledgements
This work was supported by grants from the Department of Veterans Affairs (Merit Award to D.M.), the National Institutes of Health of Diabetes and Digestive and Kidney by the grants RO1-DK-071594 (to D.M.), the American Heart Association Postdoctoral Fellowship Grant 13POST16400004 (to B.X.), National Natural Science Foundation of China (grant numbers: 51503172 and 81571807) and Fundamental Research Funds for the Central Universities (SWU114086 and XDJK2015C067). D.M. is a recipient of a Career Scientist Award from the Department of Veterans Affairs.
Footnotes
Electronic supplementary information (ESI) available: Representative flow cytometry plots of cells incubated with or without cationic CPT/CUR-NPs (1:1) for 3 h; Cytotoxicity of blank chitosan-coated NPs and blank HA-functionalized NPs at different concentrations against Colon-26 cells after 48 h of co-incubation. See DOI: 10.1039/b000000x/
References
- 1.Twelves C, Wong A, Nowacki MP, Abt M, Burris H, Carrato A, Cassidy J, Cervantes A, Fagerberg J, Georgoulias V, Husseini F, Jodrell D, Koralewski P, Kröning H, Maroun J, Marschner N, McKendrick J, Pawlicki M, Rosso R, Schüller J, Seitz J, Stabuc B, Tujakowski J, Hazel GV, Zaluski J, Scheithauer W. N. Engl. J. Med. 2005;352:2696. doi: 10.1056/NEJMoa043116. [DOI] [PubMed] [Google Scholar]
- 2.Terzic J, Grivennikov S, Karin E, Karin M. Gastroenterology. 2010;138:2101. doi: 10.1053/j.gastro.2010.01.058. [DOI] [PubMed] [Google Scholar]
- 3.Liu C, Zhao G, Liu J, Ma N, Chivukula P, Perelman L, Okada K, Chen Z, Gough D, Yu L. J. Control. Release. 2009;140:277. doi: 10.1016/j.jconrel.2009.08.013. [DOI] [PubMed] [Google Scholar]
- 4.Xu X, Ho W, Zhang X, Bertrand N, Farokhzad O. Trends Mol. Med. 2015;21:223. doi: 10.1016/j.molmed.2015.01.001. [DOI] [PMC free article] [PubMed] [Google Scholar]
- 5.Lane D. Nat. Biotechnol. 2006;24:163. doi: 10.1038/nbt0206-163. [DOI] [PubMed] [Google Scholar]
- 6.Kamaly N, Xiao Z, Valencia PM, Radovic-Moreno AF, Farokhzad O. Chem. Soc. Rev. 2012;41:2971. doi: 10.1039/c2cs15344k. [DOI] [PMC free article] [PubMed] [Google Scholar]
- 7.Min KH, Park K, Kim YS, Bae SM, Lee S, Jo HG, Park RW, Kim IS, Jeong SY, Kim K, Kwon IC. J. Control. Release. 2008;127:208. doi: 10.1016/j.jconrel.2008.01.013. [DOI] [PubMed] [Google Scholar]
- 8.Covey JM, Jaxel C, Kohn KW, Pommier Y. Cancer Res. 1989;49:5016. [PubMed] [Google Scholar]
- 9.Darpa P, Beardmore C, Liu LF. Cancer Res. 1990;50:6919. [PubMed] [Google Scholar]
- 10.Cheetham AG, Zhang P, Lin YA, Lin R, Cui H. J. Mater. Chem. B Mater. Biol. 2014;2:7316. doi: 10.1039/C4TB01084A. [DOI] [PMC free article] [PubMed] [Google Scholar]
- 11.Ha W, Yu J, Song XY, Zhang ZJ, Liu YQ, Shi YP. J. Mater. Chem. B Mater. Biol. 2013;1:5532. doi: 10.1039/c3tb20956c. [DOI] [PubMed] [Google Scholar]
- 12.Zhang W, Zhou XY, Liu T, Ma D, Xue W. J. Mater. Chem. B Mater. Biol. 2015;3:2127. doi: 10.1039/c4tb01971g. [DOI] [PubMed] [Google Scholar]
- 13.Scarano W, de Souza P, Stenzel MH. Biomater. Sci. 2015;3:163. doi: 10.1039/c4bm00272e. [DOI] [PubMed] [Google Scholar]
- 14.Anand P, Kunnumakkara AB, Newman RA, Aggarwal BB. Mol. Pharm. 2007;4:807. doi: 10.1021/mp700113r. [DOI] [PubMed] [Google Scholar]
- 15.Gupta SC, Patchva S, Aggarwal BB. AAPS J. 2013;15:195. doi: 10.1208/s12248-012-9432-8. [DOI] [PMC free article] [PubMed] [Google Scholar]
- 16.Prasad S, Gupta SC, Tyagi AK, Aggarwal BB. Biotechnol. Adv. 2014;32:1053. doi: 10.1016/j.biotechadv.2014.04.004. [DOI] [PubMed] [Google Scholar]
- 17.Cao H, Wang Y, He X, Zhang Z, Yin Q, Chen Y, Yu H, Huang Y, Chen L, Xu M, Gu W, Li Y. Mol. Pharm. 2015;12:922. doi: 10.1021/mp500755j. [DOI] [PubMed] [Google Scholar]
- 18.Ganta S, Amiji M. Mol. Pharm. 2009;6:928. doi: 10.1021/mp800240j. [DOI] [PubMed] [Google Scholar]
- 19.Ramasamy T, Kim JH, Choi JY, Tran TH, Choi HG, Yong CS, Kim JO. J. Mater. Chem. B Mater. Biol. 2014;2:6324. doi: 10.1039/c4tb00867g. [DOI] [PubMed] [Google Scholar]
- 20.Hu CMJ, Zhang LF. Biochem. Pharmacol. 2012;83:1104. doi: 10.1016/j.bcp.2012.01.008. [DOI] [PubMed] [Google Scholar]
- 21.Hu CMJ, Aryal S, Zhang LF. Ther. Deliv. 2010;1:323. doi: 10.4155/tde.10.13. [DOI] [PubMed] [Google Scholar]
- 22.Maiolino S, Moret F, Conte C, Fraix A, Tirino P, Unqaro F, Sortino S, Reddi E, Quaglia F. Nanoscale. 2015;7:5643. doi: 10.1039/c4nr06910b. [DOI] [PubMed] [Google Scholar]
- 23.Khodadust R, Unsoy G, Gunduz U. Biomed. Pharmacother. 2014;68:979. doi: 10.1016/j.biopha.2014.10.009. [DOI] [PubMed] [Google Scholar]
- 24.Wang J, Ma W, Tu P. Macromol. Biosci. 2015 doi: 10.1002/mabi.201500043. Doi: 10.1002/mabi.201500043. [DOI] [PubMed] [Google Scholar]
- 25.Lyass O, Hubert A, Gabizon AA. Clin. Cancer Res. 2001;7:3040. [PubMed] [Google Scholar]
- 26.Pradhan R, Ramasamy T, Choi JY, Kim JH, Poudel BK, Tak JW, Nukolova N, Choi HG, Yong CS, Kim JO. Carbohydr. Polym. 2015;123:313. doi: 10.1016/j.carbpol.2015.01.064. [DOI] [PubMed] [Google Scholar]
- 27.Acharya S, Sahoo SK. Adv. Drug Deliv. Rev. 2011;63:170. doi: 10.1016/j.addr.2010.10.008. [DOI] [PubMed] [Google Scholar]
- 28.Xiao B, Yang Y, Viennois E, Zhang Y, Ayyadurai S, Baker M, Laroui H, Merlin D. J. Mater. Chem. B Mater. Biol. 2014;2:1499. doi: 10.1039/C3TB21564D. [DOI] [PMC free article] [PubMed] [Google Scholar]
- 29.Naor D, Wallach-Dayan SB, Zahalka MA, Sionov RV. Semin. Cancer Biol. 2008;18:260. doi: 10.1016/j.semcancer.2008.03.015. [DOI] [PubMed] [Google Scholar]
- 30.Yu MH, Jambhrunkar S, Thorn P, Chen JZ, Gu WY, Yu CZ. Nanoscale. 2013;5:178. doi: 10.1039/c2nr32145a. [DOI] [PubMed] [Google Scholar]
- 31.Li SD, Howell SB. Mol. Pharm. 2010;7:280. doi: 10.1021/mp900242f. [DOI] [PubMed] [Google Scholar]
- 32.Almeida PV, Shahbazi MA, Makila E, Kaasalainen M, Salonen J, Hirvonen J, Santos HA. Nanoscale. 2014;6:10377. doi: 10.1039/c4nr02187h. [DOI] [PMC free article] [PubMed] [Google Scholar]
- 33.Yu MH, Jambhrunkar S, Thorn P, Chen JZ, Gu WY, Yu CZ. Nanoscale. 2013;5:178. doi: 10.1039/c2nr32145a. [DOI] [PubMed] [Google Scholar]
- 34.Li X, Gao CX, Wu YP, Cheng CY, Xia W, Zhang Z. J. Mater. Chem. B Mater. Biol. 2015;3:1556. doi: 10.1039/c4tb01764a. [DOI] [PMC free article] [PubMed] [Google Scholar]
- 35.Xiao B, Zhang M, Viennois E, Zhang Y, Wei N, Baker MT, Jung Y, Merlin D. Biomaterials. 2015;48:147. doi: 10.1016/j.biomaterials.2015.01.014. [DOI] [PMC free article] [PubMed] [Google Scholar]
- 36.Lavertu M, Methot S, Tran-Khanh N, Buschmann MD. Biomaterials. 2006;27:4815. doi: 10.1016/j.biomaterials.2006.04.029. [DOI] [PubMed] [Google Scholar]
- 37.Badawy MEI, Rabea EI. Postharvest Biol. Technol. 2009;51:110. [Google Scholar]
- 38.Viennois E, Xiao B, Ayyadurai S, Wang L, Wang PG, Zhang Q, Chen Y, Merlin D. Lab. Invest. 2014;94:950. doi: 10.1038/labinvest.2014.89. [DOI] [PubMed] [Google Scholar]
- 39.Cohen-Sela E, Chorny M, Koroukhov N, Danenberg HD, Golomb G. J. Control. Release. 2009;133:90. doi: 10.1016/j.jconrel.2008.09.073. [DOI] [PubMed] [Google Scholar]
- 40.Mora-Huertas CE, Fessi H, Elaissari A. Adv. Colloid. Interface Sci. 2011;163:90. doi: 10.1016/j.cis.2011.02.005. [DOI] [PubMed] [Google Scholar]
- 41.Chen YF, Rosenzweig Z. Nano Lett. 2002;2:1299. [Google Scholar]
- 42.Mu L, Feng SS. Pharm. Res. 2003;20:1864. doi: 10.1023/b:pham.0000003387.15428.42. [DOI] [PubMed] [Google Scholar]
- 43.Hassan CM, Peppas NA. Adv. Polym. Sci. 2000;153:37. [Google Scholar]
- 44.Chen H, Yang W, Chen H, Liu L, Gao F, Yang X, Jiang Q, Zhang Q, Wang Y. Colloids Surf. B. 2009;73:212. doi: 10.1016/j.colsurfb.2009.05.020. [DOI] [PubMed] [Google Scholar]
- 45.Wang Y, Li P, Kong L. AAPS PharmSciTech. 2013;14:585. doi: 10.1208/s12249-013-9943-3. [DOI] [PMC free article] [PubMed] [Google Scholar]
- 46.Laroui H, Theiss AL, Yan Y, Dalmasso G, Nguyen HTT, Sitaraman SV, Merlin D. Biomaterials. 2011;32:1218. doi: 10.1016/j.biomaterials.2010.09.062. [DOI] [PMC free article] [PubMed] [Google Scholar]
- 47.Smith AM, Duan H, Mohs AM, Nie SM. Adv. Drug. Deliv. Rev. 2008;60:1226. doi: 10.1016/j.addr.2008.03.015. [DOI] [PMC free article] [PubMed] [Google Scholar]
- 48.Kim TH, Ihm JE, Choi YJ, Nah JW, Cho CS. J. Control. Release. 2003;93:389. doi: 10.1016/j.jconrel.2003.08.017. [DOI] [PubMed] [Google Scholar]
- 49.Liu YM, Reineke TM. J. Am. Chem. Soc. 2005;127:3004. doi: 10.1021/ja0436446. [DOI] [PubMed] [Google Scholar]
- 50.Wu H, Wang S, Fang H, Zan X, Zan X, Zhang J, Wan Y. Colloids Surf. B. 2011;82:602. doi: 10.1016/j.colsurfb.2010.10.024. [DOI] [PubMed] [Google Scholar]
- 51.Xiao B, Laroui H, Viennois E, Ayyadurai S, Charania MA, Zhang Y, Zhang Z, Baker MT, Zhang B, Gewirtz AT, Merlin D. Gastroenterology. 2014;146:1289. doi: 10.1053/j.gastro.2014.01.056. [DOI] [PMC free article] [PubMed] [Google Scholar]
- 52.He YY, Cheng G, Xie L, Nie Y, He B, Gu ZW. Biomaterials. 2013;34:1235. doi: 10.1016/j.biomaterials.2012.09.049. [DOI] [PubMed] [Google Scholar]
- 53.Yoon HY, Koo H, Choi KY, Lee SJ, Kim K, Kwon IC, Leary JF, Park K, Yuk SH, Park JH, Choi K. Biomaterials. 2012;33:3980. doi: 10.1016/j.biomaterials.2012.02.016. [DOI] [PubMed] [Google Scholar]
- 54.Yang XY, Li YX, Li M, Zhang L, Feng LX, Zhang N. Cancer Lett. 2013;334:338. doi: 10.1016/j.canlet.2012.07.002. [DOI] [PubMed] [Google Scholar]
- 55.Xiao B, Laroui H, Ayyadurai S, Viennois E, Charania MA, Zhang Y, Merlin D. Biomaterials. 2013;34:7471. doi: 10.1016/j.biomaterials.2013.06.008. [DOI] [PMC free article] [PubMed] [Google Scholar]
- 56.Park G, Choi CK, English AE, Sparer TE. Cell Biol. Int. 2009;33:429. doi: 10.1016/j.cellbi.2009.01.013. [DOI] [PubMed] [Google Scholar]
- 57.Muller J, Thirion C, Pfaffl MW. Biosens. Bioelectron. 2011;26:2000. doi: 10.1016/j.bios.2010.08.075. [DOI] [PubMed] [Google Scholar]
- 58.Opp D, Wafula B, Lim J, Huang E, Lo JC, Lo CM. Biosens. Bioelectron. 2009;24:2625. doi: 10.1016/j.bios.2009.01.015. [DOI] [PMC free article] [PubMed] [Google Scholar]
- 59.Tran TB, Cho S, Min J. Biosens. Bioelectron. 2013;50:453. doi: 10.1016/j.bios.2013.07.019. [DOI] [PubMed] [Google Scholar]
Associated Data
This section collects any data citations, data availability statements, or supplementary materials included in this article.