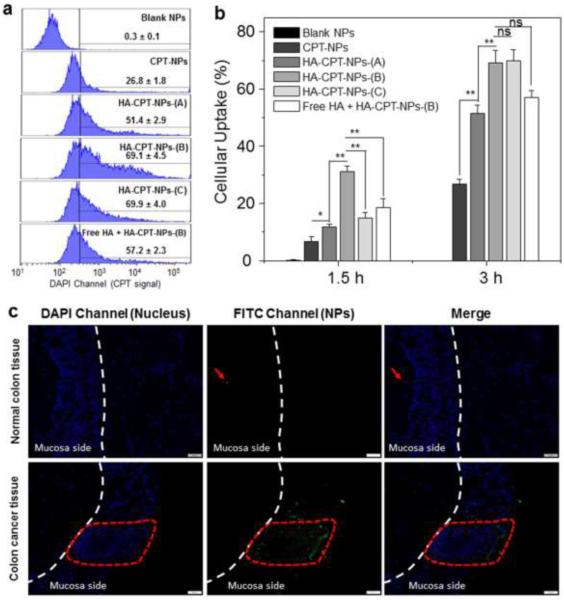
Figure 5.
Quantification of cellular uptake of various NPs by Colon-26 cells. (a) Representative flow cytometry histograms of fluorescence intensity for cells treated with various NPs (50 μM CPT) for 3 hours. (b) Percentage of CPT-containing Colon-26 cells after treatment with various NPs (50 μM CPT) for 1.5 or 3 hours. Each point represents the mean ± S.E.M. (n = 3; *P < 0.05 and **P < 0.01, Student’s t-test). (c) Tissue uptake profiles of HA-CUR-NPs after co-incubating for 5 h with normal colon tissue or colon cancer tissue (red frame indicates colon tumour areas). Tissues were treated with NPs (CUR, 100 μM) and processed for fluorescence staining. Fixed cells were stained with DAPI for visualization of nuclei (purple). Scale bar represents 50 μm.

