

Abstract
Background
Functions for the early embryonic vasculature in regulating development of central nervous system tissues, such as the retina, have been suggested by in vitro studies and by in vivo manipulations that caused additional ocular vessels to develop. Here we use an avascular zebrafish embryo, cloche−/− (clo−/−), to begin to identify necessary developmental functions of the ocular vasculature in regulating development and patterning of the neural retina, in vivo. These studies are possible in zebrafish embryos, which do not yet rely upon the vasculature for tissue oxygenation.
Results
clo−/− embryos lacked early ocular vasculature and were microphthalmic, with reduced retinal cell proliferation and cell survival. Retinas of clo mutants were disorganized, with irregular synaptic layers, mispatterned expression domains of retinal transcription factors, morphologically abnormal Müller glia, reduced differentiation of specific retinal cell types, and sporadically distributed cone photoreceptors. Blockade of p53-mediated cell death did not completely rescue this phenotype and revealed ectopic cones in the inner nuclear layer. clo−/− embryos did not upregulate a molecular marker for hypoxia.
Conclusions
The disorganized retinal phenotype of clo−/− embryos is consistent with a neural and glial developmental patterning role for the early ocular vasculature that is independent of its eventual function in gas exchange.
Keywords: Retina, zebrafish, vasculature, neurogenesis, photoreceptors, Müller glia, pax6a, neurod1
Introduction
Cells of the central nervous system (CNS) are the most metabolically active in the body and have a high demand for oxygen and nutrient delivery from the vasculature. In addition, specialized neural stem cell niches require immediate access to a blood supply, for metabolic support as well as for endocrine or paracrine factors provided by the circulating blood or the cells of the blood vessels (Ottone et al., 2014; Raymond et al., 2006). Major glial cell types of the CNS – Müller glia in the retina, and astrocytes elsewhere – establish an intimate association with endothelial cells of blood vessels by forming endfeet that induce tight junctions and create the blood-retinal barrier and blood-brain barrier (Alvarez et al., 2007; Hartsock et al., 2014; Xie et al., 2010). Numerous disorders of the CNS involve coincident or causative vascular pathology. Examples of such disorders from the neural retina include diabetic retinopathy (Shin et al., 2014), the wet form of age-related macular degeneration (van Lookeren Campagne et al., 2014) and retinopathy of prematurity (Hartnett, 2015).
There is an emerging interest in understanding how the developing vasculature of the CNS interacts with progenitor cells, and developing neurons and glia, during embryogenesis (Aizawa and Shoichet, 2012). Goals of these efforts include determining vascular-neuronal developmental interactions necessary for the establishment of mature tissue morphologies that allow for healthy metabolic relationships, and identifying signaling factors that underlie any communication between the developing vessels and developing neural tissue. For example, in the frizzled mutant mouse, and in a mouse model overexpressing vascular endothelial growth factor (VEGF) in the lens, extra blood vessels develop and are associated with abnormal retinal neurogenesis (Rutland et al., 2007; Zhang et al., 2008). In a zebrafish model, an abnormally dilated hyaloid vein interferes with closure of the optic fissure, demonstrating interactions between blood vessels and the optic cup in influencing eye morphogenesis (Weiss et al., 2012). In addition, co-culture studies suggest that direct cellular contact of neural progenitors with endothelial cells influences neural progenitor proliferation (Shen et al., 2004) and retinal cell differentiation (Aizawa and Shoichet, 2012; Parameswaran et al., 2014) in vitro. Insights from further studies are likely to reveal vascular-neuronal relationships that may aid in understanding pathologies of the CNS which involve the vasculature.
One challenge to the in vivo study of vascular effects on neuronal development is that experimental manipulation of the vasculature in mammals results in an unavoidable disruption of tissue oxygenation. Such experimental manipulations would therefore be unable to uncouple developmental signaling roles of the vasculature from nourishment roles. To overcome this obstacle we are pursuing developmental roles of the vasculature in the zebrafish (Danio rerio) embryo. During embryonic development, zebrafish tissues are not dependent upon hemoglobin-mediated oxygen transport, and can instead utilize diffusion for gas exchange (Pelster and Burggren, 1996). In addition to this important advantage, the zebrafish offers avascular genetic models (Stainier et al., 1996; Stainier et al., 1995; Xiong et al., 2008), transgenic tools for the visualization of vasculature (Covassin et al., 2009; Jin et al., 2005; Lawson and Weinstein, 2002; Nasevicius et al., 2000), and numerous retina-specific developmental markers (Stenkamp, 2007).
In vertebrates, the vasculature and the neural retina undergo development concomitantly, suggesting opportunities for developmental signaling interactions. Specifically in zebrafish, the hyaloid artery invades the eye through the choroid fissure at 18-20 hpf (Hartsock et al., 2014), and then branches to form the system of hyaloid capillaries that lie between the lens and retina (Alvarez et al., 2007; Hartsock et al., 2014; Kitambi et al., 2009). This hyaloid network is established over 24-32 hpf, corresponding to the time of retinal progenitor proliferation and initial differentiation of retinal ganglion cells (RGCs) (Hu and Easter, 1999). A second vascular system, the superficial vessels, forms on the surface of the eye from 23 hpf to 54 hpf (Kaufman et al., 2015), corresponding to the time of generation and differentiation of more distal retinal cell types including retinal bipolar cells, photoreceptors, and Müller glia (Hu and Easter, 1999).
To begin to test developmental roles for the early ocular vasculature in regulating retinal neurogenesis and patterning, we used embryonic cloche (clo) mutant zebrafish. clo mutant embryos display severe defects in development of vascular endothelial cells, endocardial cells, and hematopoietic cells (Stainier et al., 1995). Here we verified the lack of early ocular vasculature in clo−/− embryos, and evaluated the process of retinal neurogenesis using histology, cell-specific immunological markers, and in situ hybridization for specific retinal transcription factors. We report defects in retinal cell proliferation and survival in clo−/−, and striking defects in retinal organization that include disrupted expression patterns of retinal transcription factors, abnormal morphology of Müller glia and of synaptic layers, and ectopic cone photoreceptors that are revealed when cell death is blocked. These abnormalities are not related to tissue hypoxia or to the complete lack of microglia and they are not secondary to lens defects. Our results are consistent with possible non-metabolic, developmental patterning functions for the early ocular vasculature in the control of retinal neurogenesis.
Results
Lack of early ocular vasculature in clo−/− embryos
The cloche mutation in zebrafish affects the development of endothelial and hematopoietic lineages, and mutants lack functional hearts, blood cells, and most blood vessels (Liao et al., 1997; Stainier et al., 1995). We verified that ocular vasculature was absent in clo mutants (m378 and m39 alleles) using two complementary strategies. Firstly, we established cloche on the kdrl:EGFP transgenic background, in which all vascular endothelial cells express EGFP under regulatory elements of the kdrl gene (VEGF receptor 2, vegfr2) (Jin et al., 2005). Confocal images revealed that clo+; kdrl:EGFP embryos develop EGFP+ ocular vascular networks from 24 – 54 hpf, including the hyaloid artery, hyaloid capillaries, and the superficial vasculature (Fig. 1A,C) (Alvarez et al., 2007; Kitambi et al., 2009). In contrast, eyes of clo−/−; kdrl:EGFP embryos showed the complete absence of EGFP+ blood vessels within the developing eye at the same developmental stages (Fig. 1B,D). Interestingly, clo−/− embryos displayed some evidence of blood vessel formation outside of the eye, including the branchial arch vessels, at 54 hpf (Fig. 1E,F). Secondly, we examined eyes of non-transgenic clo−/− embryos for the presence of endogenous alkaline phosphatase activity, which is characteristic of endothelial cells (Zoeller et al., 2008). At 48 hpf, wild-type siblings of clo mutants showed staining of superficial vasculature (data not shown) in addition to staining of hyaloid capillaries surrounding the lens (Fig. 1G). By contrast, clo mutant eyes displayed no alkaline phosphatase activity, indicating the absence of endothelial cells (Fig. 1H). The absence of two markers of endothelial cells within the developing eye indicates that embryonic eyes of clo mutants do not develop early ocular vasculature.
Figure 1.

Ocular abnormalities in cloche mutant embryos. A-F. Confocal images of kdrl:EGFP wild-type (A,C,E) and clo−/− (B,D,F) blood vessels (green). Hyaloid artery (ha) has invaded the eye and superficial vessels (sv) begin to form at 29 hpf in wild type (A) but not clo−/− (B). Hyaloid capillaries (hc), and superficial vasculature (sv) have developed at 54 hpf in wild-type (C) but not clo−/− (D). Branchial arch vessels (bav) are present at 54 hpf in wild-type (E), and are strongly reduced in clo−/− (F). G-H. Confocal images of Fast Red staining of endogenous alkaline phosphatase; focal plane of hyaloid capillaries, which are present in wild-type (G) but not clo−/− (H). I-L. Live, wild-type (I, K) and clo−/− (J,L) embryos imaged at 36 hpf (I,J) and 48 hpf (K,L). M-P. Eye diameters and lens diameters of wild-type and clo−/− embryos at 30 (M), 36 (N), 48 (O) and 72 (P) hpf; ***, p<0.001. Scale bars = 50 μm (in A, applies to A,B; in C, applies to C-F; in G, applies to G,H).
Reduced embryonic eye growth in clo mutants
clo−/− embryonic eyes appeared reduced in size as compared with their wild-type siblings (Fig. 1I-L). Circumferences of eyes and lenses from live embryos at 30, 36, 48, and 72 hpf were measured in order to estimate their diameters (n=10-15 for each age and genotype; see Experimental Procedures). At all sampling times, clo−/− eyes were significantly smaller than wild-type eyes (Fig. 1M-P). No eye growth was apparent in clo−/− eyes between 36 and 48 hpf, as the 48 hpf clo−/− eyes were not significantly larger than 36 hpf clo−/− eyes (Fig. 1N,O). Interestingly, at 30 and 36 hpf clo−/− lenses were not significantly different in size than wild-type lenses (Fig. 1M,N), and at 48 hpf clo−/− lenses had increased significantly in size (Fig. 1N,O; p<0.01). However, at 48 and 72 hpf clo−/− lenses were significantly smaller than those of their wild-type siblings (Fig. 1O,P; p<0.001). Together these findings suggest that clo mutants have defects in eye growth that are not likely strictly related to, or secondary to, lens defects (Goishi et al., 2006).
Disrupted retinal, retinal pigmented epithelium (RPE), and lens histology in clo mutants
We evaluated further the phenotype of clo mutant eyes using histological sections prepared from clo−/− embryos at 30 hpf, when the reduced eye size is initially evident. The RPE, retinal neuroepithelium, and lenses in clo−/− and wild-type siblings appeared similar, although vascular endothelial cells were notably missing in the clo mutants (Fig. 2A,B). At 48 hpf, when clo−/− embryos show reduced eye and lens size, wild-type eyes showed an emerging inner plexiform layer (IPL; where ganglion cells synapse with amacrine and bipolar cells) and an optic nerve head (ONH) (Fig. 2C). The eyes of clo mutants displayed less evidence of an IPL but did show an ONH (Fig. 2D). Lenses of the clo mutants showed numerous nuclei within the central lens, which normally differentiate into anucleate lens fibers (Fig. 2D). This defect is perhaps related to reduced crystallin synthesis and/or solubility as previously reported (Goishi et al., 2006). At 72 hpf, the wild-type retina displays laminar organization (Fig. 2E) and visual function is possible (Easter and Nicola, 1996). clo−/− retinas were poorly organized, with a reduced and irregular IPL, and a strongly reduced outer plexiform layer (OPL; where photoreceptors synapse with bipolar cells). All retinal nuclear layers also appeared reduced in thickness and were disorganized (Fig. 2F). This disorganization precluded measurement and quantification of every layer (although some specific cell types are quantified below). The clo−/− retinas also showed evidence of cell death, with gaps in the retinal tissue associated with darkly stained and pyknotic nuclei, particularly in the retinal ganglion cell (RGC) layer and the inner nuclear layer (INL) (Fig. 2F). We note that within a clutch of clo mutants, this phenotype showed some variability, with some embryos displaying fewer pyknotic nuclei and less disorganized retinal layers (not shown). However, microphthalmia and the reduced thickness of plexiform layers were consistently observed. The RPE was visibly thinner in clo−/− than in wild-type embryos, particularly in ventral retina, and in some mutant embryos the ventral RPE was missing (data not shown). Lenses of clo−/− embryos remained abnormal, also displaying cell-free gaps between the lens epithelium and the developing lens fibers, particularly in the region of the lens equator (Fig. 2F), as observed in other cases of developmental lens abnormality (Posner et al., 2013). These findings indicate that clo mutant embryos fail to develop normally laminated retinas, as well as show defects in developing RPE and lens tissues.
Figure 2.

Histology of wild-type (A,C,E) and clo−/− (B,D,F) eyes at 30 hpf, 48 hpf, and 72 hpf. RPE, retinal pigmented epithelium; RN, retinal neuroepithelium; LE, lens; VE, vascular endothelial cells; IPL, inner plexiform layer; ONH, optic nerve head; GCL, ganglion cell layer; INL, inner nuclear layer; ONL, outer nuclear layer; OPL, outer plexiform layer. In F, asterisk (*) denotes gap between lens epithelium and developing lens fibers; wide arrow points to pyknotic cells in INL. Scale bar (in A, applies to all) = 50 μm.
Retinal cell proliferation and cell death in clo mutants
The developmental time when the growth of clo−/− eyes is significantly disrupted (30-72 hpf) corresponds to the periods of retinal progenitor proliferation, neurogenesis, and cell differentiation (Hu and Easter, 1999). Next we tested whether some of the reduced eye growth in clo mutants may be related to defects in cell proliferation, by staining cryosections obtained from 30 hpf and 54 hpf embryos with an antibody targeting phosphorylated histone-3 (PH3), an M-phase marker. At 30 hpf, wild-type and clo−/− retinas contained mitotic cells at the apical surface of the retina (Fig. 3A,B), and numbers of PH3+ cells were not significantly different in clo−/− as compared to wild-type retinas (Fig. 3E), suggesting that reduced retinal proliferation may not contribute to reduced eye size in clo mutants at this developmental time. At 54 hpf, wild-type and clo−/− retinas contained mitotic cells in the emerging ONL, the INL, and in the circumferential germinal zone (CGZ) (Fig. 3C,D,G). Mitotic cells in non-apical regions (the INL) are likely rod lineage-related (Nelson et al., 2008). In clo−/− embryos, mitotic cells in the retina were present in significantly fewer numbers (Fig. 3F). An additional analysis of PH3+ cells within specific retinal layers/regions revealed significantly fewer M-phase cells specifically at the apical surface of the retina/future ONL (Fig. 3G). Therefore, reduced retinal proliferation may contribute to the lack of eye growth during later stages of neurogenesis in clo−/− embryos. However, when numbers of retinal PH3+ nuclei were calculated as a function of total numbers of DAPI+ retinal nuclei (mitotic index), there was no statistically significant difference (Fig. 3H), suggesting that at or prior to 54 hpf, some other factor contributed to the reduced eye size.
Figure 3.

Retinal progenitor proliferation in wild-type and clo mutant embryos. A-D. Immunofluorescence images of wild type (A,C) and clo−/− (B,D) retinas stained with anti-phosphohistone 3 (PH3) and counterstained with DAPI (blue); samples obtained at 30 hpf (A,B) and 54 hpf (C,D). E-G. Numbers of PH3+ nuclei/section are not significantly different in clo−/− vs. wild-type retinas at 30 hpf (E), but are significantly different at 54 hpf (F; p<0.001); these differences are most evident in the outer nuclear layer (G; ONL; p<0.001), but not in the inner nuclear layer (INL) or circumferential germinal zone (CGZ). H. Mitotic index (# PH3+ nuclei/total number of retinal cells per section) is not significantly different in clo−/− as compared to wild-type. Scale bars = 50 μm (A applies to A,B; C applies to C,D).
The gaps in retinal tissue and presence of pyknotic cell bodies, together with reduced eye size (Fig. 1) suggested that increased cell death in clo−/− embryos was likely. We explicitly evaluated caspase 3-mediated cell death in the retinas of clo mutants and their normal siblings by using an anti-cleaved caspase 3 (CC3) antibody, and in separate experiments, with a TUNEL assay. In sections derived from 30 hpf embryos, we observed virtually no dying cells in developing retinas of either wild-type or clo−/− embryos, using TUNEL or CC3 staining (Fig. 4E). However, in sections of 54 hpf embryos, numbers of dying cells were significantly higher in clo−/− retinas than in wild-type retinas (Fig. 4A,B,E; p<0.001 for CC3 and p<0.01 for TUNEL), with TUNEL labeling detecting a higher, but more variable number of dying cells than CC3 labeling. These results indicate an increased rate of cell death during late retinal neurogenesis in clo−/− retinas. In sections processed at 72 hpf the numbers of CC3+ or TUNEL+ profiles were again significantly higher than in wild-type retinas, with bands or clusters of staining predominantly in the GCL, and in the INL region that normally contains cell bodies of bipolar cells and Müller glia, and in the distal retina (possibly cells of the ONL but due to disorganized structure this cannot be unambiguously determined; Fig. 4C-E). Of particular interest was the comparative lack of increased cell death in the brains of clo−/− embryos (Fig 4F; numbers are per hemi-brain), suggesting a potentially specific retinal requirement for vasculature at 30-72 hpf. Because each of the three sampling times represents only a brief snapshot of cell death, it is likely that the observed rate of retinal cell death over the period of late retinal neurogenesis and cell differentiation contributes to reduced eye size in clo mutants.
Figure 4.

Increased retinal cell death during late retinal neurogenesis in clo mutant embryos. A-D. Immunofluorescence images of wild-type (A,C) and clo−/− (B, D) retinas stained with anti-cleaved caspase 3 (CC3); samples obtained at 54 hpf (A,B) and 72 hpf (C,D). Arrow in B indicates examples of CC3+ cells. E. Numbers of CC3+ and TUNEL+ cells are significantly (***, p<0.001; **, p<0.01) increased in clo−/− retinas at 54 hpf and 72 hpf. F. Numbers of CC3+ (dying) cells are significantly (***; p<0.001) increased in clo−/− retinas at 54 hpf and 72 hpf, but not in clo−/− brains. Bar in A (applies to all images) = 50 μm; LE, lens; GCL, ganglion cell layer; INL, inner nuclear layer; OPL, outer plexiform layer.
Reduced differentiation of retinal neurons in clo mutants
The thinned and irregular plexiform layers in clo−/− retinas suggested that formation of synaptic processes may be impaired. Indirect immunofluorescence studies using an antibody that detects synaptic vesicle 2 (SV2) confirmed that synaptic terminals appeared less abundant in clo−/− retinas at 72 hpf, and showed irregular patterns (Fig. 5A-C). These irregular patterns of SV2 staining may indicate faulty growth and targeting of the synaptic terminals themselves, and/or specifically of the SV2 protein.
Figure 5.

Abnormal differentiation of specific inner retinal neurons in clo mutant embryos. A-C. Immunofluorescence images of 72 hpf retinas of wild-type (A) and clo−/− (B,C) embryos stained for synaptic vesicle 2 (SV2). D,E. Immunofluorescence images of 72 hpf retinas of wild-type (D) and clo−/− (E) embryos stained with the ZN8 antibody, detecting retinal ganglion cells. F. Volume of GCL is significantly (***, p<0.001) reduced in clo−/− retinas. G-H. Immunofluorescence images of 72 hpf retinas of wild-type (G) and clo−/− (H) embryos stained with an antibody detecting HuC/D, present in ganglion cells and amacrine cells. I-K. Immunofluorescence images of 72 hpf retinas of wild-type (I) and clo−/− (J,K) embryos stained with an antibody detecting PKCα, specific to bipolar cells. * in K indicates diffuse staining of material lacking typical bipolar cell morphology. Scale bar in A (applies to all images) = 50 μm. LE, lens; IPL, inner plexiform layer; OPL, outer plexiform layer; GCL, ganglion cell layer; INL, inner nuclear layer.
clo−/− retinas displayed disorganized RGC layers (Fig. 2F), suggesting that differentiation of RGCs may be affected. In addition, RGCs are the retinal neurons that reside in closest proximity to a vasculature bed – the hyaloid – which is missing in clo mutants (Fig. 1B,D,H). We labeled the ganglion cell layer (GCL) with the antibody ZN8 at 54 hpf, when embryonic RGC neurogenesis is complete (Hu and Easter, 1999). The size of the ZN8-positive domain appeared reduced in clo−/− as compared with wild-type embryos (Fig. 5D,E). We used a subset of ZN8-stained cryosections from n=9 embryos to estimate the volume of the GCL (see Experimental Procedures). This analysis revealed a significantly reduced GCL volume in clo−/− retinas; approximately 48% (Fig. 5F). To determine whether this outcome was simply related to reduced overall eye size, we used the same set of cryosections to estimate the volume of the unlabeled portion of each eye and then obtain ratios of GCL volumes to the non-GCL volume of the eye. In wild-type embryos this ratio was 0.08, while in clo−/− embryos this ratio was 0.10, a statistically significant difference (p<0.05), and one that indicates the GCL of clo−/− embryos is actually less reduced in size as compared with the remainder of the eye. Collectively these findings suggest that the clo mutation impairs the differentiation of RGCs, but may have greater impacts on other cell types of the developing eye.
Neurons of the INL were next analyzed by staining cryosections from 72 hpf embryos with anti-HuC/D, which stains amacrine as well as ganglion cells (Fig. 5G), and with anti-protein kinase Cα (PKCα), which stains a subpopulation of retinal bipolar cells (Fig. 5I). HuC/D+ cells in the GCL and inner half of the INL were evident in both wild-type and clo−/− retinas (Fig. 5G,H), and the domain of HuC/D immunoreactivity in clo−/− retinas was greatly expanded as compared to the corresponding ZN8 staining domain (compare Fig. 5H with Fig. 5E), suggesting that initial amacrine cell differentiation took place in clo mutants. Moreover, the Hu staining pattern further revealed a conspicuously reduced and disorganized IPL (Fig. 5H). In the anti-PKCα studies, clo−/− retinas displayed a range of staining patterns. In some clo mutants, particularly those that showed highly disorganized retinal lamination, PKCα staining was entirely absent (Fig. 5J). However, in clo mutants with evidence of some lamination, faint PKCα+ cellular profiles were present, but with no obvious cellular processes (Fig. 5K).
The differentiation of rod and cone photoreceptors was detected in 72 hpf cryosections using the antibodies 1D1, which stains the rod visual pigment, rhodopsin (Fadool, 2003), ZPR1, which stains an unknown surface epitope on double cones (pairs of red- and green-sensitive cones) (Larison and Bremiller, 1990), and peanut lectin, which stains all cones (Garlipp et al., 2012) (Fig. 6A,C, and data not shown). The presence of rods in clo mutants appeared greatly reduced, with most clo−/− samples showing only a small patch of rods ventral to the optic nerve (Fig. 6B), and significantly fewer 1D1+ rods dorsal to the optic nerve (Fig. 6E). Staining with ZPR1 (Fig. 6D) and peanut lectin (data not shown) was also reduced in clo mutants as compared with their wild-type siblings, but still showed a sporadic distribution of irregularly-shaped ZPR1+ cones in regions dorsal to the ventral patch (Fig. 6D). We scored patterns of ZPR1 staining to quantify the extent of cell staining (none, few, or many ZPR1+ cells) and the distribution of stained cells (sporadic, discontinuous, or dense within the ONL) (see Methods and (Kashyap et al., 2011)). In clo−/− embryos, both the extent of staining (Fig. 6F) and the distribution of stained cells (Fig. 6F‘) were significantly different from those of wild-type siblings (p<0.001 for each comparison).
Figure 6.

Reduced and mispatterned differentiation of photoreceptors in cloche mutant embryos. A-B. Immunofluorescence images of 72 hpf retinas of wild-type (A) and clo−/− (B) embryos stained with the 1D1 antibody, detecting rod photoreceptors. C-D. Immunofluorescence images of 72 hpf retinas of wild-type (D) and clo−/− (E) embryos stained with the ZPR1 antibody, detecting cone photoreceptors. Arrows in D show developing cones flanking a region of the ONL that is not ZPR1+. E. Numbers of 1D1+ cells are significantly (***, p<0.001) reduced in clo−/− retinas. F. The extent of ZPR1 labeling (F) and the distribution of ZPR1+ cells (F‘) is also significantly different in clo−/− retinas as compared to wild-type (p<<0.001). LE, lens. Scale bar in A (applies to all images) = 50 μm.
In summary, the differentiation of specific retinal neuronal cell types was reduced or irregular, and the organization of retinal layers was abnormal in clo mutants, suggesting that the early ocular vasculature, or the clo gene product more directly, may have a regulatory role in retinal patterning, as well as in lens development (Goishi et al., 2006). These defects were not limited to the cell type (RGCs) normally in closest proximity to the hyaloid vasculature.
Reduced differentiation of Müller glia, and reduced numbers of microglia in clo mutants
We next evaluated the presence and differentiation of two non-neuronal components of the retina, Müller glia and microglia. Müller glia were selected for evaluation because they must interact with the developing vasculature as they mature and develop their proximal endfeet (Alvarez et al., 2007), and in clo mutant eyes such interactions would not be possible. Using anti-glial fibrillary acidic protein (GFAP) antibody (ZRF1) and cryosections obtained from 72 hpf wild-type embryos, we detected radial arrays of Müller glia, with prominent endfeet at the vitreal surface of the developing retina (Fig. 7A). In contrast, cryosections obtained from clo−/− embryos showed greatly reduced GFAP immunoreactivity, as well as disorganized patterns of staining (Fig. 7B,C). In some mutants, the few GFAP+ profiles that were present appeared most prominent at the vitreal surface, where Müller glia would normally establish endfeet, but with little staining elsewhere (Fig. 7C), suggesting abnormal glial morphology and/or abnormal targeting of glial cytoskeletal proteins. Interestingly, many of the clo mutant brains displayed prominent GFAP staining, and radially organized glial processes (Fig. 7B,C). These results indicate significant and potentially retina-selective defects in Müller glial differentiation in clo mutants.
Figure 7.

Abnormal differentiation of Müller glia, and reduced microglia in cloche mutant embryos. A-C. Immunofluorescence images of 72 hpf retinas of wild-type (A) and clo−/− (B,C) embryos stained with the ZRF1 antibody detecting GFAP, specific to Müller glia. * indicates vitreal surface of retina (r), where Müller glia establish endfeet. b, brain. D-E. Immunofluorescence images of 72 hpf retinas of wild-type (D) and clo−/− (E) embryos stained with the 4C4 antibody that labels microglia. F. The % of cryosections per eye that contained microglia was significantly reduced in clo−/− embryos as compared with wild-type embryos (***, p<0.0001). G-H. Neutral red uptake in retinal cells of wild-type (G) and clo−/− (H) embryos from 49 to 53 hpf. G‘-H‘. Tracings of flattened projections of neutral red (NR) stained wild-type (G‘) and clo−/− (H‘) eyes; arrow in G shows an NR+ cell. I. Percent retinal coverage by neutral red+ profiles. LE, lens. Scale bar in C (applies to A-E) = 50 μm; scale bar in H (applies to G-H‘) = 50 μm.
We also evaluated retinal microglia, because, to our knowledge, their presence in clo mutants has not been ascertained, although the hematopoietic lineages that require a functional cloche gene include the myeloid lineage (Lyons et al., 2001), which is known to give rise to microglial progenitors (Greter and Merad, 2013). Mature microglia were detected using the 4C4 antibody (Nelson et al., 2013). In wild-type retinas processed at 72 hpf, microglia were found sporadically, and generally in clusters, with wide variability in their presence vs. absence in any particular section (Fig. 7D). We therefore processed 10-30 sections of five embryos of each genotype to analyze the amount and distribution of microglia. This analysis suggested that clo mutant retinas also harbored microglia, which were distributed sporadically and also found in clusters (Fig. 7E). However, a significantly smaller proportion of cryosections derived from clo−/− eyes contained microglia as compared with wild type (p<0.0001; Fisher exact test; Fig. 7F). These results suggest that microglia are present within the clo−/− retina, but in reduced numbers. Because 4C4 antibody detects only mature microglia, we next tested whether phagocytic microglial progenitors invaded the retina in high numbers, using the uptake of neutral red dye (49-53 hpf) to label this cell population (Herbomel et al., 2001). Both wild-type and clo−/− retinas showed neutral red+ cells and/or clusters of cells (Fig. 7G,H). We quantified the percentage of each embryonic retina that was covered with neutral red+ profiles, by tracing stained cells in flattened projections of focal planes that contained neutral red+ cells (Fig. 7G’, H’). The “percent coverage” of the retina by neutral red+ cells in clo−/− embryos was not significantly different from that in their wild-type siblings (Fig. 7I). Collectively these results suggest that in clo−/−, microglial progenitors invade the retina in numbers similar to those in wild-type embryos, but then many of these progenitors fail to either mature, and/or proliferate, and/or survive, resulting in highly reduced numbers of mature microglia in clo−/− retinas at 72 hpf.
Irregular expression patterns of specific retinal transcription factors in clo mutants
The generation and differentiation of retinal neurons requires coordinated expression of specific retinal transcription factors (Kay et al., 2001; Macdonald et al., 1995; Nelson et al., 2008; Nelson et al., 2009; Ochocinska and Hitchcock, 2009). We therefore examined expression of transcription factors that are required for normal neurogenesis and differentiation of retinal cell types. Expression of atoh7 (ath5) is required for RGC neurogenesis (Kay et al., 2001), and in wild-type embryos a wave of atoh7 expression is propagated through the retinal neuroepithelium from 25 to 36 hpf (Masai et al., 2000) (Fig. 8A). clo mutants processed at 30 hpf showed a pattern of atoh7 expression similar to that of wild-type siblings (Fig. 8B), suggesting that abnormal atoh7 expression is not likely involved in generating the retinal phenotype of clo−/−. Expression of six3b, which encodes a transcription factor that is expressed in proliferating eye progenitors at 30 hpf was also normal in clo mutants (data not shown).
Figure 8.

Irregular expression of specific retinal transcription factors in cloche mutant embryos. A.-D. At 30 hpf atoh7/ath5 is expressed in a ventral cluster of retinal progenitor cells in both wild-type (A) and clo−/− (B), and pax6a is expressed in all retinal progenitors in both wild-type (C) and clo−/− (D) embryos. E.-F. At 49 hpf pax6a is expressed in the ganglion cell layer (GCL) and inner half of the inner nuclear layer (INL) of wild-type embryos (E), but is more diffusely distributed (such as in the cells near the asterisk) and weakly expressed in clo−/− (F). G.-H. At 49 hpf, neurod1 is expressed in the ONL, and in radial clusters of cells in the INL and occasionally the GCL in wild-type (G), but is reduced in distribution in all of these locations in clo−/− (H), resulting in patches of ONL lacking neurod1 (arrows). I.-J. At 54 hpf, rx1 is expressed in the circumferential germinal zone (CGZ) and weakly in the emerging outer nuclear layer (ONL, arrows) in WT (I) and clo−/− (J); K.-L. At 54 hpf crx is expressed in the ONL and the outer half of the INL in wild-type (K), and shows a similar distribution and hybridization intensity in clo−/− (L), but with occasional patches of ONL lacking crx expression (arrow). Scale bars = 50 μm (B, applies to A-D; F, applies to E-L). Sections in panels E-H, and K-L were derived from embryos treated with PTU and so do not have melanin pigment within the retinal pigmented epithelium.
The transcription factor Pax6 is essential for eye development and is expressed in retinal progenitors during progenitor proliferation, and then during retinal neurogenesis becomes restricted to RGCs and amacrine cells (Hitchcock et al., 1996; Macdonald et al., 1995), and the circumferential germinal zone (CGZ) (Raymond et al., 2006) (Fig. 8C,E). In clo mutant retinas, pax6a expression appeared normal in distribution and was present throughout the retinal neuroepithelium at 30 hpf (Fig. 8D). However, at 49 hpf, prior to the disorganized histological appearance of the clo−/− retina, pax6a expression was highly unusual in that it was not restricted to the emerging RGC and INL (Fig. 8F). In addition, the hybridization signals appeared weak and patchy in distribution (Fig. 8F). Hence, it is possible that the abnormal distribution of pax6a expression, at least in part, underlies the disorganized phenotype of clo−/− retinas, and may reflect earlier events in retinal development that lead to this abnormal expression.
Because we observed impaired photoreceptor differentiation and patterning in clo mutants, we next examined expression of several transcription factors involved in photoreceptor development. neurod1 regulates retinal progenitor cell proliferation and promotes the generation of photoreceptors (Ochocinska and Hitchcock, 2009). At 49 hpf, neurod1 is expressed throughout the emerging ONL, and in cells organized in loose patches in the INL and occasionally in the GCL (Fig. 8G); some of the INL cells are those of the dedicated lineage that gives rise to rod photoreceptors (Nelson et al., 2008; Ochocinska and Hitchcock, 2007). The clo−/− retinas displayed a similar overall pattern of neurod1 expression, but the ONL showed occasional gaps in labeling and reduced intensity of staining, and far fewer cells in the INL appeared to be labeled (Fig. 8H). Expression of rx1 (rax) is required for retinal neurogenesis and for photoreceptor differentiation (Nelson et al., 2009). At 30 hpf, rx1 is expressed throughout the retinal neuroepithelium (Chuang et al., 1999; Nelson et al., 2009), and we observed this expression pattern in clo−/− and wild-type retinas (data not shown). At 54 hpf, rx1 is expressed in the CGZ, and weakly in the emerging ONL of wild-type retinas (Fig. 8I). A similar rx1 expression pattern was observed in clo mutant retinas (Fig. 8J), although in some embryos the rx1 expression domain in the CGZ did not extend to the far periphery (Fig. 8J). Finally, we analyzed expression of crx mRNA, which encodes a transcription factor that activates numerous photoreceptor-specific genes (Chen et al., 1997). In wild-type zebrafish embryos, this gene is expressed in the ONL as well as in the outer INL (Liu et al., 2001) (Fig. 8K); some of these crx+ cells of the INL are of the rod lineage (Nelson et al., 2008). In clo mutant embryos, a similar pattern was observed, although occasionally cells of the ONL showed gaps in crx expression (Fig. 8L).
In summary, expression patterns of critical retinal transcription factors appeared normal in clo mutant embryos during the early waves of retinal neurogenesis, around 30 hpf. However, domains of some specific transcription factors, particularly pax6a, neurod1, and to a lesser extent rx1 and crx, appeared mispatterned and/or weaker in expression at a time when the ONL becomes established.
Abnormal retinal phenotype and ectopic cones in clo mutants when cell death is blocked
We considered that some of the features of the retinal phenotype in clo−/− may be secondary to retinal cell death, particularly because of the significantly higher rate of cell death at a developmental time (54-72 hpf) when some cell types are still being generated and then are differentiating (Hu and Easter, 1999). Therefore we evaluated retinal histology in clo−/− embryos in which cell death mediated by the tumor suppressor p53 was blocked through the use of a p53-targeting antisense morpholino oligonucleotide (MO-tp53; (Plaster et al., 2006)). The clo−/−, p53-morphant retinas showed virtually no gaps in the retinal tissue, and visibly fewer pyknotic cell bodies as compared to clo−/− retinas (Fig. 9A-C), suggesting that the MO-tp53 was effective at interfering with much of the retinal cell death. However, clo−/−; p53-morphant retinas still showed thinned and/or disorganized plexiform layers, and nuclear layers that were reduced in thickness and disorganized as compared to wild-type retinas (Fig. 9A-C), suggesting that these aspects of the clo−/− retinal phenotype are not likely related to p53-mediated retinal cell death. Interestingly, the lens phenotype of clo mutants was partially rescued in the p53 morphants; the tissue gaps between the lens epithelium and developing lens fibers were not evident, but the concentric lens fibers themselves did not appear to be differentiated and still contained nuclei (Fig. 9A-C).
Figure 9.

Partial rescue of clo−/− ocular phenotype by blocking cell death. A-C. Eye histology of wild-type (A) and clo−/− (B) embryos at 72 hpf, and of clo−/− embryos injected with a morpholino targeting p53 (p53 MO; C). D-F. Cell death, visualized by TUNEL staining in sections from 72 hpf embryos (E,F) is significantly reduced in p53 morphant clo−/− as compared to uninjected clo−/− (*** in D, p<0.001). Two outliers from the MO group are not included in the graph as they showed very high levels of cell death, suggesting an unsuccessful MO injection. LE, lens. Scale bar in B (applies to all images) = 50 μm.
We verified that MO-tp53 injection interfered with retinal cell death in clo mutants by performing TUNEL assays at 72 hpf. The number of TUNEL+ profiles in retinas of clo−/−;p53 morphants was significantly reduced as compared to clo−/− uninjected controls (Fig. 9D), nearly to wild-type levels (Fig. 9D-F; compare to Fig. 4C-E). Therefore, while our findings suggest that retinal and lens abnormalities in clo mutant zebrafish are not solely related to an increased rate of p53-mediated retinal cell death, we cannot completely rule out cell death as a contributing cause to the disorganized retinal phenotype.
Synaptic layers, cone photoreceptors, and Müller glia, were specifically evaluated in clo−/−;p53 morphants by immunostaining with SV2, ZPR1, and ZRF1 antibodies, respectively. SV2 immunostaining of the clo−/−;p53 morphants revealed a modest rescue effect, with better-defined IPLs as compared to those of uninjected clo mutants, but still thin IPLs as compared to wild-type retinas, and lacking an OPL (Fig. 10A-C). ZPR1 immunostaining showed that cones in clo−/−;p53 morphants appeared to remain patchy and irregular in distribution, and reduced in number as compared to wild-type cones (Fig. 10D-F). Quantification using the cone distribution categories revealed no significant rescue of the extent of ZPR1 labeling (p=0.11), but a significant rescue of the ZPR1 pattern (p<0.05), such that many of the clo−/−;p53 morphants displayed dense or discontinuous labeling patterns rather than sporadic patterns (Fig. 10G). Interestingly, the clo−/−;p53 morphants also showed ectopic ZPR1+ cells within the INL (Fig. 10F) (71% of morphants; n=14), suggesting that clo−/− retinas may develop ectopic cones that die when p53-mediated cell death is permitted. Müller glia in clo−/−;p53 morphants did not appear to be rescued in morphology or in apparent number as compared with the clo−/− Müller glia (Fig. 10H-J, also see Fig. 7B,C). The clo−/− Müller glial phenotype is therefore less likely to be related to p53-mediated cell death.
Figure 10.

Retinal phenotypes in clo−/−; p53 morphants. A-C. Anti-SV2 (synaptic vesicle 2) staining in wild type (A), clo−/− (B), and clo−/− p53 morphants (C). The organization of the IPL (inner plexiform layer) appears partially rescued in the morphant, but the thickness of this layer and the presence of the OPL (outer plexiform layer) are not rescued. D-F. ZPR1 (cone photoreceptor) staining in wild type (D), clo−/− (E), and clo−/− p53 morphants (F). Arrows in F show ectopic ZPR1+ profiles. G. The extent of ZPR1 labeling (G) is not significantly rescued in clo−/− p53 morphants (p=0.11), but the distribution of ZPR1+ cells (G‘) is significantly different in clo−/− morphant retinas as compared to clo−/− (p<0.03). H-J. ZRF1 (Müller glia) staining in wild type (H), clo−/− (I), and clo−/−p53 morphants (J), showing no rescue of the presence or morphology of Műller glia (* asterisks denotes normal location of endfeet). LE, lens. Scale bar in B (applies to all images) = 50 μm.
No evidence of hypoxia in clo mutant retinas
The absence of a cardiovascular system in cloche mutant zebrafish embryos may underlie the abnormal development of the retina and lens. Potential mechanisms include lack of material delivered by the circulating blood and/or vascular cells. The absence of circulating oxygen (O2) is an unlikely explanation, as zebrafish tissues are not dependent upon the circulation for oxygen until larval stage [6 dpf;(Pelster and Burggren, 1996)]. However, to confirm whether the absence of circulating O2 contributed to the eye phenotype, we performed in situ hybridizations for the presence of phd3 mRNA. The phd3/egln3 gene encodes prolyl hydroxylase domain containing protein 3/egl-9 family hypoxia-inducible factor 3, a cellular oxygen sensor that regulates the response to hypoxia and that is transcriptionally upregulated by hypoxia (Santhakumar et al., 2012). Cryosections derived from clo−/− mutants or wild-type embryos showed no positive hybridization signals (Fig. 11A,C), while those derived from wild-type embryos subjected to 90 minutes of hypoxia and then processed in parallel with the remaining samples, showed phd3 hybridization signal in retinal cells (Fig. 11B). Similarly, quantitative RT-PCR (qPCR) using phd3-specific primers showed that the target transcript was significantly upregulated only in experimentally hypoxic embryo tissues as compared to normoxic controls (Fig. 11D; p<0.001). Expression of phd3 in clo−/− embryos was not significantly different from expression in their phenotypically wild-type siblings (Fig. 11D; p=0.53). These results suggest that tissues of clo mutants are not hypoxic, and hence the eye phenotype of clo−/− embryos is not the consequence of hypoxia.
Figure 11.
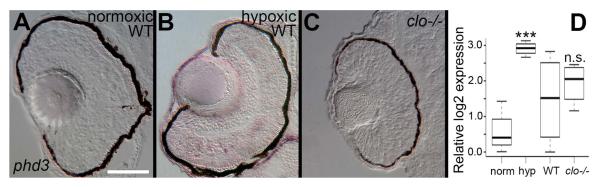
No evidence for hypoxia in cloche mutant retinas. A-C. In situ hybridization for phd3 mRNA in wild-type normoxic embryos (A), wild-type hypoxic embryos showing positive hybridization signals (B), and clo−/− embryos showing no hybridization signal (C). D. Quantitative RT-PCR of whole embryo tissues shows significant upregulation of phd3 expression (*p<0.001) in hypoxic (hyp) as compared to normoxic (norm) embryos, but not in clo−/− as compared to wild-type embryos (n.s., not significant; p=0.53). Scale bar in A (applies to all images) = 50 μm.
Discussion
The major findings of this study can be summarized as follows: 1. The embryonic clo−/− eye lacks vasculature and is microphthalmic, with defects in cell proliferation and survival, and in the generation and patterning of specific retinal cell types. 2. Retinal patterning defects in clo−/− embryos include unusual expression patterns of key retinal transcription factors, abnormal morphology of Müller glia and of synaptic layers, and ectopic cones that are revealed when cell death is blocked. 3. Retinal defects in clo−/− embryos are not entirely related to cell death, or to retinal hypoxia, or to the complete lack of microglia, and they are not secondary to lens defects. Together these findings suggest a regulatory (non-metabolic) role for the early ocular vasculature in regulating retinal neurogenesis and patterning.
Embryonic eyes of cloche mutants indeed showed a strikingly abnormal phenotype, distinct in many ways from other zebrafish microphthalmic phenotypes (Kashyap et al., 2007; Liu et al., 2007; Stenkamp et al., 2002). Defects in retinal cell proliferation and cell survival were accompanied by the presence of thinned and disorganized plexiform layers and mis-projected synaptic terminals, reduced and mispatterned retinal neurons, reduced and morphologically abnormal Müller glia, and disrupted expression of pax6a and neurod1. This phenotype suggests roles for the ocular vasculature in regulating generation, survival, migration/patterning, and morphological differentiation of distinct classes of retinal cells. The distinctive nature of this phenotype is underscored by the observation that many of its features are unrelated to cell death. Interfering with p53-mediated cell death in clo−/− embryos resulted in very little evidence of rescue other than the significant reduction of dying cells. clo−/−;p53 morphants still showed microphthlamia, thinned and irregular retinal plexiform layers, and fewer and morphologically undifferentiated Müller glia. Significantly reducing cell death also unmasked an additional phenotype, in the form of ectopic ZPR1+ cells in the INL. Together with the misregulation of expression of pax6a and neuroD1 expression in the clo−/− retina, these results are consistent with ocular vasculature playing a role in regulating one or more of the following: radial migration of cone progenitors; radial positioning of cone precursors; onset of expression of cone markers in the cone lineage; and/or suppressing expression of cone antigens in inner retinal cells. Given the presence of laminar disruptions and the lack of radially organized Müller glia, a migration or positioning defect is the most parsimonious explanation. Resolution of these alternatives will benefit from live imaging of specific retinal cell populations in the presence or absence of normal early ocular vasculature. It is possible that the hyaloid vasculature generates factors that provide apicobasal polarity information to the developing retina.
The clo−/− microphthalmic phenotype bears some resemblance to the retinal phenotype described for embryos in which migration of microglial precursors was inhibited by morpholino-mediated knockdown of expression of the colony stimulating factor 1 receptor a (csf-1r; fms) gene (Huang et al., 2012). Although numbers of mature microglia in clo−/− retina were severely reduced, it not likely that the unusual features of the clo−/− retina are solely due to this paucity of microglia. In the csf-1r morphant retinas, cell proliferation is increased, retinal layers are generated, but no neuronal cell types differentiate because cell cycle exit is impaired (Huang et al., 2012). These features are distinct from those we describe here for clo−/− retina. However, it is possible that the highly reduced number of microglia (as opposed to no microglia at all) may be involved in the generation of the clo−/− retinal phenotype. To resolve this question, we are developing alternative strategies to manipulate the early ocular vasculature without interfering with the development, migration, or maturation of microglia.
A previous report described lens defects in clo−/− embryos (both m39 and s5 alleles) (Goishi et al., 2006). These defects consisted of decreased synthesis of lens crystallin proteins beginning at 2.5 dpf, and ultimately resulting in the formation of cataracts (Goishi et al., 2006). The present study is consistent with this observation, and in addition we report cell-free gaps between the lens epithelium and the developing lens fibers (Fig. 1R), and reduced lens size/failed lens growth at 2 dpf (Fig. 1O). These defects appear later than general microphthalmia (at 30 hpf; Fig. 1M), and instead appear at the same time as the earliest histological manifestations of a retinal phenotype (48-54 hpf), suggesting that retinal defects are likely not secondary to lens defects.
The distinctive and disorganized retinal phenotype of the clo−/− embryo offers initial insights into roles for the vasculature in regulating retinal development – roles that are not related to tissue oxygenation. The pursuit of developmental vascular-retinal interactions may further reveal regulatory mechanisms important for understanding the neural progenitor niche and the progression of retinal disorders that involve the vasculature.
Experimental Procedures
Animals
Zebrafish were maintained in monitored aquatic housing units on recirculating system water at 28.5°C. Embryos were collected according to Westerfield (Westerfield, 2007), with the time of spawning considered to be zero hours postfertilization (hpf) and embryonic age timed accordingly thereafter. Embryos used for some of the histological analyses were kept transparent by incubating them in system water containing 0.003% phenothiourea (PTU) to inhibit melanin synthesis (Westerfield, 2007). All experiments using animals were approved by the University of Idaho’s Animal Care and Use Committee or by the Authority for Biological and Biomedical Models in the Hebrew University of Jerusalem. Adults carrying the cloche (clo) m39 mutation (Stainier et al., 1995) were the generous gift of Leonard Zon; those carrying the m378 mutation (Stainier et al., 1996) were kindly provided by Karina Yaniv. Crosses of heterozygous carriers were used to obtain clo−/− embryos. The clo−/− heart defect was reliably identified beginning at 29 hpf, and eye phenotypes in both clo mutant alleles were similar. For all analyses clo−/− embryos were compared to normal siblings. Tg(kdrl:EGFP)s843 has been described (Jin et al., 2005).
Visualization of early ocular vasculature
Early ocular vasculature was imaged in live embryos carrying the kdrl:EGFP transgene using a Zeiss LSM 700 confocal microscope. An additional analysis of ocular vascular development was performed by staining for the endogenous alkaline phosphatase found in developing vasculature cells, and was performed as previously described (Zoeller et al., 2008). Briefly, embryos were fixed for 1 hour in phosphate-buffered (pH 7.4) 4% paraformaldehyde in 5% sucrose at room temperature, washed in phosphate-buffered saline with 0.5% Triton X-100 (PBST), dehydrated through a methanol series and were stored at −20°C. Tissues were incubated in 100% acetone at −20°C for 30 minutes followed by washing twice in PBST at room temperature. Embryos were equilibrated in alkaline phosphatase staining solution three times for 15 minutes at room temperature. Embryos were then incubated in staining solution with nitroblue tetrazolium and 5-bromo-4-chloro-3-indolyl-phosphate (NBT-BCIP) substrates, or with Fast Red, according to the manufacturer’s instructions (Roche). The reaction was stopped by washing embryos repeatedly with PBST, and eyes were dissected manually and mounted in glycerol for viewing on a Leica DMR (for NBT-BCIP) or an Olympus Fluoview confocal microscope (for Fast Red).
Histology
Embryos were fixed in 4% paraformaldehyde overnight at 4°C, washed with PBT, dehydrated in EtOH series and embedded in JB4 resin (Polysciences, Inc.) according to manufacturer’s instructions. 4 μm sections were cut with LKB 8800 Ultratome III microtome and stained with methylene blue – azure II (Humphrey and Pittman, 1974).
Tissues were processed for immunocytochemical staining and in situ hybridization according to published protocols (Barthel and Raymond, 1990). Briefly, embryos were fixed in phosphate buffered, 4% paraformaldehyde containing 5% sucrose for one hour, washed with buffered 5% sucrose, cryoprotected overnight in buffered 20% sucrose, then embedded in a 1:2 mixture of OCT medium and 20% sucrose. Sections were cut at 5-14 μm on a Microm cryostat or Leica CM3050 S cryostat.
Morphometric analysis of eye and lens size
Live whole embryos at specific developmental stages were immobilized using 0.017% Tricaine (Sigma) and aligned for photography in a trough molded into an agarose plate. Images were captured using a Nikon stereomicroscope (Meridian Instruments, Freeland, WA) fitted with a CCD camera. For each specimen the outline of the eye and lens were traced using Photoshop CS6 (Adobe) to generate a silhouette. This silhouette was analyzed in ImageJ/FIJI (Schneider et al., 2012) in order to obtain a Feret Diameter (a method for estimating the particle diameter of potentially irregularly-shaped particles). The statistical analyses of significance (ANOVA) were performed in the R statistical environment (R Core Development Team, 2000).
Immunocytochemistry, TUNEL assays, and in situ hybridization
Fixation and preparation of embryos for immunocytochemistry and in situ hybridization were performed as previously described (Barthel and Raymond, 1990; Nelson et al., 2008; Stevens et al., 2011). The following antibodies were used: mouse monoclonal ZPR1, labels red- and green-sensitive cones (Larison and Bremiller, 1990) (1:500; Zebrafish International Research Center; ZIRC); mouse monoclonal ZN8, labels embryonic retinal ganglion cells (Hu and Easter, 1999) (1:500; ZIRC); mouse monoclonal ZRF1, labels Müller glia (Marcus and Easter, 1995) (1:20; ZIRC); rabbit polyclonal anti-GFP (1:1000; Torrey Pines Biolabs), mouse monoclonal 1D1, labels rod opsin (Fadool, 2003) (1:100; the gift of James Fadool, Florida State University); mouse monoclonal anti-HuC/D, labels RGCs and amacrine cells (1:200; Developmental Studies Hybridoma Bank); rabbit polyclonal anti-protein kinase C (PKC), labels a subpopulation of retinal bipolar cells (1:200; Santa Cruz Biotechnologies); mouse monoclonal anti-phosphohistone 3 (PH-3; 1:1000; Cell Signaling Technologies); mouse monoclonal anti-synaptic vesicle 2 (SV2; 1:2000; Developmental Studies Hybridoma Bank); mouse monoclonal anti-cleaved caspase 3 (CC3; 1:200; Abcam); mouse monoclonal 4C4, labels microglia (Raymond et al., 2006) (1:200; gift of Peter Hitchcock, University of Michigan). Immunocytochemistry was performed as described (Stevens et al., 2011). Primary antibodies were detected with an Alexa Fluor 647 or Cy3 or fluorescein-conjugated secondary antibody (Jackson Immunoresearch) at 1:200 or 1:500 and samples were mounted with VectaShield containing DAPI (Vector Labs).
TUNEL assays were performed using fluorescein tagged in situ cell death detection kit (Roche), according to the manufacturer’s instructions.
In situ hybridization was performed as previously described for cryosections (Nelson et al., 2008; Stevens et al., 2011) and for whole mounts (Stenkamp and Frey, 2003). Digoxigenin-labeled cRNA probes were generated by in vitro reverse transcription from plasmids containing the following cDNAs: zebrafish pax6a and crx (gifts of P. Raymond), rx1 (gift of P. Mathers), NeuroD (gift of P. Hitchcock), atoh7/ath5 (gift of S. Wilson), six3b (Kobayashi et al., 1998), and phd3/elgn3 (BioScience Life Sciences).
Quantification of labeling by antibodies
Images of immunologically-labeled histological sections were captured using a Leica DMR compound microscope with a SPOT camera system (Diagnostic Instruments). Fluorescently-labeled tissues were viewed using epifluorescence or using Zeiss LSM 700 confocal microscope. Specific cell types were analyzed as follows: Rod photoreceptors: 1D1 labeling was quantified by counting in each section the number of labeled cells located dorsal to the optic nerve. All cells ventral to the optic nerve were considered part of the “ventral patch” of rods where the density of rod photoreceptors prevented accurate counting (Raymond et al., 1995; Stevens et al., 2011). The total number of rods was then divided by the number of sections counted to determine the average number of rods per section. Cone photoreceptors: Two scores were used. The first score was based on the extent of labeling in each sample, and included three categories (None = no labeled cells; Few = 1 to 10 labeled cells; Many > 10 labeled cells). The second score, applied only to samples scored as Few or Many, was based on the pattern of ZPR1 staining (Sporadic = large gaps between the labeled cells; Discontinuous = 1 to 2 unlabeled cells in between; Dense = no unlabeled gaps between the labeled cells) (Kashyap et al., 2011; Nelson et al., 2009). Ganglion cell layer: The ganglion cell layer (GCL) was detected using the antibody ZN-8 (Hu and Easter, 1999). The volume of the GCL for each eye was estimated as follows: In all images of ZN8 labeling the area representing the GCL was traced digitally using Photoshop CS6. The area of each resulting silhouette was determined using ImageJ/FIJI (Schneider et al., 2012). The area of each section was multiplied by the section thickness in order to determine the volume and these results were summed for all sections in order to estimate the volume of the GCL. PH3 labeling. Nuclei positive for PH3 were counted in order to estimate the number of cells undergoing mitosis. Fragmentary labeling for PH-3 due to sections cutting through only a small part of a mitotic nucleus was avoided by counting only labeled nuclei above 7 μm in diameter size, considered to represent the whole nucleus. DAPI+ nuclei in the retina were also counted in these experiments. CC3 and TUNEL labeling. Cellular profiles positive for CC3 of TUNEL were counted to estimate the number of cells undergoing apoptosis in sections; we counted CC3+ or TUNEL+ fragments in embryonic hemi-brains and retinas. Double-counting of cell fragments derived from the same cell was avoided by counting only labeled profiles above 3 μm in diameter, and performing counts on sections separated by 10 μM. 4C4 labeling. Numbers of 4C4+ cell clusters were counted to assess the presence of mature microglia. Double-counting of clusters was avoided by performing counts on sections separated by 20 μm (counting every fifth, 5-μm section).
Statistically significant differences in these measures between genotypes were determined using Student’s T-Test, performed in the R statistical environment (R Core Development Team, 2000), or Fisher’s exact test in the case of proportional data.
Neutral red uptake and quantification
Live embryos were incubated in 2.5 μg/ml neutral red in the dark from 49-53 hpf, and were imaged as whole mounts using DIC optics, with images collected in 4-6 focal planes for each embryo, in order to sample all neutral red-labeled cells. Neutral red+ profiles were traced, and areas measured in ImageJ/FIJI on projected stacks of images representing each embryo eye.
Morpholino-mediated knockdown of p53
Antisense morpholino oligonucleotides (MO) targeting the translation start site to p53 mRNA (Plaster et al., 2006), MO4-tp53, were purchased from Gene Tools (Philomath, OR), and resuspended in water. Embryos obtained from a heterozygote cross of clo+/− zebrafish were injected at the one-cell stage with 2 ng p53 MO. clo mutant embryos in these experiments were identified by heart phenotype.
Hypoxia treatments
Hypoxic conditions were achieved using previous methods (Tucker et al., 2011). System water was filtered and then boiled to remove dissolved gasses, and then 0.2 mg/ml sodium sulfite was added, and the water was cooled under N2 gas to 28.5°C. Levels of O2 were measured with a YSI DO200 O2 meter, and were between 0.08 and 0.12 ppm O2. Embryos were incubated in airtight 250 ml flasks containing deoxygenated system water for 90 mins, and then placed individually in culture wells containing normoxic system water for 30 mins prior to tissue fixation or RNA extraction.
Quantitative RT-PCR (qPCR)
Embryos were immersed in RNALater (Life Technologies) and stored at −80° C. Total RNA from each experimental group was used to synthesize cDNA with random primers, using the High Capacity cDNA Reverse Transcription kit (Applied Biosystems, Inc. [ABI], Foster City, CA). Primer pairs for phd3 were 5′ CGCTGCGTCACCTGTATT 3′ (forward) and 5′ TAGCATACGACGGCTGAACT 3′ (reverse) (Santhakumar et al., 2012). Primer pairs for 18s were 5′ GAACGCCACTTGTCCCTCTA 3′ (forward) and 5′ GTTGGTGGAGCGATTTGTCT 3′ (reverse) (Sherpa et al., 2014). Amplification was carried out using a model 7900HT Fast Real-Time PCR System, and SYBR-Green PCRMaster Mix (ABI). Gene expression was quantified as relative levels between control and experimental treatments, using the 18s ribosomal RNA as the endogenous reference.
Bullet points.
• The embryonic cloche−/− eye lacks vasculature and displays numerous retinal defects.
• Retinal defects in cloche mutants include abnormal generation, patterning, and morphology of specific cell types.
• Retinal transcription factors show unusual patterns of expression in cloche mutants.
• The retinal defects in cloche−/− embryos are not entirely related to cell death, or to retinal hypoxia, or to the complete lack of microglia, and they are not secondary to lens defects.
• These findings are consistent with a role for the early ocular vasculature in regulating retinal neurogenesis and patterning.
Acknowledgments
The authors are grateful to Ms. Ann Norton and the IBEST Optical Imaging Core (U. Idaho, supported by COBRE award P30 GM103324), the Zebrafish International Resource Center for antibodies, Leonard Zon and Karina Yaniv for the cloche lines, technical support from Carmina Gutierrez and Robert Mackin (U. Idaho), and Drs. Diana Mitchell and Pete Fuerst (U. Idaho) for helpful comments on the manuscript. This work was supported by NIH R01 EY012146 (DLS), NIH P20 GM103408 (Idaho INBRE Seed Grant to DLS and undergraduate internship to SA), NSF REU Site award DBI #1460696 (undergraduate support to CG), and Israel Science Foundation grant no. 791/09 and a Research Career Development Award from the Israel Cancer Research Fund (AI).
Grant sponsors/numbers: NIH R01 EY012146 (DLS); NIH P20 GM103408 (Idaho INBRE; DLS and SA); Israel Science Foundation grant no. 791/09 and a Research Career Development Award from the Israel Cancer Research Fund (AI).
References
- Aizawa Y, Shoichet MS. The role of endothelial cells in the retinal stem and progenitor cell niche within a 3D engineered hydrogel matrix. Biomaterials. 2012;33:5198–5205. doi: 10.1016/j.biomaterials.2012.03.062. [DOI] [PubMed] [Google Scholar]
- Alvarez Y, Cederlund ML, Cottell DC, Bill BR, Ekker SC, Torres-Vazquez J, Weinstein BM, Hyde DR, Vihtelic TS, Kennedy BN. Genetic determinants of hyaloid and retinal vasculature in zebrafish. BMC developmental biology. 2007;7:114. doi: 10.1186/1471-213X-7-114. [DOI] [PMC free article] [PubMed] [Google Scholar]
- Barthel LK, Raymond PA. Improved method for obtaining 3-microns cryosections for immunocytochemistry. The journal of histochemistry and cytochemistry : official journal of the Histochemistry Society. 1990;38:1383–1388. doi: 10.1177/38.9.2201738. [DOI] [PubMed] [Google Scholar]
- Chen S, Wang QL, Nie Z, Sun H, Lennon G, Copeland NG, Gilbert DJ, Jenkins NA, Zack DJ. Crx, a novel Otx-like paired-homeodomain protein, binds to and transactivates photoreceptor cell-specific genes. Neuron. 1997;19:1017–1030. doi: 10.1016/s0896-6273(00)80394-3. [DOI] [PubMed] [Google Scholar]
- Chuang JC, Mathers PH, Raymond PA. Expression of three Rx homeobox genes in embryonic and adult zebrafish. Mechanisms of development. 1999;84:195–198. doi: 10.1016/s0925-4773(99)00077-5. [DOI] [PubMed] [Google Scholar]
- Covassin LD, Siekmann AF, Kacergis MC, Laver E, Moore JC, Villefranc JA, Weinstein BM, Lawson ND. A genetic screen for vascular mutants in zebrafish reveals dynamic roles for Vegf/Plcg1 signaling during artery development. Developmental biology. 2009;329:212–226. doi: 10.1016/j.ydbio.2009.02.031. [DOI] [PMC free article] [PubMed] [Google Scholar]
- Easter SS, Jr., Nicola GN. The development of vision in the zebrafish (Danio rerio) Developmental biology. 1996;180:646–663. doi: 10.1006/dbio.1996.0335. [DOI] [PubMed] [Google Scholar]
- Fadool JM. Development of a rod photoreceptor mosaic revealed in transgenic zebrafish. Developmental biology. 2003;258:277–290. doi: 10.1016/s0012-1606(03)00125-8. [DOI] [PubMed] [Google Scholar]
- Garlipp MA, Nowak KR, Gonzalez-Fernandez F. Cone outer segment extracellular matrix as binding domain for interphotoreceptor retinoid-binding protein. The Journal of comparative neurology. 2012;520:756–769. doi: 10.1002/cne.22773. [DOI] [PMC free article] [PubMed] [Google Scholar]
- Goishi K, Shimizu A, Najarro G, Watanabe S, Rogers R, Zon LI, Klagsbrun M. AlphaA-crystallin expression prevents gamma-crystallin insolubility and cataract formation in the zebrafish cloche mutant lens. Development (Cambridge, England) 2006;133:2585–2593. doi: 10.1242/dev.02424. [DOI] [PubMed] [Google Scholar]
- Greter M, Merad M. Regulation of microglia development and homeostasis. Glia. 2013;61:121–127. doi: 10.1002/glia.22408. [DOI] [PubMed] [Google Scholar]
- Hartnett ME. Pathophysiology and mechanisms of severe retinopathy of prematurity. Ophthalmology. 2015;122:200–210. doi: 10.1016/j.ophtha.2014.07.050. [DOI] [PMC free article] [PubMed] [Google Scholar]
- Hartsock A, Lee C, Arnold V, Gross JM. In vivo analysis of hyaloid vasculature morphogenesis in zebrafish: A role for the lens in maturation and maintenance of the hyaloid. Developmental biology. 2014;394:327–339. doi: 10.1016/j.ydbio.2014.07.024. [DOI] [PMC free article] [PubMed] [Google Scholar]
- Herbomel P, Thisse B, Thisse C. Zebrafish early macrophages colonize cephalic mesenchyme and developing brain, retina, and epidermis through a M-CSF receptor-dependent invasive process. Developmental biology. 2001;238:274–288. doi: 10.1006/dbio.2001.0393. [DOI] [PubMed] [Google Scholar]
- Hitchcock PF, Macdonald RE, VanDeRyt JT, Wilson SW. Antibodies against Pax6 immunostain amacrine and ganglion cells and neuronal progenitors, but not rod precursors, in the normal and regenerating retina of the goldfish. Journal of neurobiology. 1996;29:399–413. doi: 10.1002/(SICI)1097-4695(199603)29:3<399::AID-NEU10>3.0.CO;2-4. [DOI] [PubMed] [Google Scholar]
- Hu M, Easter SS. Retinal neurogenesis: the formation of the initial central patch of postmitotic cells. Developmental biology. 1999;207:309–321. doi: 10.1006/dbio.1998.9031. [DOI] [PubMed] [Google Scholar]
- Huang T, Cui J, Li L, Hitchcock PF, Li Y. The role of microglia in the neurogenesis of zebrafish retina. Biochemical and biophysical research communications. 2012;421:214–220. doi: 10.1016/j.bbrc.2012.03.139. [DOI] [PMC free article] [PubMed] [Google Scholar]
- Humphrey CD, Pittman FE. A simple methylene blue-azure II-basic fuchsin stain for epoxy-embedded tissue sections. Stain technology. 1974;49:9–14. doi: 10.3109/10520297409116929. [DOI] [PubMed] [Google Scholar]
- Jin SW, Beis D, Mitchell T, Chen JN, Stainier DY. Cellular and molecular analyses of vascular tube and lumen formation in zebrafish. Development (Cambridge, England) 2005;132:5199–5209. doi: 10.1242/dev.02087. [DOI] [PubMed] [Google Scholar]
- Kashyap B, Frederickson LC, Stenkamp DL. Mechanisms for persistent microphthalmia following ethanol exposure during retinal neurogenesis in zebrafish embryos. Visual neuroscience. 2007;24:409–421. doi: 10.1017/S0952523807070423. [DOI] [PMC free article] [PubMed] [Google Scholar]
- Kashyap B, Frey RA, Stenkamp DL. Ethanol-induced microphthalmia is not mediated by changes in retinoic acid or sonic hedgehog signaling during retinal neurogenesis. Alcoholism, clinical and experimental research. 2011;35:1644–1661. doi: 10.1111/j.1530-0277.2011.01511.x. [DOI] [PMC free article] [PubMed] [Google Scholar]
- Kaufman R, Weiss O, Sebbagh M, Ravid R, Gibbs-Bar L, Yaniv K, Inbal A. Development and origins of zebrafish ocular vasculature. BMC developmental biology. 2015;15:18. doi: 10.1186/s12861-015-0066-9. [DOI] [PMC free article] [PubMed] [Google Scholar]
- Kay JN, Finger-Baier KC, Roeser T, Staub W, Baier H. Retinal ganglion cell genesis requires lakritz, a Zebrafish atonal Homolog. Neuron. 2001;30:725–736. doi: 10.1016/s0896-6273(01)00312-9. [DOI] [PubMed] [Google Scholar]
- Kitambi SS, McCulloch KJ, Peterson RT, Malicki JJ. Small molecule screen for compounds that affect vascular development in the zebrafish retina. Mechanisms of development. 2009;126:464–477. doi: 10.1016/j.mod.2009.01.002. [DOI] [PMC free article] [PubMed] [Google Scholar]
- Kobayashi M, Toyama R, Takeda H, Dawid IB, Kawakami K. Overexpression of the forebrain-specific homeobox gene six3 induces rostral forebrain enlargement in zebrafish. Development (Cambridge, England) 1998;125:2973–2982. doi: 10.1242/dev.125.15.2973. [DOI] [PubMed] [Google Scholar]
- Larison KD, Bremiller R. Early onset of phenotype and cell patterning in the embryonic zebrafish retina. Development (Cambridge, England) 1990;109:567–576. doi: 10.1242/dev.109.3.567. [DOI] [PubMed] [Google Scholar]
- Lawson ND, Weinstein BM. In vivo imaging of embryonic vascular development using transgenic zebrafish. Developmental biology. 2002;248:307–318. doi: 10.1006/dbio.2002.0711. [DOI] [PubMed] [Google Scholar]
- Liao W, Bisgrove BW, Sawyer H, Hug B, Bell B, Peters K, Grunwald DJ, Stainier DY. The zebrafish gene cloche acts upstream of a flk-1 homologue to regulate endothelial cell differentiation. Development (Cambridge, England) 1997;124:381–389. doi: 10.1242/dev.124.2.381. [DOI] [PubMed] [Google Scholar]
- Liu Q, Frey RA, Babb-Clendenon SG, Liu B, Francl J, Wilson AL, Marrs JA, Stenkamp DL. Differential expression of photoreceptor-specific genes in the retina of a zebrafish cadherin2 mutant glass onion and zebrafish cadherin4 morphants. Experimental eye research. 2007;84:163–175. doi: 10.1016/j.exer.2006.09.011. [DOI] [PMC free article] [PubMed] [Google Scholar]
- Liu Y, Shen Y, Rest JS, Raymond PA, Zack DJ. Isolation and characterization of a zebrafish homologue of the cone rod homeobox gene. Investigative ophthalmology & visual science. 2001;42:481–487. [PubMed] [Google Scholar]
- Lyons SE, Shue BC, Oates AC, Zon LI, Liu PP. A novel myeloid-restricted zebrafish CCAAT/enhancer-binding protein with a potent transcriptional activation domain. Blood. 2001;97:2611–2617. doi: 10.1182/blood.v97.9.2611. [DOI] [PubMed] [Google Scholar]
- Macdonald R, Barth KA, Xu Q, Holder N, Mikkola I, Wilson SW. Midline signalling is required for Pax gene regulation and patterning of the eyes. Development (Cambridge, England) 1995;121:3267–3278. doi: 10.1242/dev.121.10.3267. [DOI] [PubMed] [Google Scholar]
- Marcus RC, Easter SS., Jr. Expression of glial fibrillary acidic protein and its relation to tract formation in embryonic zebrafish (Danio rerio) The Journal of comparative neurology. 1995;359:365–381. doi: 10.1002/cne.903590302. [DOI] [PubMed] [Google Scholar]
- Masai I, Stemple DL, Okamoto H, Wilson SW. Midline signals regulate retinal neurogenesis in zebrafish. Neuron. 2000;27:251–263. doi: 10.1016/s0896-6273(00)00034-9. [DOI] [PubMed] [Google Scholar]
- Nasevicius A, Larson J, Ekker SC. Distinct requirements for zebrafish angiogenesis revealed by a VEGF-A morphant. Yeast (Chichester, England) 2000;17:294–301. doi: 10.1002/1097-0061(200012)17:4<294::AID-YEA54>3.0.CO;2-5. [DOI] [PMC free article] [PubMed] [Google Scholar]
- Nelson CM, Ackerman KM, O’Hayer P, Bailey TJ, Gorsuch RA, Hyde DR. Tumor necrosis factor-alpha is produced by dying retinal neurons and is required for Muller glia proliferation during zebrafish retinal regeneration. J Neurosci. 2013;33:6524–6539. doi: 10.1523/JNEUROSCI.3838-12.2013. [DOI] [PMC free article] [PubMed] [Google Scholar]
- Nelson SM, Frey RA, Wardwell SL, Stenkamp DL. The developmental sequence of gene expression within the rod photoreceptor lineage in embryonic zebrafish. Dev Dyn. 2008;237:2903–2917. doi: 10.1002/dvdy.21721. [DOI] [PMC free article] [PubMed] [Google Scholar]
- Nelson SM, Park L, Stenkamp DL. Retinal homeobox 1 is required for retinal neurogenesis and photoreceptor differentiation in embryonic zebrafish. Developmental biology. 2009;328:24–39. doi: 10.1016/j.ydbio.2008.12.040. [DOI] [PMC free article] [PubMed] [Google Scholar]
- Ochocinska MJ, Hitchcock PF. Dynamic expression of the basic helix-loop-helix transcription factor neuroD in the rod and cone photoreceptor lineages in the retina of the embryonic and larval zebrafish. The Journal of comparative neurology. 2007;501:1–12. doi: 10.1002/cne.21150. [DOI] [PubMed] [Google Scholar]
- Ochocinska MJ, Hitchcock PF. NeuroD regulates proliferation of photoreceptor progenitors in the retina of the zebrafish. Mechanisms of development. 2009;126:128–141. doi: 10.1016/j.mod.2008.11.009. [DOI] [PMC free article] [PubMed] [Google Scholar]
- Ottone C, Krusche B, Whitby A, Clements M, Quadrato G, Pitulescu ME, Adams RH, Parrinello S. Direct cell-cell contact with the vascular niche maintains quiescent neural stem cells. Nature cell biology. 2014;16:1045–1056. doi: 10.1038/ncb3045. [DOI] [PMC free article] [PubMed] [Google Scholar]
- Parameswaran S, Xia X, Hegde G, Ahmad I. Hmga2 regulates self-renewal of retinal progenitors. Development (Cambridge, England) 2014;141:4087–4097. doi: 10.1242/dev.107326. [DOI] [PMC free article] [PubMed] [Google Scholar]
- Pelster B, Burggren WW. Disruption of hemoglobin oxygen transport does not impact oxygen-dependent physiological processes in developing embryos of zebra fish (Danio rerio) Circulation research. 1996;79:358–362. doi: 10.1161/01.res.79.2.358. [DOI] [PubMed] [Google Scholar]
- Plaster N, Sonntag C, Busse CE, Hammerschmidt M. p53 deficiency rescues apoptosis and differentiation of multiple cell types in zebrafish flathead mutants deficient for zygotic DNA polymerase delta1. Cell death and differentiation. 2006;13:223–235. doi: 10.1038/sj.cdd.4401747. [DOI] [PubMed] [Google Scholar]
- Posner M, Skiba J, Brown M, Liang JO, Nussbaum J, Prior H. Loss of the small heat shock protein alphaA-crystallin does not lead to detectable defects in early zebrafish lens development. Experimental eye research. 2013;116:227–233. doi: 10.1016/j.exer.2013.09.007. [DOI] [PMC free article] [PubMed] [Google Scholar]
- Raymond PA, Barthel LK, Bernardos RL, Perkowski JJ. Molecular characterization of retinal stem cells and their niches in adult zebrafish. BMC developmental biology. 2006;6:36. doi: 10.1186/1471-213X-6-36. [DOI] [PMC free article] [PubMed] [Google Scholar]
- Raymond PA, Barthel LK, Curran GA. Developmental patterning of rod and cone photoreceptors in embryonic zebrafish. The Journal of comparative neurology. 1995;359:537–550. doi: 10.1002/cne.903590403. [DOI] [PubMed] [Google Scholar]
- Rutland CS, Mitchell CA, Nasir M, Konerding MA, Drexler HC. Microphthalmia, persistent hyperplastic hyaloid vasculature and lens anomalies following overexpression of VEGF-A188 from the alphaA-crystallin promoter. Molecular vision. 2007;13:47–56. [PMC free article] [PubMed] [Google Scholar]
- Santhakumar K, Judson EC, Elks PM, McKee S, Elworthy S, van Rooijen E, Walmsley SS, Renshaw SA, Cross SS, van Eeden FJ. A zebrafish model to study and therapeutically manipulate hypoxia signaling in tumorigenesis. Cancer research. 2012;72:4017–4027. doi: 10.1158/0008-5472.CAN-11-3148. [DOI] [PubMed] [Google Scholar]
- Schneider CA, Rasband WS, Eliceiri KW. NIH Image to ImageJ: 25 years of image analysis. Nature methods. 2012;9:671–675. doi: 10.1038/nmeth.2089. [DOI] [PMC free article] [PubMed] [Google Scholar]
- Shen Q, Goderie SK, Jin L, Karanth N, Sun Y, Abramova N, Vincent P, Pumiglia K, Temple S. Endothelial cells stimulate self-renewal and expand neurogenesis of neural stem cells. Science (New York, N.Y. 2004;304:1338–1340. doi: 10.1126/science.1095505. [DOI] [PubMed] [Google Scholar]
- Sherpa T, Lankford T, McGinn TE, Hunter SS, Frey RA, Sun C, Ryan M, Robison BD, Stenkamp DL. Retinal regeneration is facilitated by the presence of surviving neurons. Developmental neurobiology. 2014;74:851–876. doi: 10.1002/dneu.22167. [DOI] [PMC free article] [PubMed] [Google Scholar]
- Shin ES, Sorenson CM, Sheibani N. Diabetes and retinal vascular dysfunction. Journal of ophthalmic & vision research. 2014;9:362–373. doi: 10.4103/2008-322X.143378. [DOI] [PMC free article] [PubMed] [Google Scholar]
- Stainier DY, Fouquet B, Chen JN, Warren KS, Weinstein BM, Meiler SE, Mohideen MA, Neuhauss SC, Solnica-Krezel L, Schier AF, Zwartkruis F, Stemple DL, Malicki J, Driever W, Fishman MC. Mutations affecting the formation and function of the cardiovascular system in the zebrafish embryo. Development (Cambridge, England) 1996;123:285–292. doi: 10.1242/dev.123.1.285. [DOI] [PubMed] [Google Scholar]
- Stainier DY, Weinstein BM, Detrich HW, 3rd, Zon LI, Fishman MC. Cloche, an early acting zebrafish gene, is required by both the endothelial and hematopoietic lineages. Development (Cambridge, England) 1995;121:3141–3150. doi: 10.1242/dev.121.10.3141. [DOI] [PubMed] [Google Scholar]
- Stenkamp DL. Neurogenesis in the fish retina. International review of cytology. 2007;259:173–224. doi: 10.1016/S0074-7696(06)59005-9. [DOI] [PMC free article] [PubMed] [Google Scholar]
- Stenkamp DL, Frey RA. Extraretinal and retinal hedgehog signaling sequentially regulate retinal differentiation in zebrafish. Developmental biology. 2003;258:349–363. doi: 10.1016/s0012-1606(03)00121-0. [DOI] [PubMed] [Google Scholar]
- Stenkamp DL, Frey RA, Mallory DE, Shupe EE. Embryonic retinal gene expression in sonic-you mutant zebrafish. Dev Dyn. 2002;225:344–350. doi: 10.1002/dvdy.10165. [DOI] [PubMed] [Google Scholar]
- Stevens CB, Cameron DA, Stenkamp DL. Plasticity of photoreceptor-generating retinal progenitors revealed by prolonged retinoic acid exposure. BMC developmental biology. 2011;11:51. doi: 10.1186/1471-213X-11-51. [DOI] [PMC free article] [PubMed] [Google Scholar]
- Tucker NR, Middleton RC, Le QP, Shelden EA. HSF1 is essential for the resistance of zebrafish eye and brain tissues to hypoxia/reperfusion injury. PloS one. 2011;6:e22268. doi: 10.1371/journal.pone.0022268. [DOI] [PMC free article] [PubMed] [Google Scholar]
- van Lookeren Campagne M, LeCouter J, Yaspan BL, Ye W. Mechanisms of age-related macular degeneration and therapeutic opportunities. The Journal of pathology. 2014;232:151–164. doi: 10.1002/path.4266. [DOI] [PubMed] [Google Scholar]
- Weiss O, Kaufman R, Michaeli N, Inbal A. Abnormal vasculature interferes with optic fissure closure in lmo2 mutant zebrafish embryos. Developmental biology. 2012;369:191–198. doi: 10.1016/j.ydbio.2012.06.029. [DOI] [PubMed] [Google Scholar]
- Westerfield M. The Zebrafish Book; A guide for the laboratory use of zebrafish (Danio rerio) University of Oregon Press; Eugene, OR: 2007. [Google Scholar]
- Xie J, Farage E, Sugimoto M, Anand-Apte B. A novel transgenic zebrafish model for blood-brain and blood-retinal barrier development. BMC developmental biology. 2010;10:76. doi: 10.1186/1471-213X-10-76. [DOI] [PMC free article] [PubMed] [Google Scholar]
- Xiong JW, Yu Q, Zhang J, Mably JD. An acyltransferase controls the generation of hematopoietic and endothelial lineages in zebrafish. Circulation research. 2008;102:1057–1064. doi: 10.1161/CIRCRESAHA.107.163907. [DOI] [PMC free article] [PubMed] [Google Scholar]
- Zhang J, Fuhrmann S, Vetter ML. A nonautonomous role for retinal frizzled-5 in regulating hyaloid vitreous vasculature development. Investigative ophthalmology & visual science. 2008;49:5561–5567. doi: 10.1167/iovs.08-2226. [DOI] [PMC free article] [PubMed] [Google Scholar]
- Zoeller JJ, McQuillan A, Whitelock J, Ho SY, Iozzo RV. A central function for perlecan in skeletal muscle and cardiovascular development. The Journal of cell biology. 2008;181:381–394. doi: 10.1083/jcb.200708022. [DOI] [PMC free article] [PubMed] [Google Scholar]