Abstract
Background
The GATA-binding factor 6 (Gata6) gene encodes a zinc finger transcription factor that often functions as a key regulator of lineage specification during development. It is the earliest known marker of the primitive endoderm lineage in the mammalian blastocyst. During gastrulation, GATA6 is expressed in early cardiac mesoderm and definitive endoderm progenitors, and is necessary for development of specific mesoderm and endoderm-derived organs including the heart, liver, and pancreas. Furthermore, reactivation or silencing of the Gata6 locus has been associated with certain types of cancer affecting endodermal organs.
Results
We have generated a Gata6H2B-Venus knock-in reporter mouse allele for the purpose of labeling GATA6-expressing cells with a bright nuclear-localized fluorescent marker that is suitable for live imaging at single-cell resolution.
Conclusions
Expression of the Venus reporter was characterized starting from embryonic stem (ES) cells, through mouse embryos and adult animals. The Venus reporter was not expressed in ES cells, but was activated upon endoderm differentiation. Gata6H2B-Venus/H2B-Venus homozygous embryos did not express GATA6 protein and failed to specify the primitive endoderm in the blastocyst. However, null blastocysts continued to express high levels of Venus in the absence of GATA6 protein, suggesting that early Gata6 transcription is independent of GATA6 protein expression. At early post-implantation stages of embryonic development, there was a strong correlation of Venus with endogenous GATA6 protein in endoderm and mesoderm progenitors, then later in the heart, midgut, and hindgut. However, there were discrepancies in reporter versus endogenous protein expression in certain cells, such as the body wall and endocardium. During organogenesis, detection of Venus in specific organs recapitulated known sites of endogenous GATA6 expression, such as in the lung bud epithelium, liver, pancreas, gall bladder, stomach epithelium, and vascular endothelium. In adults, Venus was observed in the lungs, pancreas, liver, gall bladder, ovaries, uterus, bladder, skin, adrenal glands, small intestine and corpus region of the stomach. Overall, Venus fluorescent protein under regulatory control of the Gata6 locus was expressed at levels that were easily visualized directly and could endure live and time-lapse imaging techniques. Venus is co-expressed with endogenous GATA6 throughout development to adulthood, and should provide an invaluable tool for examining the status of the Gata6 locus during development, as well as its silencing or reactivation in cancer or other disease states.
Electronic supplementary material
The online version of this article (doi:10.1186/s12861-015-0086-5) contains supplementary material, which is available to authorized users.
Keywords: GATA6, H2B-Venus, Reporter mice, Endoderm, Cardiac mesoderm, Live Imaging
Background
GATA-binding factor 6 (GATA6) is a member of the GATA family of zinc finger transcription factors that are characterized by their DNA binding domain [1]. GATA factors are highly conserved across vertebrate species, which include six members of the family [2, 3]. They are also evolutionarily conserved among invertebrates (D. melanogaster and C. elegans) where they participate in heart and endoderm formation [4]. In humans, de novo mutations in the Gata6 locus cause haploinsufficiency that is associated with congenital heart malformations and neonatal diabetes due to pancreatic agenesis [5–10].
During pre-implantation embryo development in mice, Gata6 is required for formation of extra-embryonic tissues [11–14]. In the early mouse blastocyst (32–64 cell stage), GATA6 protein is uniformly expressed in the inner cell mass (ICM) and trophectoderm (TE) [12, 15]. By the mid-blastocyst (64–100 cell) stage, expression of GATA6 in the ICM becomes restricted in a mosaic ‘salt-and-pepper’ pattern [15, 16] and co-localizes with GATA4 [15, 17]. At this stage, exclusive enrichment of GATA6 serves as the earliest known determinant of the primitive endoderm (PrE) lineage, which is the precursor to the parietal endoderm (ParE) and visceral endoderm (VE) [18–20]. GATA6 is necessary for PrE specification in the mouse embryo, and either GATA6 or GATA4 are sufficient to promote differentiation into extra-embryonic endoderm from embryonic stem (ES) cells [13, 14, 21, 22]. Gata6+/− heterozygotes have delayed PrE specification and a reduction in the number of cells that adopt a PrE fate at the late blastocyst stage [13, 14].
Following implantation, strong Gata6 expression continues in extra-embryonic tissues; namely the ParE which deposits Reichert’s membrane that lines the parietal yolk sac, and the allantois which will contribute blood vessels to the umbilical cord [18]. Weaker expression of Gata6 mRNA can be observed in the VE that gives rise to the visceral yolk sac and a fraction of the embryonic gut endoderm, although GATA6 protein levels in the VE are diminished by gastrulation stages [18, 19, 23, 24]. Tetraploid embryo complementation, where only the embryonic tissue was null for Gata6, demonstrated that GATA6 is indispensible for embryonic liver development [25]. Heart development in contrast does not require embryonic expression of Gata6, likely due to compensation by Gata4, which shares 90 % amino acid sequence homology with the DNA-binding domain of GATA6 [26] and is also expressed in the myocardium [25]. When both factors are conditionally deleted, cardiac progenitors are specified even though the heart does not form [27]. Gata6+/−;Gata4+/− compound heterozygotes die by E13.5 with cardiovascular anomalies [28].
After gastrulation, Gata6 is expressed in the cardiac crescent at the headfold stage (E7.75), as well as in the lateral plate mesoderm, primary and secondary heart fields, and heart tube [18, 27]. By E9.5, Gata6 expression is restricted to the heart myocardium and gut endoderm where it persists throughout development [12, 18]. Later onset of Gata6 expression during development is observed in arterial smooth muscle cells, the bladder, lung bronchi, and the urogenital ridge; none of which co-express Gata4 [18]. However, both Gata6 and Gata4 are expressed throughout the pancreatic epithelium during early specification and expansion. Then, later in development their expression domains become mutually exclusive with Gata6 restricted to cells of the endocrine pancreas [29, 30]. When either factor alone is conditionally ablated in the pancreas, only mild and non-persisting defects are observed. However, tissue-specific deletion of both GATA6 and GATA4 factors results in pancreatic agenesis [31].
In adult organs, Gata6 expression continues in the heart, lung, stomach, small intestine, liver, bladder, pancreas, adrenal glands, ovaries, and skin [18, 32–36]. Developmental expression of GATA6 is extensive in the intestinal epithelium, but later becomes exclusive to the enteroendocrine lineage of adults [37, 38]. GATA6 is also the only GATA family member that is expressed in adult vascular smooth muscle cells [32, 39]. Misregulation of GATA6 has been linked to various tumor expression profiles. Loss of GATA6 is common in ovarian cancer and may lead to de-differentiation of ovarian epithelial cancer cells and increased occurrence of aneuploidy [40]. Reduced GATA6 activity may directly impact metastatic progression of lung adenocarcinoma [41], while overexpression of GATA6 is associated with poor prognosis in esophageal adenocarcinoma [42]. In colorectal cancer, high levels of GATA6 predict the likelihood of metastasis to the liver [43], and overexpression may promote survival of oncogenic cells in gastric cancer [44]. GATA6 is also a useful marker of pediatric germ cell tumors [35].
Given the importance of Gata6 as a key regulatory factor during development as well as in particular adult organs, it would be useful to have a method of identifying and tracing the fate of Gata6 expressing cells. While other Gata6 transcriptional LacZ reporters exist [12, 45], a nuclear-localized fluorescent reporter instead would be suitable for live imaging and cell sorting. In this report, we describe a new Gata6H2B-Venus knock-in mouse line that acts as both a loss-of-function and transcriptional reporter allele. In mice, the bright nuclear-localized H2B-Venus yellow fluorescent protein reporter correlates well with endogenous GATA6 protein and recapitulates tissue-specific expression patterns from pre-implantation stages of embryonic development to adulthood. Gata6H2B-Venus will be a useful reporter for live imaging the dynamics of transcriptional activation in individual cells that are expressing, or recently have expressed Gata6. It could also be used for studies and analysis of Gata6 expression in endoderm and mesoderm lineages in mice, including the isolation of these cell populations. Furthermore, expression of Gata6H2B-Venus could be utilized to assess misregulation of the locus that may occur at the onset and/or as a consequence of disease states such as cancer.
Results and discussion
Generation of Gata6H2B-Venus knock-in reporter mice
An enhancer element located −8 kb from the Gata6 transcriptional start site is sufficient to drive expression of GATA6 in the heart and gut [46–48]. To obtain a reporter that recapitulates the full spectrum of Gata6 transcriptional control, we targeted the endogenous Gata6 locus by modification of a EUCOMM knockout-first construct [49, 50]. Specifically, we targeted H2B-Venus to the first non-coding intron of the mouse Gata6 gene, upstream of two alternative translation initiation codons located 438 bp apart from one another within Exon 2 (E2, Fig. 1a) [48]. Targeted Gata6H2B-Venus/+ ES cells were injected into mouse blastocysts to generate chimeric mice.
Fig. 1.
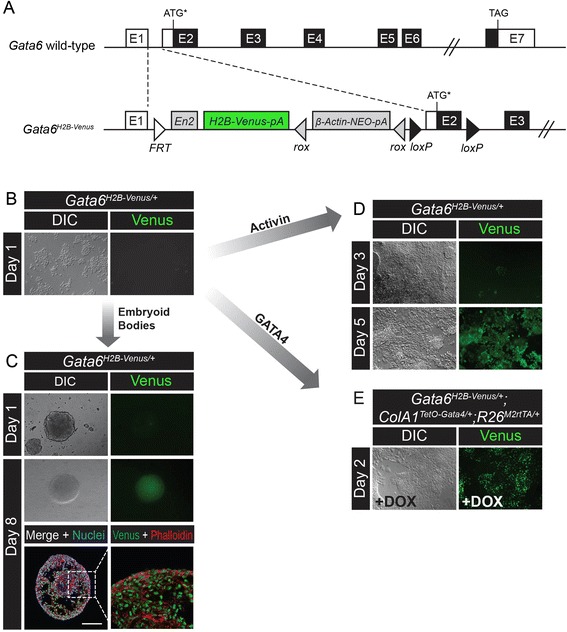
Gata6 H2B-Venus targeting strategy and reporter expression during endoderm differentiation of ES cells. a The wild-type Gata6 and targeted Gata6 H2B-Venus alleles. Exon 1–7 (E1-7), non-coding regions (white boxes), open reading frame (black boxes), Engrailed 2 (En2), Neomycin cassette (NEO), single polyadenylation sequences (pA), rox sites (grey triangles), loxP sites (black triangles), FRT site (white triangle), start codon (ATG), stop codon (TAG). Asterisk indicates that the ATG is one of two translational start sites located within Exon 2. b Gata6 H2B-Venus/+ ES cells do not express Venus while maintained in the pluripotent state in media containing serum and LIF. c Embryoid body formation from Gata6 H2B-Venus/+ ES cells. Expression of Venus occurs on the surface of embryoid bodies by Day 8. Cryosections stained with Phalloidin showed expression of Venus both on the surface and inside the embryoid bodies. Scale bar is 100 μm. d Growth factor treatment using Activin A directed Gata6 H2B-Venus/+ ES cell differentiation into the endoderm lineage resulting in upregulation of Venus by Day 5. e Overexpression of a single copy of GATA4-mCherry using the Tet-ON system in Gata6 H2B-Venus/+ ;ColA1 TetO-Gata4-mCherry/+ ;R26 M2rtTA/+ ES cells. Upon treatment with Doxycycline (DOX) for 48 h, cells were driven to differentiate towards the extraembryonic endoderm lineage resulting in activation of Venus expression. Differential interference contrast (DIC)
Expression of Venus was examined in ES cells, which normally do not express GATA6. Accordingly, the Venus reporter was not detected in pluripotent Gata6H2B-Venus/+ ES cells (Fig. 1b). To determine if Gata6H2B-Venus/+ performs faithfully as a reporter in cells, we directed the differentiation of ES cells into endoderm, which expresses Gata6, using three different methods. First, Gata6H2B-Venus/+ ES cells were cultured under conditions to promote formation of embryoid bodies, which are suspended aggregates of cells capable of differentiating into all three germ lineages. Embryoid bodies did not initially express Venus, however Venus + cells were observed by Day 8 in both endoderm cells located on the surface of the bodies as well as in mesoderm progenitors located inside (Fig. 1c). Using growth factors, we also differentiated Gata6H2B-Venus/+ ES cells into definitive endoderm. Upon treatment with Activin A, GSK3 inhibitor, and the BMP inhibitor Dorsomorphin [51], activation of Venus was seen in Gata6H2B-Venus/+ cells starting at Day 3 and increasing in frequency up to Day 5 (Fig. 1d). Finally, Gata6H2B-Venus/+ ES cells were directed to differentiate towards a PrE fate by transiently overexpressing GATA4-mCherry, making use of a single-copy Tet-ON system for inducible gene expression formed by ColA1TetO-Gata4-mCherry/+and R26M2rtTA/+ alleles present in the background of reporter ES cells [50, 52, 53]. Upon treatment with Doxycycline for 2 days, induction of GATA4-mCherry was sufficient to activate expression of Venus in Gata6H2B-Venus/+;ColA1TetO-Gata4-mCherry/+;R26M2rtTA/+ ES cells (Fig. 1e, [50]).
Expression of H2B-Venus reporter is restricted to primitive endoderm
To assess Venus expression in live embryos, Gata6H2B-Venus/+ blastocysts were collected at E3.5 and imaged over the course of 17 h by laser scanning confocal microscopy. At these stages, Venus was expressed in the ICM and TE at levels that were bright enough for live time-lapse imaging (Fig. 2a). Furthermore, differential levels of nuclear Venus signal within the ICM were detected. To assess differential expression of Venus in each blastocyst lineage, Gata6H2B-Venus/+ blastocysts were fixed at E3.5 (n = 4 embryos) and E4.5 (n = 3 embryos) and stained for endogenous GATA6 (Fig. 2b). Overall, cells that expressed Venus also expressed GATA6, mainly in the PrE. However, Venus was present in GATA6-negative cells in the ICM, possibly due to translational repression mediated by sequences present in the wild-type Gata6 mRNA but not the reporter mRNA, or as a consequence of the longer half-life of the H2B-Venus reporter compared to GATA6 protein. For example, Notch signaling reporter mice also express an H2B-Venus reporter and, in these mice, the perdurance of the reporter protein acts as a short-term lineage tracer of cells receptive to Notch signaling [54].
Fig. 2.
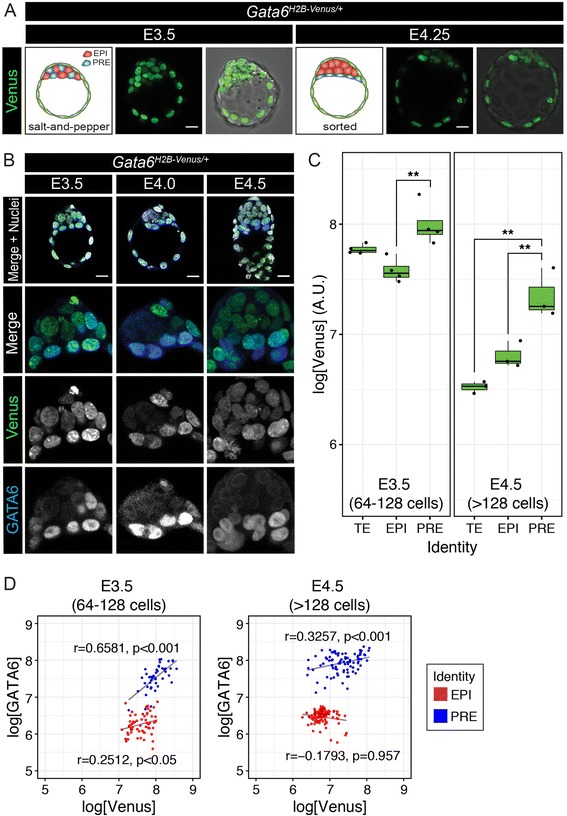
Venus and GATA6 expression in blastocyst-stage embryos. a Live imaging of Gata6 H2B-Venus/+ heterozygous blastocysts for 17 h from E3.5-E4.25. Venus is expressed both in the ICM and TE. Schematic diagram of E3.5 stage blastocyst depicts ‘salt-and-pepper’ distribution of cells fated to PrE (GATA6+, blue) and Epi (NANOG+, red), while TE is indicated as green. By E4.5, PrE and Epi cells have sorted to the exterior versus interior of the ICM, respectively. b Co-localization of Venus (green) with endogenous immunolabeled GATA6 protein (blue) in fixed Gata6 H2B-Venus/+ embryos. Nuclei are stained with Hoechst (grey). For (a) and (b), images are 5 μm projections of whole z-stacks. c Box plots showing the level of Venus expression in each blastocyst lineage (TE, Trophectoderm; EPI, Epiblast; PRE, Primitive Endoderm) in Gata6 H2B-Venus/+ heterozygous blastocysts at E3.5 and E4.5. Each dot represents the average level of Venus expression (as logarithm) for each embryo and lineage (n = 4 embryos at E3.5; n = 3 embryos at E4.5). PrE cells expressed significantly higher levels of Venus than EPI cells at both stages (ANOVA, with post-hoc Tukey’s range test; p < 0.01). d Scatter plots showing the expression of Venus and endogenous GATA6 (as logarithms) in ICM cells of all embryos at each stage (blue: PrE; red: EPI cells). Expression levels of Venus show a positive and significant correlation with those of GATA6 PrE cells (blue) at both E3.5 and E4.5. A weak correlation between Venus and GATA6 levels was observed in the EPI of E3.5 but not E4.5 embryos. Pearson’s correlation coefficient and p values are shown in the graphs next to the corresponding group. ** = p < 0.01 Scale bars = 20 μm
Perdurance of Venus may explain low-level expression that continues in the epiblast (Epi) that may be prohibitive for its use as a PrE-only reporter in the blastocyst, but could remain useful as a short-term lineage tracer. Confocal z-stacks were segmented using the nuclear segmentation algorithm MINS (Modular Interactive Nuclear Segmentation) to quantify fluorescence intensity in single cells. PrE cells (GATA6 positive) displayed significantly higher levels of Venus than Epi cells at both blastocyst stages (p < 0.01, Fig. 2c). Furthermore, we observed a highly significant correlation between the level of GATA6 and Venus protein levels in PrE cells at both E3.5 (r = 0.6581, p < 0.001) and E4.5 (r = 0.3257, p < 0.001; Fig. 2d). At E3.5, we also observed a weak, although significant correlation (r = 0.2512, p < 0.05) between the levels of GATA6 and Venus in Epi cells (Fig. 2d). The absence of correlation in Epi cells at E4.5 (r = −0.1793, p = 0.957; Fig. 2d) suggests that the correlation at E3.5 may be due to residual GATA6 protein found in Epi cells at that stage.
Gata6H2B-Venus is a loss-of-function allele
To confirm that Gata6H2B-Venus is a loss-of-function allele for endogenous GATA6, Gata6H2B-Venus/H2B-Venus blastocysts were immunostained for expression of GATA6 (labels the PrE) and NANOG (labels the Epi) at E3.5 (Fig. 3a). At this time, GATA6 and NANOG expression begin to resolve into a mutually exclusive ‘salt-and-pepper’ expression pattern defining PrE and Epi precursors respectively. This occurs prior to lineage segregation in which PrE cells are sorted to the surface while Epi cells remain in the ICM. Gata6H2B-Venus/H2B-Venus homozygous blastocysts did not express GATA6 protein and instead expressed NANOG in all ICM cells which fail to specify PrE, similar to what was observed in mutants made with other Gata6 null alleles (Fig. 3a, [13, 14]. Venus continued to be robustly expressed in the ICM in the absence of GATA6 protein, possibly due to the presence of transcriptional machinery that normally activates the Gata6 locus despite the inability to produce GATA6 protein. Alternatively, it could mean that downstream factors that typically repress the Gata6 locus are dependent on GATA6 protein. Again, MINS was employed on confocal z-stacks to quantify fluorescence intensity in single cells. As expected, Gata6H2B-Venus/+ heterozygous blastocysts had a reduced number of cells that adopted a PrE fate (Fig. 3b) [13]. The levels of Venus in Gata6H2B-Venus/H2B-Venus homozygous embryos were higher compared to Gata6H2B-Venus/+ heterozygous embryos (Fig. 3b). This could be due to bi-allelic expression of the reporter in homozygous embryos.
Fig. 3.
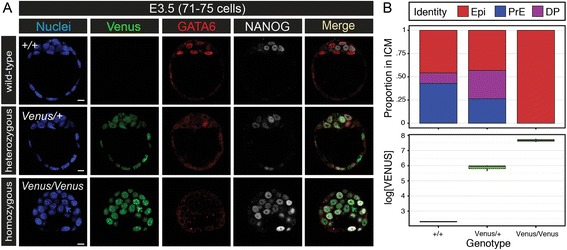
Gata6 H2B-Venus/H2B-Venus homozygous blastocysts exhibit a Gata6 null phenotype. a Immunofluorescence for GATA6 and NANOG protein in Gata6 +/+ (+/+; wild-type) Gata6 H2B-Venus/+ (Venus/+; heterozygous) and Gata6 H2B-Venus/H2B-Venus (Venus/Venus; homozygous) blastocysts at E3.5. Gata6 H2B-Venus/H2B-Venus mutants did not express GATA6 protein, and instead expressed NANOG in all ICM cells even though the reporter is transcriptionally active. Nuclei are stained with Hoechst (blue). b Quantification of cells with epiblast (EPI, NANOG+) versus PrE (PRE, GATA6+) identity at E3.5. Cells that did not adopt a clear identity were marked as double positive (DP) for both NANOG and GATA6. Gata6 H2B-Venus/H2B-Venus homozygotes did not specify PrE, and Gata6 H2B-Venus/+ heterozygotes had a relatively reduced number of cells with PrE identity and increased numbers of double positive cells with undecided identity. Gata6 H2B-Venus/H2B-Venus embryos with both alleles of the reporter, and effectively a Gata6 null, had higher levels of Venus expression compared to Gata6 H2B-Venus/+ embryos with only one reporter allele. This would suggest that GATA6 either does not regulate, or negatively feeds back on, Gata6 gene expression.
Early post-implantation expression of Gata6H2B-Venus
To assess the expression of Gata6H2B-Venus at early post-implantation stages, Gata6H2B-Venus/+ embryos were collected from E5.5 to E6.0 and immunostained for endogenous GATA6 protein.
Gata6H2B-Venus/+ embryos were morphologically indistinguishable from wild-type littermates except for their fluorescence. In wild-type embryos, GATA6 protein was expressed throughout the extraembryonic VE (exVE) and embryonic VE (emVE) at E5.5. Venus was also detected in the VE at E5.5, and optical sectioning confirmed that the reporter was not active in the Epi or extra-embryonic ectoderm (Fig. 4a). At E6.0, prior to formation of the primitive streak that is (referred to as pre-streak), expression of Venus continued in throughout the VE. Co-expression of GATA6 and Venus was observed in the emVE on the surface of the embryo, but neither were detected in the Epi or extra-embryonic ectoderm (Fig. 4b). However Venus was not activated in all GATA6+ cells of the VE, resulting in a mosaic pattern of Venus expression in the exVE (Fig. 4a) that was also evident at later stages (Figs. 4b, an Fig. 5a). One possible explanation for this observation could be that the Gata6 locus is subject to mono-allelic expression in certain tissues.
Fig. 4.
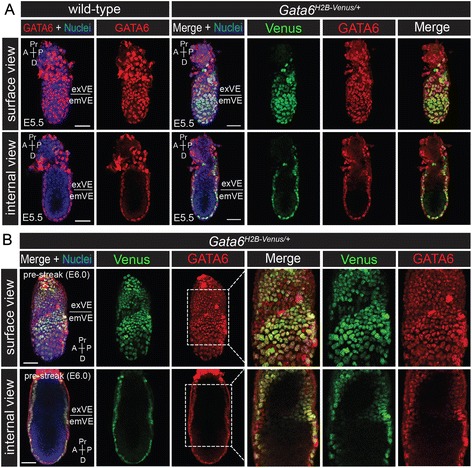
Co-expression of the Gata6 H2B-Venus reporter with endogenous GATA6 during early post-implantation development. a Wholemount immunofluorescence for endogenous GATA6 protein (red) on wild-type and Gata6 H2B-Venus/+ embryos at E5.5. Projected surface views showed that Venus and GATA6 were mostly co-localized in the VE. Corresponding projections showing internal views of the same embryos demonstrated that neither Venus nor GATA6 were expressed in the embryonic or extra-embryonic ectoderm at these stages. b Wholemount immunofluorescence for endogenous GATA6 protein (red) on Gata6 H2B-Venus/+ embryos at E6.0 (pre-streak, PS). The dashed white boxes indicate regions of higher magnification showing Venus and GATA6 expression in the VE. It should be noted that red fluorescent signal in the apical VE is likely due to non-specific binding of the GATA6 antibody to the surface of the extraembyonic tissue. Surface and internal views are renderings of z-series images. Extra-embryonic visceral endoderm (exVE), embryonic visceral endoderm (emVE), proximal (Pr), distal (D), anterior (A), posterior (P). Nuclei were stained with Hoechst (blue). Scale bars are 50 μm
Fig. 5.
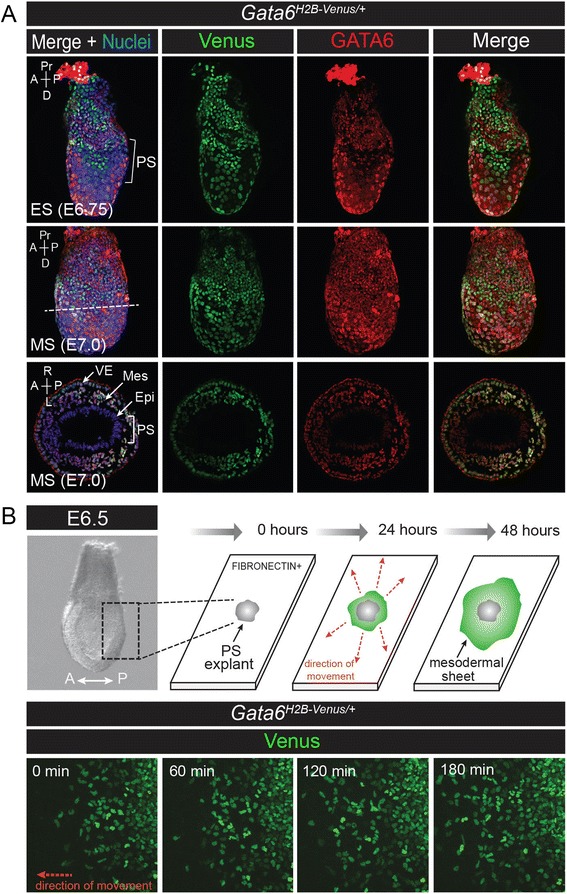
Gata6 H2B-Venus reporter is expressed in nascent endoderm and mesoderm during gastrulation. a Wholemount immunofluorescence for endogenous GATA6 protein (red) on Gata6 H2B-Venus/+ embryos at early streak (ES, E6.75) and mid-streak (MS, E7.0). Venus is expressed in a mosaic pattern in the VE. The PS region is indicated in the posterior portion of the embryo (bracket). Transverse sections through the PS at E7.0 (level of section indicated by dotted line) are shown below. GATA6 and Venus are expressed in cells that have ingressed from the PS and are migrating laterally to the anterior of the embryo. Venus and GATA6 are not expressed in the Epi, weakly expressed in the VE, and heterogenously expressed in the intervening mesodermal wings (Mes). The red fluorescent signal in the apical VE that forms a ring around the tissue section is likely due to non-specific binding of the GATA6 antibody to the surface of the extraembyonic tissue. b PS explants to track movements of migrating Venus + cells in vitro. The PS region was dissected from the posterior portion of E6.5 Gata6 H2B-Venus/+ embryos and germ layers were separated by enzymatic treatment. The PS was plated on FIBRONECTIN-coated glass chamber slides. The PS explants (grey) attach to the glass and mesenchymal cells migrate outwards to form a mesodermal sheet (green) over the course of several days. Direction of migration is indicated by red dotted arrows. Right-to-left movement (red arrow) of Venus + cells is indicated as they move away from a Gata6 H2B-Venus/+ PS explant over the course of 3 h. Images were captured every 7 min. Proximal (Pr), distal (D), anterior (A), posterior (P), right (R), left (L), primitive streak (PS), mid streak (MS). Nuclei are stained with Hoechst (blue)
Activity of Gata6H2B-Venus during gastrulation
Next, expression of Venus was characterized during gastrulation stages. Gastrulation begins at E6.25 when Epi cells in the proximal posterior portion of the embryo form the primitive streak (PS). The PS is a region characterized by an epithelial-to-mesenchymal transition whereby ingression of mesoderm and endoderm progenitors results in their migration anterolaterally to populate the space in between two apposed epithelia, the Epi and VE. At the early-streak (ES, E6.75) stage, Venus was observed in the ParE (Reichert’s membrane) upon bisection of decidua that contained Gata6H2B-Venus/+ embryos (Fig. 6a-b). Expression of Venus was mosaic in the VE at E6.75 and mid-streak (MS, E7.0) stages of Gata6H2B-Venus/+ embryos, and did not always correlate with expression of endogenous GATA6 (Fig. 5a). It is possible that expression of Gata6 mRNA and protein are dynamically changing in the VE at these stages. It is also possible that there are differences in translation regulation of Gata6 mRNA compared to the reporter mRNA which lacks the wild-type 3′UTR.
Fig. 6.
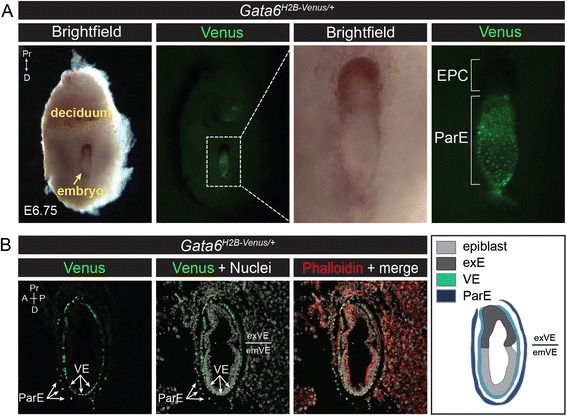
Expression of Gata6 H2B-Venus reporter in parietal endoderm. a Wholemount brightfield and fluorescence images of a bisected deciduum containing an E6.75 Gata6 H2B-Venus/+ embryo. Nuclear localized expression of Venus was observed in cells of the ParE, part of Reichert’s membrane that derives from the PrE lineage. b Bissected decidua containing Gata6 H2B-Venus/+ embryos at E6.75 were stained for Phalloidin (red) and cryosectioned. Saggital sections show expression of Venus in the ParE and VE. Schematic diagram depicts the layers of Epi (light grey), extraembryonic ectoderm (exE, dark grey), VE (light blue) and ParE (dark blue). Ectoplacental cone (EPC), parietal endoderm (ParE), visceral endoderm (VE), extraembryonic VE (exVE), embryonic VE (emVE), proximal (Pr), distal (D), anterior (A), posterior (P)
Sections through the PS region at E7.0 revealed Venus and GATA6 expression in cells that had left the Epi epithelium (Fig. 5a). These cells may represent the earliest cardiac mesoderm progenitors that will populate the primary and secondary heart fields. To visualize movement of ingressed cells in vitro, we performed PS explants that were cultured and time-lapse imaged. The posterior portion of the Epi was dissected from E6.5 embryos, treated with pancreatin/trypsin enzymatic digestion to remove the endoderm and wings of mesoderm, and then cultured on fibronectin-coated chamber slides [55, 56]. Mesoderm precursors migrated away in a centrifugal fashion thus forming what is referred to as a mesodermal sheet that surrounded the original explant. When PS explants were cultured from Gata6H2B-Venus/+ embryos, migrating cells expressed Venus, and individual nuclei could be identified and followed over time (Fig. 5b).
The next stage of development is defined by allantoic bud formation, axial extension from the node, and appearance of headfolds. At the late bud (LB, E7.5) and early headfold (EHF, E7.75) stages, Venus was expressed mosaically in the exVE and throughout the emVE. Venus, together with endogenous GATA6, was strongly expressed in the anterior definitive endoderm, cardiac crescent, and lateral plate mesoderm (Fig. 7a). Venus expression continued in the mesoderm, although it did not appear to coincide with BRACHYURY in the posterior embryonic and extra-embryonic mesoderm at the early bud (EB, E7.5) stage, indicating that Venus was labeling a specific sub-population of mesoderm and/or endoderm progenitors which was distinct from BRACHYURY labeled cells (Fig. 7b). Thus, as cells exit the primitive streak, they likely downregulate BRACHYURY and activate GATA6.
Fig. 7.
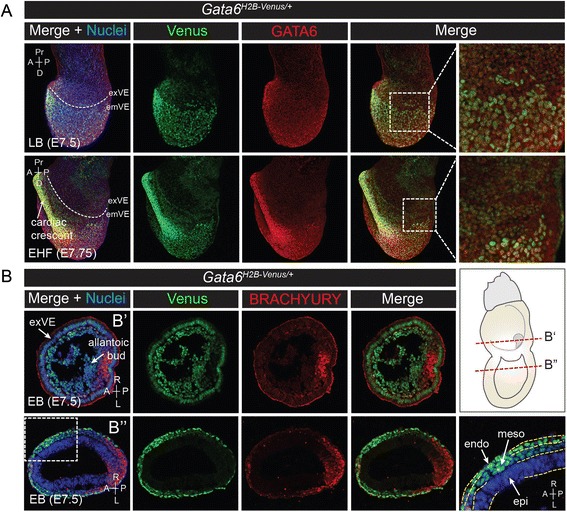
Expression of Venus yellow fluorescence at allantoic bud and headfold stages. a Wholemount immunofluorescence for GATA6 on Gata6 H2B-Venus/+ embryos at late bud (LB, E7.5) and early headfold (EHF, E7.75) stages. Venus is expressed in the surface endoderm and headfold. Dashed lines demarcate the border between exVE and emVE. Higher magnification views show low-level mosaic Venus expression in the exVE in the boxed regions. b Immunofluorescence for BRACHYURY (red) on Gata6 H2B-Venus/+ embryos at early bud (EB, E7.5) stage. Expression of Venus is observed in lateral and anterior mesoderm and endoderm and is distinct from expression of BRACHYURY. Sections through the extraembryonic region (B’, top row) and embryonic region (B”, bottom row) are indicated by dashed lines on the schematic diagram to the right. A close-up of the region within the dashed white box shows expression of Venus in the emVE and nascent mesoderm (meso), but not in the Epi. Three embryonic tissue layers (emVE, meso, epi) are delineated by dashed yellow lines. Non-nuclear red fluorescent signal that appears apically on the VE is thought to be non-specific binding of the GATA6 antibody to the surface of the extraembyonic tissue
Exclusion of Venus + endoderm cells from the midline was evident in ventral, frontal, and posterior views of Gata6H2B-Venus/+ embryos at headfold stages (E7.75) (Fig. 8a). This was confirmed by immunostaining for BRACHYURY and FOXA2, two transcription factors that are expressed along the midline at E7.75 [57]. Trace expression of Venus was detectable in the midline at early headfold (EHF) stages, likely due to perdurance. However, expression of Venus mostly did not coincide with that of BRACHYURY or FOXA2 in the midline (Fig. 8b) as well as in the streak (data not shown). At this stage (EHF), Venus was expressed in both the mesenchyme and endoderm. Expression in the endoderm was confirmed by colocalization with FOXA2 in the surface endoderm (Fig. 8c).
Fig. 8.
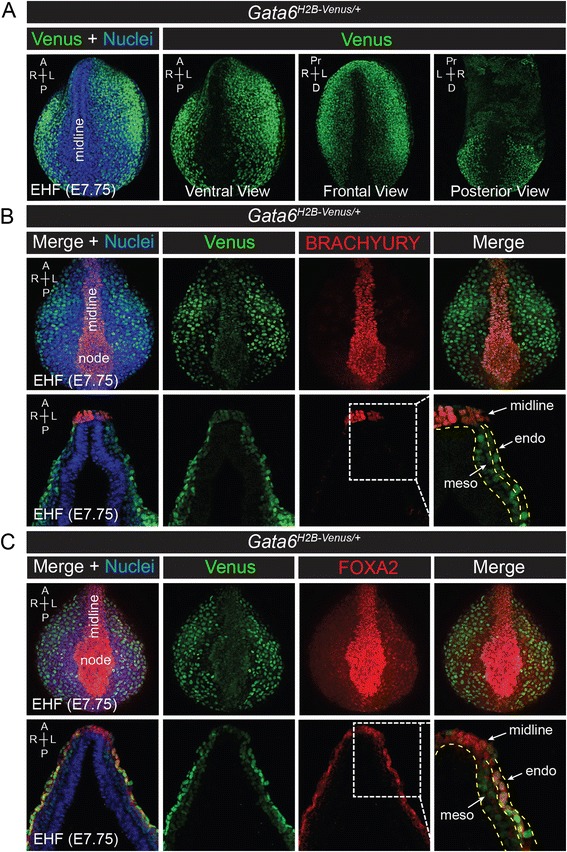
Venus is expressed in the mesoderm and endoderm on the surface of the embryo, but not in the midline. a Alternative views (ventral, frontal, posterior) depicting regions of Venus expression (green) in Gata6 H2B-Venus/+ embryos at E7.75. Venus is excluded from the midline. Surface views are renderings of z-series images. Anterior (A), posterior (P), right (R), left (L), proximal (Pr), distal (D). Nuclei are stained with Hoechst (blue). b Immunostaining for BRACHYURY (red) labels the midline in Gata6 H2B-Venus/+ embryos at E7.75. Transverse sections showing mesoderm (meso) and endoderm (endo) layers. c Immunostaining for FOXA2 (red) shows very high expression in the midline and lower levels of expression in the surface endoderm in Gata6 H2B-Venus/+ embryos at E7.75. Venus (green) coincides with FOXA2 in most cells of the surface endoderm, however it is not co-expressed in the midline. Transverse sections showing mesoderm (meso) and endoderm (endo) layers
Gata6H2B-Venus expression in later stage embryos and adults
From E8.25 (4 somite stage, ss) to E9.5 (23ss), wholemount expression of Venus was observed in the heart and gut endoderm (Fig. 9a–b). Sections through Gata6H2B-Venus/+ embryos at E8.25 revealed strong expression of the reporter in all regions of the gut, the heart myocardium, sinus venosus, and yolk sac. Weaker expression of the reporter was observed in the pharyngeal mesenchyme. There were some discrepancies between endogenous GATA6 and Venus reporter expression. For example, the endocardium and the body wall, which derives from the lateral mesoderm, expressed low levels of GATA6, but did not express Venus. Conversely, GATA6 appeared mostly downregulated in the yolk sac, although Venus reporter expression was still robust (Fig. 9c). While this may reflect delays in the activation and/or downregulation of the reporter compared to the endogenous protein, it is also possible that the reporter may be retained more strongly in cells that are not actively dividing. Similarly, faster growing tissues may dilute the reporter more rapidly.
Fig. 9.
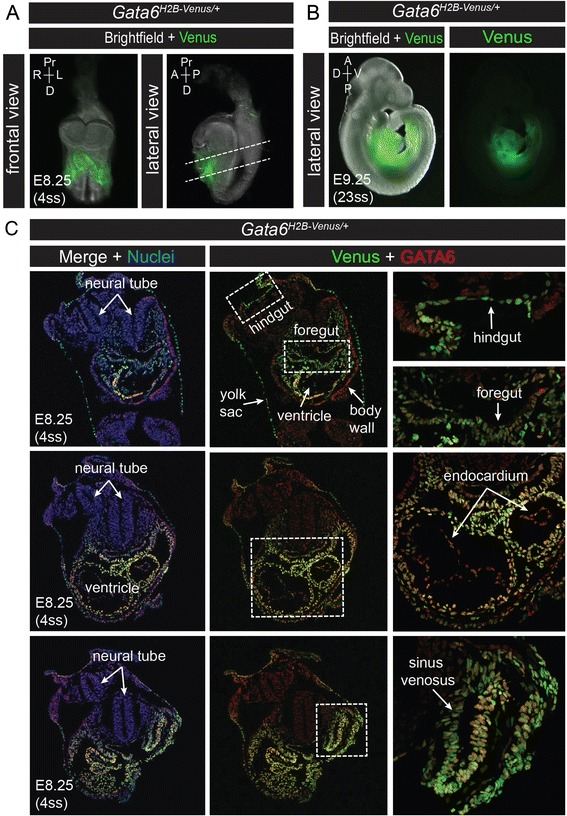
Expression of Venus at somite stages. a Frontal and lateral views of wholemount Gata6 H2B-Venus/+ embryos merged with brightfield images at E8.25 (4 somite stage, ss). Venus is expressed in the heart, sinus venosus, and gut endoderm. b Lateral views of wholemount Venus expression at E9.5 (23ss) in Gata6 H2B-Venus/+ embryos. c Immunofluorescence for GATA6 (red) on transverse sections through a Gata6 H2B-Venus/+ embryo. Varying levels of GATA6 co-expression with Venus (green) can be seen in the gut endoderm and heart. Some tissues express GATA6 exclusively, for example the body wall and endocardium, while other tissues express Venus only, such as the yolk sac and weak expression in the pharyngeal mesoderm. Nuclei are stained with Hoechst (blue)
By E12.5, expression of Venus was tissue-specific in Gata6H2B-Venus/+ embryos. Low-level expression of Venus was observed in the midgut epithelium whose derivatives express GATA6 later on, but not in the foregut or hindgut. The heart myocardium and outflow tract continued to strongly express Venus. Additional sites of expression detectable at this stage included the stomach epithelium, pancreas, kidneys, lung epithelia, liver, gall bladder, urogenital ridge, arterial endothelium, and umbilical vessels. Consistent with previous characterizations of endogenous GATA6 expression [18], Venus was not observed in certain foregut-derived organs such as the esophagus and trachea (Fig. 10).
Fig. 10.
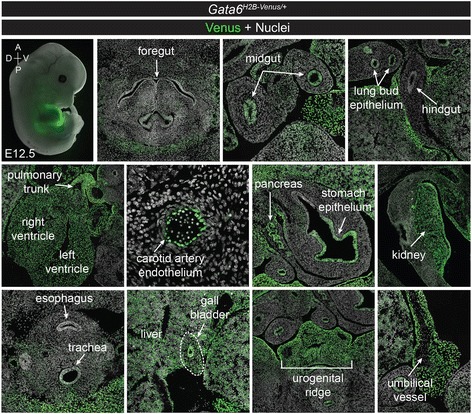
Expression of Gata6 H2B-Venus reporter at E12.5. Lateral view of a wholemount Gata6 H2B-Venus/+ embryo at E12.5 merged with brightfield (top left). Transverse sections at E12.5 showing Venus expression in various endoderm and mesoderm derived organs. Expression is observed in the midgut epithelium, but not the foregut or hindgut. Venus is also seen in the lung bud epithelium, throughout the heart and outflow tract, vascular endothelium, portions of the stomach epithelium, pancreas, kidney, liver, gall bladder, urogenital ridge and umbilical vessels. Venus was not expressed in the esophagus or trachea, Nuclei are stained with Hoechst (grey)
In Gata6H2B-Venus/+ adults, expression of Venus was observed in organs that have previously been reported to express Gata6 [18, 32–34, 39]. These include the heart, lung, pancreas, liver, gall bladder, ovaries, adrenal glands, stomach, and bladder. Strong expression of Venus within the skin was also observed (Fig. 11a). Tissue sections of organs from Gata6H2B-Venus/+ mice revealed Venus expression specifically in the mucosa and mesothelium of the corpus region of the stomach and small intestine, as well as expression within the pancreas and skin (Fig. 11b). Gata6H2B-Venus/+ heterozygous adult mice were not recovered at Mendelian ratios (105 mice in total; 44 heterozygous, 61 wild-type), suggesting that adult Gata6H2B-Venus/+ heterozygous mice may have reduced viability.
Fig. 11.
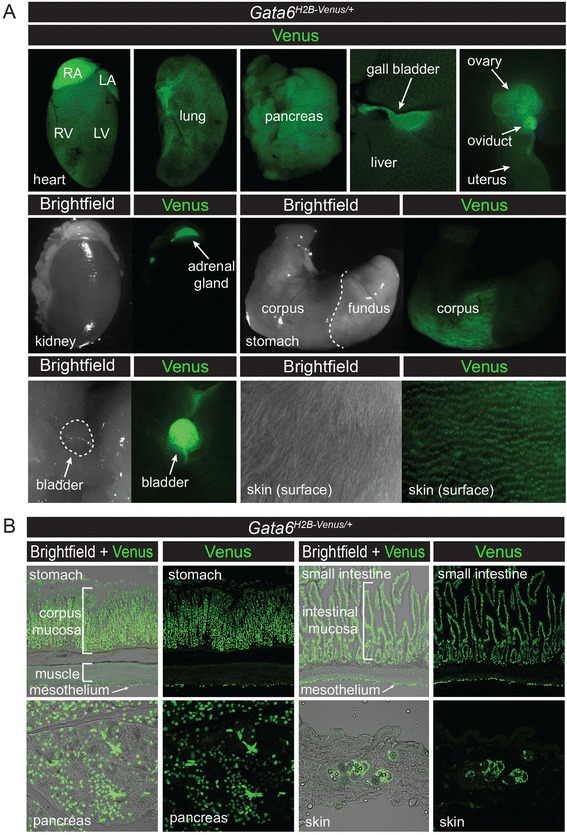
Expression of Gata6 H2B-Venus reporter in adult organs. a In Gata6 H2B-Venus/+ adult mice at 3 months of age, Venus (green) is expressed in the heart, lung, pancreas, liver, gall bladder, ovaries, oviducts, uterus, adrenal glands, corpus region of the stomach, bladder, and skin. Right atrium (RA), left atrium (LA), right ventricle (RV), left ventricle (LV). b Tissue sections through organs from Gata6 H2B-Venus/+ adult mice at 3 months of age demonstrated expression of Venus in the mucosa and mesothelium of the corpus region of the stomach and small intestine, as well as expression within the pancreas and skin
Conclusions
Our characterization of the Gata6H2B-Venus mouse line suggests that it should serve as a useful tool for single-cell resolution imaging of Gata6 transcriptional activation in vivo. Since this is also a loss-of-function allele, it can, in principle, be used in combination with a conditional (floxed) Gata6 allele to trace the fate of Gata6 (null) mutant cells after conditional Cre-mediated ablation. Bright, nuclear localization of the Venus reporter allows for direct imaging of the fluorescent protein in fixed tissue samples without the use of an antibody, and also makes this reporter suitable for live imaging and cell tracking.
Co-expression of GATA6 and Venus was well correlated in the embryo from the pre-implantation blastocyst to gastrulation and early somite stages of development. However, some differences were observed between the endogenous GATA6 protein versus the Venus-based transcriptional reporter in terms of levels and localization. For example, in Gata6H2B-Venus/H2B-Venus homozygous null blastocysts, Venus continued to report transcriptional activity in the absence of GATA6 protein. These data suggest that GATA6 does not feedback on its own transcription, and identify this transcriptional reporter as a readout of Gata6 expression in the absence of protein function. However, it is also possible that some cells normally express Gata6 mRNA that is not translated into protein. In the future, this could be determined by quantitative real-time PCR or RNA in situ hybridization to detect Gata6 transcripts in specific cells in comparison with GATA6 protein levels. Alternatively, some of these differences may be due to stability of the Venus protein, which may pose challenges for certain experiments. For example, since Gata6 is activated in all ICM cells prior to the sorting of Epi and PrE lineage progenitors into two distinct layers, then live imaging of the PrE lineage may be difficult if low levels of Venus perdure within Epi progenitors.
In post-implantation embryos, mosaic activation of the Gata6H2B-Venus reporter in the exVE at E5.5 may potentially reflect mono-allelic regulation of the Gata6 locus. This characteristic of the reporter could be utilized to investigate dynamics of the expansion of cells in the exVE at early stages of post-implantation development that lead up to gastrulation. During gastrulation, Venus brightly labels both mesoderm and endoderm progenitors and continues to be expressed in some of their derivatives, such as the cells that populate the heart field and gut endoderm. During organogenesis, Venus is expressed in a tissue - specific manner in organ primordia that normally express endogenous GATA6.
In adult mice, the Gata6H2B-Venus allele may prove useful for studies of disease states, such as cancer models, in which Gata6 activity may be aberrantly regulated. For example, the reporter may be silenced in tissues that normally express GATA6. Alternatively, the reporter may be ectopically activated and changes in its activity levels may potentially correlate with progression of disease. Gata6H2B-Venus may also be used as a bright marker of specific cell populations within adult organs, such as in the skin, stomach and small intestine.
Overall, the Gata6H2B-Venus allele should provide a useful tool for detecting transcriptional activation of the Gata6 locus that correlates well with endogenous GATA6 protein in both embryonic and adult mice, and can be used for the analysis and isolation of specific cell populations that normally express Gata6. Noting the issue of Venus perdurance, it would be of interest to re-target the Gata6 locus with a destabilized fluorescent protein reporter in order to obtain an improved dynamic readout of Gata6 transcriptional activity, and not only detect when Gata6 is activated, but also to determine when the gene is turned off. A destabilized Gata6 transcriptional reporter might be expected to be dimmer, but accordingly may provide better concordance between Gata6 gene activity and reporter protein fluorescence. For example, the Venus-NLS-PEST (VNP) fusion protein reporter [58] has a short half-life and has been successfully used to monitor the transcriptional activity of genes, such as Nanog, which are dynamically expressed [59]. Similarly, if available, a Gata6VNP allele could be useful for live quantitative imaging of the rapid changes in Gata6 expression that occur during various cell lineage specification events involving GATA6.
Methods
Mice
To make Gata6H2B-Venus mice, a targeting vector was constructed by modification of a EUCOMM knockout-first vector [49, 50]. The targeting vector contained an Engrailed 2 intron and exon with splice acceptor site upstream of the H2B-Venus fluorescent protein reporter [54, 60]. Downstream from this was placed a Neomycin cassette under the control of a human β-actin promoter, which was flanked by rox sites for Dre-mediated recombination [61]. Exon 2 was flanked by loxP sites, while an FRT site positioned upstream of the reporter remained as a remnant of the original EUCOMM knockout-first vector design. The H2B-Venus reporter and Neomycin selection cassette were targeted to Intron 1 of the mouse Gata6 gene in ES cells of a C57BL6 x 129Sv genetic background. The ES cell line was based on a previously described KH2 clone [52], in which an inducible Gata4-mCherry cDNA had previously been integrated into the Col1a1 locus [50]. Correct targeting to the Gata6 locus was determined by long-range PCR amplification of the 5’ arm junction using the LongAmp Taq PCR Kit (NEB, #e5200) and the following primers: Gata6_genomic_fwd2: CTTTGAGAGTCTACACCCTTC, R1RN_rev: TGATATCGTGGTATCGTTATGCGCCT (correctly targeted: ~5 kb product). ColA1TetO-Gata4-mCherry/+;R26M2rtTA/+;Gata6H2B-Venus/+ ES cells were cultured under standard ES cell conditions; Knockout DMEM (Life Technologies 10829), 10 % FBS (Hyclone), 1 % L-glutamine (Life Technologies 25030), 1 % non-essential amino acids (Life Technologies 11140), 1 % sodium pyruvate (Life Technologies 11360), 0.1 % β-mercaptoethanol (Life Technologies 21985), 0.01 % LIF (ESGRO, Millipore ESG1107). ColA1TetO-Gata4-mCherry/+;R26M2rtTA/+;Gata6H2B-Venus/+ ES cells from a 129Sv/C57BL6 F1 hybrid (V6.5) background were then injected into C2J blastocysts by the Memorial Sloan Kettering Cancer Center Mouse Genetics Core Facility to generate chimeric mice. All Gata6H2B-Venus/+ mice used in this study contained the Neomycin selection cassette, which has not yet been excised by crossing with Dre-expressing mice [61]. Chimeric males were crossed with CD-1 (Taconic) wild-type females and screened for germline transmission of all three targeted alleles. The Gata6H2B-Venus targeted allele was bred away from the ColA1TetO-Gata4-mCherry/+ and R26M2rtTA/+ alleles by further crosses with CD-1 wild-type females. Primers for genotyping are as follows: ColA1TetO-Gata4-mCherry, Col1a1_3’_fwd: GCACAGCATTGCGGACATGC, Col1a1_3’_Mutrev: GCAGAAGCGCGCCCGTCTGG, Col1a1_3’_WTrev: CCCTCCATGTGTGACCAAGG (300 bp wild-type band, 500 bp knock-in band); R26M2rtTA, ROSA26_int_for: AAAGTCGCTCTGAGTTGTTAT, rtTA_primer: GCGAAGAGTTTGTCCTCAACC, ROSA26_int_rev: GGAGCGGGAGAAATGGATATG (500 bp wild-type band, 300 bp knock-in band); Gata6H2B-Venus, G6V-5A-Fwd1: CCAGGGAGCTCTGAGAAAAAG, G6V-Rev: CCTTAGTCACCGCCTTCTTG, G6V-wtRev3: GTCAGTGAAGAGCAACAGGT (1 kb wild-type band, 1.2 kb knock-in band). Gata6H2B-Venus/+ mice were maintained on a mixed bred CD-1/129Sv/C57BL6/C2J background in accordance with the guidelines of the Memorial Sloan Kettering Cancer Center Institutional Animal Care and Use Committee. Mice were housed under a 12-h light/dark cycle, and the date of vaginal plug was considered to be embryonic day (E) 0.5. Blastocysts were flushed from oviducts using FHM media (Millipore). The zona pellucida was removed by short incubation in acid Tyrode’s solution (Sigma). Embryos were cultured in KSOM-AA media (Millipore) in a 5 % CO2/37 °C atmosphere for time-lapse imaging. Blastocysts were staged according to total cell number and morphology. Post-implantation embryos were dissected in DMEM/F-12 1:1 with 5 % newborn calf serum, and stages were verified using morphological landmarks (E5.5-E7.75) and somite count (E8.25-9.5) [62].
Embryonic stem cell differentiation
For embryoid body formation, ES cells were resuspended in hanging drops comprising IMDM medium (Life Technologies 12440-His 053) supplemented with 10 % Hyclone FBS, 1 % L-Glutamine, 1 % Penicillin/Streptomycin, 5 % Protein Free Hybridoma Medium II (PFMHII) (Life Technologies 12040–077), 0.5 mM Ascorbic Acid (Sigma A4403), 4.5×10⁻⁴ M Monothioglycerol (Sigma M6145), and 200 μg/mL Transferrin (Sigma T8158). 1 day later, embryoid bodies were re-plated into non-coated petri dishes and monitored over the course of 3–7 days for fluorescence. For directed differentiation into definitive endoderm using growth factors, cells were incubated in standard ES cell medium (as described above) supplemented with 1 % N-2 (Life Technologies 17502–048), 2 % B-27 (Life Technologies 17504044), and 2.5 μM Y-27632 ROCK inhibitor (Tocris 1254) for 24 h. After 24 h, media was changed to standard ESC media supplemented with 50 ng/mL E. coli Activin A (Pepro-Tech, 120-14E) and 5 nM GSK3 inhibitor XV (Calbiochem 361558). After 24 h, media was changed to standard ESC media supplemented with 2 μM Dorsomorphin (Sigma P5499) and 50 ng/mL E. coli Activin A (Pepro-Tech, 120-14E), and changed daily for 1–3 days. Transient overexpression of GATA4-mCherry was performed using Gata6H2B-Venus/+;ColA1TetO-Gata4-mCherry/+;R26M2rtTA/+ ES cells [50] incubated with 1 mg/mL Doxycycline (Sigma D9891), replaced daily for 48 h.
Image acquisition and processing
ES cells and embryoid bodies were imaged on a Zeiss Axio Vert.A1 inverted microscope with a black and white camera (Axiocam MRm). Raw data was processed using Axiovision software and dark field photos were pseudocolored green in Adobe Photoshop. Fixed blastocysts, wholemount embryos (E5.25-7.75), and tissue sections were imaged on a Zeiss LSM880 laser scanning confocal microscope. Blastocysts were imaged along the entire z-axis with 1 μm z-steps using an EC Plan-Neofluar 40×/1.30 oil immersion objective. For live imaging, blastocysts were imaged with 2 μm z-steps and with 15-min intervals. Blastocysts (on glass bottom dishes, MatTek) and PS explants (on 2 chamber coverglass, Lab-Tek) were imaged on the LSM880 inside a heated CO2 incubation chamber. Raw data was processed in Zeiss ZEN Black software. Wholemount decidua (E6.5), embryos (E8.25, E9.5, E12.5), and adult organs were imaged on a Leica M165FC dissecting microscope with a color camera (Axiocam MRc) and raw data was processed using Axiovision software.
Immunofluorescence
Blastocysts were fixed for 10 min in 4 % paraformaldehyde (PFA) at room temperature and immunostained as previously described [63]. Wholemount immunofluorescence (E5.5 to E7.75) was performed on embryos that were fixed in 4 % PFA for 20 min at room temperature followed by 3 washes in PBT (PBS/0.1 % Triton X-100) and stored at 4 °C. Embryos were permeabilized in 0.5 % Triton X-100 in PBS, then blocked in 2 % horse serum in PBT for 45 min at room temperature. Embryos were then incubated overnight in primary antibody diluted in block solution, washed 3×5 min in PBT, incubated with secondary antibody and Hoechst in blocking solution overnight, followed by washing 3×5 min in PBT then storage at 4 °C in PBS. For immunofluorescence on sections, embryoid bodies, halved decidua, and embryos were fixed in 4 % PFA for 2 h (up to E8.25) or overnight (E12.5, adult organs), then washed 3×5 min in PBT, incubated in 30 % sucrose at 4 °C overnight, then embedded in O.C.T. (TissueTek). Cryosections were cut at 12 μm thickness. Tissue sections were washed in PBS, permeabilized for 5 min in 0.5 % PBT, washed in PBS then PBT, blocked in 5 % fetal bovine serum in PBT for 1 h, incubated with primary antibody in PBT overnight, washed 3x5 min in PBT, incubated in secondary antibody and Hoechst overnight, washed 3x5min in PBT, washed in PBS, then coverslipped with Fluoromount G mounting media (Southern Biotech). Primary antibodies used were goat anti-GATA6 (R&D Systems AF1700, 1:100), rabbit anti-NANOG (Cosmo Bio, 1:500), goat anti-BRACHYURY (R&D Systems AF2085, 1:100), and rabbit anti-FOXA2 (Abcam ab40874, 1:1,000). Secondary antibodies used were Alexa Fluor donkey anti-goat 568 (Life Technologies, 1:500) and Alexa Fluor goat anti-rabbit 568 (Life Technologies, 1:500). Fixed nuclei were stained with Hoechst 33342 (Life Technologies, 1:500). Venus fluorescence was imaged directly without the use of antibodies, except for cryosections of adult tissues that were stained with rabbit anti-GFP (Abcam ab290, 1:500) and Alexa Fluor goat anti-rabbit 488 (Life Technologies, 1:500).
Quantitative analysis of reporter co-localization in pre-implantation stage embryos
Blastocyst images were segmented using the algorithm MINS (Modular Interactive Nuclear Segmentation) for fluorescence quantification (http://katlab-tools.org) [64]. Confocal z-stacks were processed with MINS for nuclear segmentation as described [65]. Fluorescence decay along the z-axis for each nuclei was corrected using a factor dependent on the position of the nucleus in z, as described [65]. PrE and Epi populations were identified manually based on the expression of GATA6 and NANOG, respectively. RStudio was the implementation of R used for all analyses. CSV file containing the raw data for Fig. 2 is provided in the Additional file 1. R-script used for analysis is available upon request. Pearson’s product moment correlation was used to assess the correlation between GATA6 and Venus levels in the PrE at each blastocyst stage. Statistical differences in Venus expression between blastocyst lineages were tested performing analysis of variance (ANOVA) on the average fluorescence level for all cells in each lineage, in each embryo (plotted in Fig. 2c). Tukey’s range test was used as the post-hoc test to determine the groups responsible for the statistical difference.
Primitive streak explants
The posterior region encompassing the primitive streak (PS) and overlying visceral endoderm was dissected from E6.5 embryos following removal of Reichert’s membrane. The tissue was then incubated for 5–10 min in 2.5 % pancreatin (Sigma) and 0.5 % trypsin (Calbiochem), and washed in PBS. The VE overlying the PS was removed by pipetting, and germ layers were further separated using Tungsten needles to remove the nascent mesodermal wings. PS explants were plated on 2-well chamber coverglass (Lab-Tek) that had been coated with FIBRONECTIN from bovine plasma (SIGMA F1141, 20 μg/mL incubated overnight at 37 °C, washed three times with PBS). Explants were cultured at 37 °C with 5 % CO2 in high-glucose DMEM supplemented with 1 % L-Glutamine, 1 % Penicillin/Streptomycin, and 10 % fetal bovine serum. Attachment of explants occurred overnight and growth of the mesodermal sheet occurred over the course of 2–3 days. Time-lapse imaging was performed on the LSM880 confocal laser scanning microscope using a CO2 incubation chamber heated to 37 °C.
Endnote
1The Gata6H2B-Venus/+ mouse line described in this report has been submitted for inclusion in The Jackson Laboratory Mouse Repository and will be made available as JAX Stock Number 028096 STOCK Gata6 < tm1(HIST1H2BB/Venus)Hadj>/J.
Acknowledgements
We thank the Memorial Sloan Kettering Mouse Genetics Core facility for the generation of germline transmitting chimeras, and Sophie Balmer, Vidur Garg, and Sophie Morgani for comments on the manuscript. We thank Catherine Lu from Rockefeller University for advice on reporter expression in skin. This work was supported by the NIH (RO1-HD052115, RO1-DK084391, and P30-CA008748), NYSTEM (N13G-236) and the Starr Foundation Tri-Institutional Stem Cell Initiative. LF was supported by an NIH Ruth L. Kirschstein postdoctoral fellowship (F32-GM115089).
Abbreviations
- ICM
Inner cell mass
- TE
Trophectoderm
- PrE
Primitive endoderm
- Epi
Epiblast
- ParE
Parietal endoderm
- VE
Visceral endoderm
- exVE
Extraembryonic VE
- emVE
Embryonic VE
- exE
Extraembryonic ectoderm
- PS
Primitive streak
- ES
Early streak
- MS
Mid-streak
- EB
Early bud
- LB
Late bud
- EHF
Early headfold
Additional file
Figure 2 raw data. (CSV 163 kb)
Footnotes
Competing interests
The authors have no competing interests to declare.
Authors’ contributions
LF, CS, AMA and AKH conceived the study. LF carried out all experiments on post-implantation embryos and adult mice. NS and NS performed experiments on pre-implantation mouse embryos. CS and SN performed experiments generating, characterizing and differentiating mouse ES cells. LF and AKH wrote the manuscript with input from all co-authors. All authors read and approved the final manuscript.
References
- 1.Maeda M, Ohashi K, Ohashi-Kobayashi A. Further extension of mammalian GATA-6. Dev Growth Differ. 2005;47(9):591–600. doi: 10.1111/j.1440-169X.2005.00837.x. [DOI] [PubMed] [Google Scholar]
- 2.Jiang Y, Evans T. The Xenopus GATA-4/5/6 genes are associated with cardiac specification and can regulate cardiac-specific transcription during embryogenesis. Dev Biol. 1996;174(2):258–270. doi: 10.1006/dbio.1996.0071. [DOI] [PubMed] [Google Scholar]
- 3.Laverriere AC, MacNeill C, Mueller C, Poelmann RE, Burch JB, Evans T. GATA-4/5/6, a subfamily of three transcription factors transcribed in developing heart and gut. J Biol Chem. 1994;269(37):23177–23184. [PubMed] [Google Scholar]
- 4.Patient RK, McGhee JD. The GATA family (vertebrates and invertebrates) Curr Opin Genet Dev. 2002;12(4):416–422. doi: 10.1016/S0959-437X(02)00319-2. [DOI] [PubMed] [Google Scholar]
- 5.Chao CS, McKnight KD, Cox KL, Chang AL, Kim SK, Feldman BJ. Novel GATA6 mutations in patients with pancreatic agenesis and congenital heart malformations. PLoS One. 2015;10(2):e0118449. doi: 10.1371/journal.pone.0118449. [DOI] [PMC free article] [PubMed] [Google Scholar]
- 6.Catli G, Abaci A, Flanagan SE, De Franco E, Ellard S, Hattersley A, et al. A novel GATA6 mutation leading to congenital heart defects and permanent neonatal diabetes: a case report. Diabetes Metab. 2013;39(4):370–374. doi: 10.1016/j.diabet.2013.01.005. [DOI] [PubMed] [Google Scholar]
- 7.De Franco E, Shaw-Smith C, Flanagan SE, Shepherd MH, International NDMC, Hattersley AT, et al. GATA6 mutations cause a broad phenotypic spectrum of diabetes from pancreatic agenesis to adult-onset diabetes without exocrine insufficiency. Diabetes. 2013;62(3):993–997. doi: 10.2337/db12-0885. [DOI] [PMC free article] [PubMed] [Google Scholar]
- 8.Gong M, Simaite D, Kuhnen P, Heldmann M, Spagnoli F, Blankenstein O, et al. Two novel GATA6 mutations cause childhood-onset diabetes mellitus, pancreas malformation and congenital heart disease. Horm Res Paediatr. 2013;79(4):250–256. doi: 10.1159/000348844. [DOI] [PubMed] [Google Scholar]
- 9.Lango Allen H, Flanagan SE, Shaw-Smith C, De Franco E, Akerman I, Caswell R, et al. GATA6 haploinsufficiency causes pancreatic agenesis in humans. Nat Genet. 2012;44(1):20–22. doi: 10.1038/ng.1035. [DOI] [PMC free article] [PubMed] [Google Scholar]
- 10.Stanescu DE, Hughes N, Patel P, De Leon DD. A novel mutation in GATA6 causes pancreatic agenesis. Pediatr Diabetes. 2015;16(1):67–70. doi: 10.1111/pedi.12111. [DOI] [PMC free article] [PubMed] [Google Scholar]
- 11.Morrisey EE, Tang Z, Sigrist K, Lu MM, Jiang F, Ip HS, et al. GATA6 regulates HNF4 and is required for differentiation of visceral endoderm in the mouse embryo. Genes Dev. 1998;12(22):3579–3590. doi: 10.1101/gad.12.22.3579. [DOI] [PMC free article] [PubMed] [Google Scholar]
- 12.Koutsourakis M, Langeveld A, Patient R, Beddington R, Grosveld F. The transcription factor GATA6 is essential for early extraembryonic development. Development. 1999;126(4):723–732. [PubMed] [Google Scholar]
- 13.Schrode N, Saiz N, Di Talia S, Hadjantonakis AK. GATA6 levels modulate primitive endoderm cell fate choice and timing in the mouse blastocyst. Dev Cell. 2014;29(4):454–467. doi: 10.1016/j.devcel.2014.04.011. [DOI] [PMC free article] [PubMed] [Google Scholar]
- 14.Bessonnard S, De Mot L, Gonze D, Barriol M, Dennis C, Goldbeter A, et al. Gata6, Nanog and Erk signaling control cell fate in the inner cell mass through a tristable regulatory network. Development. 2014;141(19):3637–3648. doi: 10.1242/dev.109678. [DOI] [PubMed] [Google Scholar]
- 15.Plusa B, Piliszek A, Frankenberg S, Artus J, Hadjantonakis AK. Distinct sequential cell behaviours direct primitive endoderm formation in the mouse blastocyst. Development. 2008;135(18):3081–3091. doi: 10.1242/dev.021519. [DOI] [PMC free article] [PubMed] [Google Scholar]
- 16.Chazaud C, Yamanaka Y, Pawson T, Rossant J. Early lineage segregation between epiblast and primitive endoderm in mouse blastocysts through the Grb2-MAPK pathway. Dev Cell. 2006;10(5):615–624. doi: 10.1016/j.devcel.2006.02.020. [DOI] [PubMed] [Google Scholar]
- 17.Kurimoto K, Yabuta Y, Ohinata Y, Ono Y, Uno KD, Yamada RG, et al. An improved single-cell cDNA amplification method for efficient high-density oligonucleotide microarray analysis. Nucleic Acids Res. 2006;34(5):e42. doi: 10.1093/nar/gkl050. [DOI] [PMC free article] [PubMed] [Google Scholar]
- 18.Morrisey EE, Ip HS, Lu MM, Parmacek MS. GATA-6: a zinc finger transcription factor that is expressed in multiple cell lineages derived from lateral mesoderm. Dev Biol. 1996;177(1):309–322. doi: 10.1006/dbio.1996.0165. [DOI] [PubMed] [Google Scholar]
- 19.Viotti M, Foley AC, Hadjantonakis AK: Gutsy moves in mice: cellular and molecular dynamics of endoderm morphogenesis. Philos Trans R Soc Lond B Biol Sci. 2014, 369(1657). doi:10.1098/rstb.2013.0547. [DOI] [PMC free article] [PubMed]
- 20.Schrode N, Xenopoulos P, Piliszek A, Frankenberg S, Plusa B, Hadjantonakis AK. Anatomy of a blastocyst: cell behaviors driving cell fate choice and morphogenesis in the early mouse embryo. Genesis. 2013;51(4):219–233. doi: 10.1002/dvg.22368. [DOI] [PMC free article] [PubMed] [Google Scholar]
- 21.Fujikura J, Yamato E, Yonemura S, Hosoda K, Masui S, Nakao K, et al. Differentiation of embryonic stem cells is induced by GATA factors. Genes Dev. 2002;16(7):784–789. doi: 10.1101/gad.968802. [DOI] [PMC free article] [PubMed] [Google Scholar]
- 22.Wamaitha SE, Del Valle I, Cho LT, Wei Y, Fogarty NM, Blakeley P, et al. Gata6 potently initiates reprograming of pluripotent and differentiated cells to extraembryonic endoderm stem cells. Genes Dev. 2015;29(12):1239–1255. doi: 10.1101/gad.257071.114. [DOI] [PMC free article] [PubMed] [Google Scholar]
- 23.Kwon GS, Viotti M, Hadjantonakis AK. The endoderm of the mouse embryo arises by dynamic widespread intercalation of embryonic and extraembryonic lineages. Dev Cell. 2008;15(4):509–520. doi: 10.1016/j.devcel.2008.07.017. [DOI] [PMC free article] [PubMed] [Google Scholar]
- 24.Cai KQ, Capo-Chichi CD, Rula ME, Yang DH, Xu XX. Dynamic GATA6 expression in primitive endoderm formation and maturation in early mouse embryogenesis. Dev Dyn. 2008;237(10):2820–2829. doi: 10.1002/dvdy.21703. [DOI] [PMC free article] [PubMed] [Google Scholar]
- 25.Zhao R, Watt AJ, Li J, Luebke-Wheeler J, Morrisey EE, Duncan SA. GATA6 is essential for embryonic development of the liver but dispensable for early heart formation. Mol Cell Biol. 2005;25(7):2622–2631. doi: 10.1128/MCB.25.7.2622-2631.2005. [DOI] [PMC free article] [PubMed] [Google Scholar]
- 26.Charron F, Nemer M. GATA transcription factors and cardiac development. Semin Cell Dev Biol. 1999;10(1):85–91. doi: 10.1006/scdb.1998.0281. [DOI] [PubMed] [Google Scholar]
- 27.Zhao R, Watt AJ, Battle MA, Li J, Bondow BJ, Duncan SA. Loss of both GATA4 and GATA6 blocks cardiac myocyte differentiation and results in acardia in mice. Dev Biol. 2008;317(2):614–619. doi: 10.1016/j.ydbio.2008.03.013. [DOI] [PMC free article] [PubMed] [Google Scholar]
- 28.Xin M, Davis CA, Molkentin JD, Lien CL, Duncan SA, Richardson JA, et al. A threshold of GATA4 and GATA6 expression is required for cardiovascular development. Proc Natl Acad Sci U S A. 2006;103(30):11189–11194. doi: 10.1073/pnas.0604604103. [DOI] [PMC free article] [PubMed] [Google Scholar]
- 29.Decker K, Goldman DC, Grasch CL, Sussel L. Gata6 is an important regulator of mouse pancreas development. Dev Biol. 2006;298(2):415–429. doi: 10.1016/j.ydbio.2006.06.046. [DOI] [PMC free article] [PubMed] [Google Scholar]
- 30.Ketola I, Otonkoski T, Pulkkinen MA, Niemi H, Palgi J, Jacobsen CM, et al. Transcription factor GATA-6 is expressed in the endocrine and GATA-4 in the exocrine pancreas. Mol Cell Endocrinol. 2004;226(1–2):51–57. doi: 10.1016/j.mce.2004.06.007. [DOI] [PubMed] [Google Scholar]
- 31.Xuan S, Borok MJ, Decker KJ, Battle MA, Duncan SA, Hale MA, et al. Pancreas-specific deletion of mouse Gata4 and Gata6 causes pancreatic agenesis. J Clin Invest. 2012;122(10):3516–3528. doi: 10.1172/JCI63352. [DOI] [PMC free article] [PubMed] [Google Scholar]
- 32.Narita N, Heikinheimo M, Bielinska M, White RA, Wilson DB. The gene for transcription factor GATA-6 resides on mouse chromosome 18 and is expressed in myocardium and vascular smooth muscle. Genomics. 1996;36(2):345–348. doi: 10.1006/geno.1996.0472. [DOI] [PubMed] [Google Scholar]
- 33.Heikinheimo M, Ermolaeva M, Bielinska M, Rahman NA, Narita N, Huhtaniemi IT, et al. Expression and hormonal regulation of transcription factors GATA-4 and GATA-6 in the mouse ovary. Endocrinology. 1997;138(8):3505–3514. doi: 10.1210/endo.138.8.5350. [DOI] [PubMed] [Google Scholar]
- 34.Kiiveri S, Liu J, Westerholm-Ormio M, Narita N, Wilson DB, Voutilainen R, et al. Differential expression of GATA-4 and GATA-6 in fetal and adult mouse and human adrenal tissue. Endocrinology. 2002;143(8):3136–3143. doi: 10.1210/endo.143.8.8939. [DOI] [PubMed] [Google Scholar]
- 35.Siltanen S, Heikkila P, Bielinska M, Wilson DB, Heikinheimo M. Transcription factor GATA-6 is expressed in malignant endoderm of pediatric yolk sac tumors and in teratomas. Pediatr Res. 2003;54(4):542–546. doi: 10.1203/01.PDR.0000081295.56529.E9. [DOI] [PubMed] [Google Scholar]
- 36.Fang R, Olds LC, Sibley E. Spatio-temporal patterns of intestine-specific transcription factor expression during postnatal mouse gut development. Gene Expr Patterns. 2006;6(4):426–432. doi: 10.1016/j.modgep.2005.09.003. [DOI] [PubMed] [Google Scholar]
- 37.Dusing MR, Wiginton DA. Epithelial lineages of the small intestine have unique patterns of GATA expression. J Mol Histol. 2005;36(1–2):15–24. doi: 10.1007/s10735-004-2908-9. [DOI] [PubMed] [Google Scholar]
- 38.Walker EM, Thompson CA, Battle MA. GATA4 and GATA6 regulate intestinal epithelial cytodifferentiation during development. Dev Biol. 2014;392(2):283–294. doi: 10.1016/j.ydbio.2014.05.017. [DOI] [PMC free article] [PubMed] [Google Scholar]
- 39.Lepore JJ, Cappola TP, Mericko PA, Morrisey EE, Parmacek MS. GATA-6 regulates genes promoting synthetic functions in vascular smooth muscle cells. Arterioscler Thromb Vasc Biol. 2005;25(2):309–314. doi: 10.1161/01.ATV.0000152725.76020.3c. [DOI] [PubMed] [Google Scholar]
- 40.Capo-chichi CD, Cai KQ, Testa JR, Godwin AK, Xu XX. Loss of GATA6 leads to nuclear deformation and aneuploidy in ovarian cancer. Mol Cell Biol. 2009;29(17):4766–4777. doi: 10.1128/MCB.00087-09. [DOI] [PMC free article] [PubMed] [Google Scholar]
- 41.Cheung WK, Zhao M, Liu Z, Stevens LE, Cao PD, Fang JE, et al. Control of alveolar differentiation by the lineage transcription factors GATA6 and HOPX inhibits lung adenocarcinoma metastasis. Cancer Cell. 2013;23(6):725–738. doi: 10.1016/j.ccr.2013.04.009. [DOI] [PMC free article] [PubMed] [Google Scholar]
- 42.Lin L, Bass AJ, Lockwood WW, Wang Z, Silvers AL, Thomas DG, et al. Activation of GATA binding protein 6 (GATA6) sustains oncogenic lineage-survival in esophageal adenocarcinoma. Proc Natl Acad Sci U S A. 2012;109(11):4251–4256. doi: 10.1073/pnas.1011989109. [DOI] [PMC free article] [PubMed] [Google Scholar]
- 43.Shen F, Li J, Cai W, Zhu G, Gu W, Jia L, et al. GATA6 predicts prognosis and hepatic metastasis of colorectal cancer. Oncol Rep. 2013;30(3):1355–1361. doi: 10.3892/or.2013.2544. [DOI] [PubMed] [Google Scholar]
- 44.Sulahian R, Casey F, Shen J, Qian ZR, Shin H, Ogino S, et al. An integrative analysis reveals functional targets of GATA6 transcriptional regulation in gastric cancer. Oncogene. 2014;33(49):5637–5648. doi: 10.1038/onc.2013.517. [DOI] [PMC free article] [PubMed] [Google Scholar]
- 45.Remond MC, Iaffaldano G, O’Quinn MP, Mezentseva NV, Garcia V, Harris BS, et al. GATA6 reporter gene reveals myocardial phenotypic heterogeneity that is related to variations in gap junction coupling. Am J Physiol Heart Circ Physiol. 2011;301(5):H1952–1964. doi: 10.1152/ajpheart.00635.2011. [DOI] [PMC free article] [PubMed] [Google Scholar]
- 46.Sun-Wada GH, Manabe S, Yoshimizu T, Yamaguchi C, Oka T, Wada Y, et al. Upstream regions directing heart-specific expression of the GATA6 gene during mouse early development. J Biochem. 2000;127(4):703–709. doi: 10.1093/oxfordjournals.jbchem.a022660. [DOI] [PubMed] [Google Scholar]
- 47.Sun-Wada GH, Kamei Y, Wada Y, Futai M. Regulatory elements directing gut expression of the GATA6 gene during mouse early development. J Biochem. 2004;135(2):165–169. doi: 10.1093/jb/mvh019. [DOI] [PubMed] [Google Scholar]
- 48.Brewer A, Gove C, Davies A, McNulty C, Barrow D, Koutsourakis M, et al. The human and mouse GATA-6 genes utilize two promoters and two initiation codons. J Biol Chem. 1999;274(53):38004–38016. doi: 10.1074/jbc.274.53.38004. [DOI] [PubMed] [Google Scholar]
- 49.Skarnes WC, Rosen B, West AP, Koutsourakis M, Bushell W, Iyer V, et al. A conditional knockout resource for the genome-wide study of mouse gene function. Nature. 2011;474(7351):337–342. doi: 10.1038/nature10163. [DOI] [PMC free article] [PubMed] [Google Scholar]
- 50.Schröter C, Rue P, Mackenzie JP, Martinez Arias A: FGF/MAPK signaling sets the switching threshold of a mutual repressor circuit controlling cell fate decisions in ES cells. bioRxiv 2015. [DOI] [PMC free article] [PubMed]
- 51.Chen AE, Borowiak M, Sherwood RI, Kweudjeu A, Melton DA. Functional evaluation of ES cell-derived endodermal populations reveals differences between Nodal and Activin A-guided differentiation. Development. 2013;140(3):675–686. doi: 10.1242/dev.085431. [DOI] [PMC free article] [PubMed] [Google Scholar]
- 52.Beard C, Hochedlinger K, Plath K, Wutz A, Jaenisch R. Efficient method to generate single-copy transgenic mice by site-specific integration in embryonic stem cells. Genesis. 2006;44(1):23–28. doi: 10.1002/gene.20180. [DOI] [PubMed] [Google Scholar]
- 53.Shimosato D, Shiki M, Niwa H. Extra-embryonic endoderm cells derived from ES cells induced by GATA factors acquire the character of XEN cells. BMC Dev Biol. 2007;7:80. doi: 10.1186/1471-213X-7-80. [DOI] [PMC free article] [PubMed] [Google Scholar]
- 54.Nowotschin S, Xenopoulos P, Schrode N, Hadjantonakis AK. A bright single-cell resolution live imaging reporter of Notch signaling in the mouse. BMC Dev Biol. 2013;13:15. doi: 10.1186/1471-213X-13-15. [DOI] [PMC free article] [PubMed] [Google Scholar]
- 55.Ciruna B, Rossant J. FGF signaling regulates mesoderm cell fate specification and morphogenetic movement at the primitive streak. Dev Cell. 2001;1(1):37–49. doi: 10.1016/S1534-5807(01)00017-X. [DOI] [PubMed] [Google Scholar]
- 56.Rakeman AS, Anderson KV. Axis specification and morphogenesis in the mouse embryo require Nap1, a regulator of WAVE-mediated actin branching. Development. 2006;133(16):3075–3083. doi: 10.1242/dev.02473. [DOI] [PubMed] [Google Scholar]
- 57.Viotti M, Nowotschin S, Hadjantonakis AK. SOX17 links gut endoderm morphogenesis and germ layer segregation. Nat Cell Biol. 2014;16(12):1146–1156. doi: 10.1038/ncb3070. [DOI] [PMC free article] [PubMed] [Google Scholar]
- 58.Nagoshi E, Saini C, Bauer C, Laroche T, Naef F, Schibler U. Circadian gene expression in individual fibroblasts: cell-autonomous and self-sustained oscillators pass time to daughter cells. Cell. 2004;119(5):693–705. doi: 10.1016/j.cell.2004.11.015. [DOI] [PubMed] [Google Scholar]
- 59.Abranches E, Bekman E, Henrique D. Generation and characterization of a novel mouse embryonic stem cell line with a dynamic reporter of Nanog expression. PLoS One. 2013;8(3):e59928. doi: 10.1371/journal.pone.0059928. [DOI] [PMC free article] [PubMed] [Google Scholar]
- 60.Gossler A, Joyner AL, Rossant J, Skarnes WC. Mouse embryonic stem cells and reporter constructs to detect developmentally regulated genes. Science. 1989;244(4903):463–465. doi: 10.1126/science.2497519. [DOI] [PubMed] [Google Scholar]
- 61.Anastassiadis K, Fu J, Patsch C, Hu S, Weidlich S, Duerschke K, et al. Dre recombinase, like Cre, is a highly efficient site-specific recombinase in E. coli, mammalian cells and mice. Dis Model Mech. 2009;2(9–10):508–515. doi: 10.1242/dmm.003087. [DOI] [PubMed] [Google Scholar]
- 62.Downs KM, Davies T. Staging of gastrulating mouse embryos by morphological landmarks in the dissecting microscope. Development. 1993;118(4):1255–1266. doi: 10.1242/dev.118.4.1255. [DOI] [PubMed] [Google Scholar]
- 63.Frankenberg S, Shaw G, Freyer C, Pask AJ, Renfree MB. Early cell lineage specification in a marsupial: a case for diverse mechanisms among mammals. Development. 2013;140(5):965–975. doi: 10.1242/dev.091629. [DOI] [PubMed] [Google Scholar]
- 64.Lou X, Kang M, Xenopoulos P, Munoz-Descalzo S, Hadjantonakis AK. A rapid and efficient 2D/3D nuclear segmentation method for analysis of early mouse embryo and stem cell image data. Stem Cell Reports. 2014;2(3):382–397. doi: 10.1016/j.stemcr.2014.01.010. [DOI] [PMC free article] [PubMed] [Google Scholar]
- 65.Saiz N, Kang M, Schrode N, Lou X, Hadjantonakis AK. Quantitative analysis of protein expression and lineage specification in mouse preimplantation embryos. JoVE 2015, in press. [DOI] [PMC free article] [PubMed]


