

Abstract
Objective
Influenza is the most common vaccine-preventable disease in the United States; however, little is known about the burden of critical illness due to influenza virus infection. Our primary objective was to estimate the proportion of all critical illness hospitalizations that are attributable to seasonal influenza.
Design
Retrospective cohort study
Setting
Arizona, California, and Washington from January 2003 through March 2009
Patients
All adults hospitalized with critical illness, defined by ICD-9-CM diagnosis and procedure codes for acute respiratory failure, severe sepsis, or in-hospital death
Measurements
We combined the complete hospitalization discharge databases for three US states, regional influenza virus surveillance, and state census data. Using negative binomial regression models, we estimated the incidence rates of adult influenza-associated critical illness hospitalizations and compared them to all-cause event rates. We also compared modeled outcomes to ICD-9-CM-coded influenza hospitalizations to assess potential under-recognition of severe influenza disease.
Main Results
During the study period, we estimated that 26,760 influenza-associated critical illness hospitalizations (95% CI: 14,541, 47,464) occurred. The population-based incidence estimate for influenza-associated critical illness was 12.0 per 100,000 person-years (95% CI: 6.6, 21.6), or 1.3% (95%CI:0.7%, 2.3%) of all critical illness hospitalizations. During the influenza season, 3.4% (95%CI:1.9%, 5.8%) of all critical illness hospitalizations were attributable to influenza. There were only 2,612 critical illness hospitalizations with ICD-9-CM-coded influenza diagnoses, suggesting influenza is either undiagnosed or under-coded in a substantial proportion of critical illness.
Conclusions
Extrapolating our data to the 2010 US population, we estimate about 28,000 adults are hospitalized for influenza-associated critical illness annually. Influenza in many of these critically ill patients may be undiagnosed. Critical care physicians should have a high index of suspicion for influenza in the ICU, particularly when influenza is known to be circulating in their communities.
Keywords: influenza, critical care, epidemiology, statistical modeling
INTRODUCTION
In 2012, the World Health Organization (WHO) and partner institutions issued a call to action to urge public health authorities, research organizations, and the private sector to collaborate on developing and implementing a global plan to address illness caused by acute viral respiratory infections (1). The Battle against Respiratory Viruses (BRaVe) Initiative seeks to better understand the epidemiology of severe respiratory virus illness and to promote improvements in prevention, diagnostics, therapeutics, and care delivery. An important knowledge gap identified by BRaVe is the burden of critical illness due to influenza virus infection (1).
A major barrier to determining the incidence of influenza disease in the ICU is the difficulty of conducting prospective surveillance studies with laboratory confirmation of influenza virus infection in intensive care units (ICUs). Prospective surveillance for influenza in ICU’s would be prohibitively expensive and would require massive sample sizes to make robust incidence estimates. Though several case series of influenza-associated critical illness have been published since the 2009 influenza A (H1N1) pandemic, such studies lack generalizability due to methodological limitations. For example, most of these studies rely on a physician’s clinical discretion for influenza testing rather than apply standardized laboratory testing criteria (2–5). The US Centers for Disease Control and Prevention (CDC) estimates that 25–60% of all persons hospitalized with an influenza virus infection are either not tested for influenza or have false negative laboratory tests, often due to use of insensitive influenza tests (6, 7). In addition, physician recognition of influenza disease is known to be influenced by a patient’s clinical presentation and presence of underlying co-morbidities (8). When studies of influenza-associated critical illness do apply standardized laboratory testing criteria, case definitions often require documentation of fever or a radiographic infiltrate for study entry (2, 3, 9, 10). These criteria will lead to underestimates of influenza disease, as they will not capture non-pneumonia processes such as exacerbations of chronic underlying illnesses like congestive heart failure or asthma (11, 12).
In response to the WHO BrAVe Initiative’s call for studies to characterize the burden of critical illness due to influenza virus infection, we estimated the population-attributable risk of influenza-associated critical illness in three western US states. We hypothesized that influenza contributes to an important proportion of critically ill individuals in the study area.
MATERIALS AND METHODS
Study Design Overview
We briefly summarize the study design here and expand upon the methods in subsequent sections. We conducted a retrospective cohort study from 2003 to 2009 using hospitalization data and influenza surveillance data (13, 14). We used all inpatient discharge abstracts from community hospitals in the Healthcare Cost and Utilization Project (HCUP) State Inpatient Database (SID) for adults aged ≥18 years in Arizona, California, and Washington. We obtained influenza surveillance data from CDC. The primary objective was to estimate the proportion of all adult critical illness hospitalizations that are attributable to seasonal influenza. Our exposures of interest were the proportions of specimens that tested positive for influenza viruses. The primary outcome was “critical illness” which we defined by ICD-9-CM diagnosis or procedure codes (15–20). We linked the hospitalization datasets with the surveillance datasets by calendar time and geographic region. We then used regression models to estimate the frequency of influenza-associated events and compared this statistic to the total number of all-cause critical illness hospitalizations in adults, similar to methods used in other influenza burden of disease studies (21–24).
Influenza Virus Surveillance Data
CDC conducts influenza virus surveillance in the United States by collecting influenza testing data from participating WHO Collaborating Laboratories and the National Respiratory and Enteric Virus Surveillance System Laboratories (14, 25). Aggregated data are publicly available by US Federal Region. We used weekly laboratory data from January 2003 through March 2009 for US Federal Regions 9 and 10, which encompass the states in our study area (22). We collapsed the weekly surveillance data for influenza virus types and subtypes (A/H3N2, A/H1N1, and B) to create month-level database that we could link to the month-level SID. As differences in the total number of specimen collected over time can bias our model estimates, we standardized the frequency of positive laboratory tests for influenza types and subtypes by dividing the monthly count of positive tests by the number of tests performed during the influenza surveillance year, July through June of the subsequent calendar year. To assess burden of influenza-associated critical illness hospitalizations during periods of influenza circulation, in a secondary analysis we estimated the number of events in the influenza season, which we defined as the months during which >10% of influenza tests performed were positive within a region (26). We previously showed that influenza virus surveillance data correlate well with data from other US influenza surveillance systems (27), that most of the laboratory tests from Region 9 and 10 were performed in our three states of interest (20), and that aggregated Region 9 influenza surveillance data are highly correlated with Arizona-specific influenza surveillance data (20).
Hospitalization Data
The SID contains all inpatient discharge abstracts from community hospitals in participating states, which have been translated into a uniform format to facilitate multi-state comparisons and analyses (13). We used HCUP SID hospitalization data for Arizona, California, and Washington from 2003 through 2009 (8). The anonymous SID includes numerous data elements for each hospital stay, including primary and secondary diagnoses, primary and secondary procedures, admission and discharge status, patient demographics, and other information. Between 2003 and 2009 the SID for AZ, WA, CA contained 98.4% of all community hospitals, and data from over 45 non-community hospitals (e.g federal). The primary outcome for this study is “critical illness” which we defined as any hospitalizations with acute respiratory failure (15, 20), severe sepsis (16–18), or in-hospital death (See Supplemental Digital Content) (19). A hospitalization could have had codes for any combination of acute respiratory failure, severe sepsis, and/or in-hospital death, but would have been counted as only one event. Secondary outcomes were each of the critical illness component syndromes. While these outcomes may not include all critically ill influenza patients, they are common life threatening conditions that benefit from aggressive delivery of time sensitive care regardless of hospital location.
Statistical Analysis
We adapted negative binomial regression models that were developed by CDC to estimate the incidence of US influenza hospitalizations (21–24). We recently piloted this model to estimate the incidence of influenza-associated acute respiratory failure in the same states and time period as this current study (20). To assess influenza contribution to all critical illness, we aggregated acute respiratory failure events with other critical illness outcomes. Differences in influenza-associated acute respiratory failure incidence estimates from our previous study reflect changes in age groups in the current study.
We fit age-specific negative binomial regression models to monthly events in the three states of interest. We used five age categories: 18–49 years, 50–64 years, 65–74 years, 75–84 years, and ≥85 years. The model is as follows:
Where Yi represents the number of outcomes in a particular state during a particular month (t), α is equal to the population size, β1 through β4 account for secular trend, β5 through β6 account for seasonal trend, and β9 through β11 represent standardized proportion of specimens testing positive each month for influenza A (H1N1), influenza A (H3N2), and influenza B in US Federal Regions 9 and 10 in a given month.
We first fit the model to predict our primary outcome - the monthly number of critical illness events. The model accounted for the seasonality of non-influenza associated events, some of which may be associated with other respiratory pathogens and some of which are likely due to non-infectious causes. Only a small fraction of events occurring during the winter are thus attributed to influenza infections. As we were interested in the impact of seasonal influenza on critical illness, we did not include data from the 2009 influenza A (H1N1) pandemic. Using the fitted model, we then calculated the number of the influenza-associated outcomes for each influenza type/subtype as the difference between the outcomes estimated from the original data and the outcomes with the given influenza type term set to zero (the difference was set to zero when negative). To calculate the frequency of influenza-associated events, we combined the estimated monthly outcomes that were attributable to each influenza type/subtype in each state for each age category. This method assumes the influenza virus covariates are non-negative and independent of each other. Critical illness hospitalizations, either calculated (all-cause events as identified by ICD-9-CM codes) or modeled (influenza-associated events) were numerators in incidence rate calculations. Annual US census state population estimates were used as denominators to calculate population-based monthly incidence rates of outcomes (28). We then calculated population-attributable risks for influenza-associated events by dividing the modeled incidence estimates by the calculated all-cause event incidence in the same cohort. We calculated 95% confidence intervals for influenza-associated event frequencies, incidences, and population-attributable risks using the non-parametric bootstrap (29).
We conducted a sensitivity analysis to explore possible confounding by respiratory syncytial virus (RSV). While RSV is generally considered a virus that causes disease in very young children, there are limited data suggesting that RSV may also contribute to hospitalizations in the elderly (24, 26, 30–32), although few studies have identified many adult RSV cases among the critically ill (32). During the study period, RSV circulated at the same time as influenza except during the 2003–04 respiratory virus season. In that season, influenza activity began and peaked two months prior to RSV activity. We took advantage of the difference in influenza and RSV circulation to compare influenza-associated events during periods with and without RSV activity. If the incidence rates of influenza-associated critical illness hospitalizations from the primary analysis were similar to those during the period without RSV activity, we would assume that RSV had minimal impact on our modeled estimates.
This study received exempt review status from the Human Subjects Division at the University of Washington. Analyses were performed with SAS (version 9.3; Cary, NC) and R (version 3.0.1; Austria, Vienna) statistical software.
RESULTS
Hospitalizations
From January 2003 through March 2009 there were 37,443,933 hospitalizations among adults ≥18 years in Arizona, California, and Washington. Of these, 2,066,072 (5.5%) were for critical illness. Critical illness hospitalizations occurred among persons 18–49 years (14.6%), 50–64 years (21.6%), 65–74 years (19.5%), 75–84 years (26.2%), and ≥85 years (18.1%). The overall population-based incidence for critical illness hospitalizations was 924.2 per 100,000 person-years. Among all adult hospitalizations, 552,224 (1.5%) had acute respiratory failure, 1,440,406 (3.8%) had severe sepsis, and 649,414 (1.7%) were in-hospital deaths. The population-based incidence for each individual syndrome was: 247.0 per 100,000 person-years for acute respiratory failure hospitalizations; 644.3 per 100,000 person-years for severe sepsis hospitalizations; and 290.5 per 100,000 person-years for in-hospital death.
Description of Influenza Virus Surveillance
In US Federal Region 9 (AZ, CA, HI, NV) from January 5, 2003 through April 4, 2009, there were 133,043 influenza laboratory tests performed (Figure 1). Of these, 14,578 (11.0%) were positive for any influenza virus, 3,889 (2.9%) were positive for influenza A (H1N1), 7,050 (5.3%) were positive for influenza A (H3N2), and 3,639 (2.7%) were positive for influenza B. In US Federal Region 10 (AK, ID, OR, WA) during the same time period, there were 52,355 influenza tests performed (Figure 1). Of these, 6,827 (13.0%) were positive for any influenza virus, 1,453 (2.8%) were positive for influenza A (H1N1), 3,594 (6.9%) were positive for influenza A (H3N2), and 1,780 (3.4%) were positive for influenza B. The influenza season occurred annually between January to March, except in 2003–04 and 2005–06 in which the influenza season occurred in the late fall/early winter. There were positive tests for influenza in both regions during every month of the study period.
Figure 1. Positive Influenza Tests by Month and Type/Subtype, US Federal Regions 9 and 10, January 2003 through March 2009.
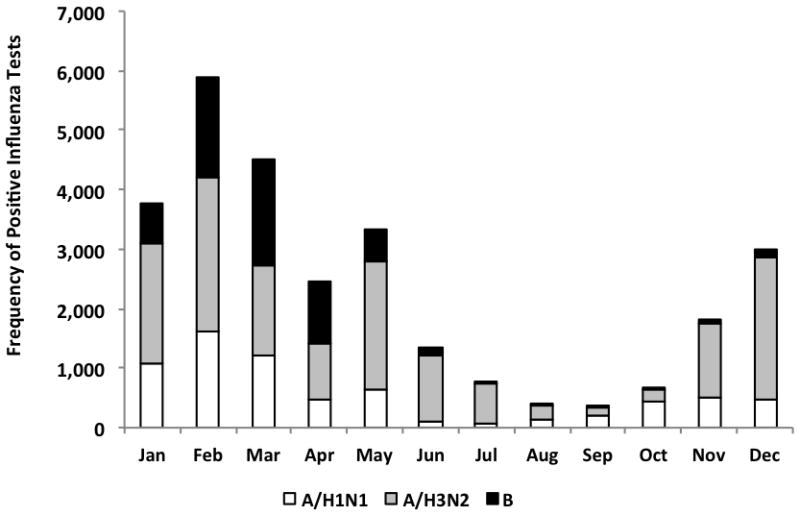
Notes:
1. US Federal Region 9 includes Arizona, California, Hawaii, and Nevada
US Federal Region 10 includes Alaska, Idaho, Oregon, and Washington
Influenza-Associated Critical Illness Hospitalizations
Using multivariable regression models, we estimated that there were 26,760 influenza-associated critical illness hospitalizations (95% CI: 14,541, 47,464) in the study area from January 2003 through March 2009 (Table 1). The population-based incidence for influenza-associated critical illness was 12.0 per 100,000 person-years (95% CI: 6.6, 21.6). Compared to the 18–49 year age group, the incidence rate ratio for influenza-associated critical illness was greater among persons 50–64 years (10.2), 65–74 years (28.9), 75–84 years (55.2), and ≥85 years (156.2). Overall, 1.3% (95%CI: 0.7%, 2.3%) of all critical illness hospitalizations were attributable to influenza, while the population-attributable risk ranged among age groups from 1.0% (95%CI: 0.4%, 2.2%) among persons 18–49 years to 1.9% (95%CI: 1.0%, 3.2%) among persons ≥85 years. During the influenza season, influenza-associated events were 3.4% (95%CI: 1.9%, 5.8%) of all critical illness hospitalizations.
Table 1.
Adult Influenza-Associated Critical illness Hospitalizationsa by Age Group; AZ, CA, and WA, January 2003 – March 2009
| Age Group (years) | Total Critical illness Hospitalizations | Person-Years | Critical illness Hospitalization Incidence Rate per 100,000 Person-Years (all cause) | Total Influenza-associated Critical illness Hospitalizations (95% Confidence Interval) | Influenza-Associated Critical illness Hospitalizations Incidence Rate per 100,000 Person-Years (95% Confidence Interval) | Population-Attributable Risk % |
|---|---|---|---|---|---|---|
| 18–49 | 301,287 | 140,843,294.8 | 213.9 | 3,161 (1,108, 6,491) | 2.2 (0.8, 4.7) | 1.0 (0.4, 2.2) |
| 50–64 | 445,953 | 48,957,998.5 | 910.9 | 4,986 (2,147, 10,257) | 10.2 (4.5, 20.7) | 1.1 (0.5, 2.3) |
| 65–74 | 402,398 | 17,372,578.0 | 2,316.3 | 5,022 (2,213, 9,253) | 28.9 (12.7, 53.5) | 1.2 (0.6, 2.3) |
| 75–84 | 541,926 | 11,864,962.5 | 4,567.4 | 6,553 (3,039, 12,759) | 55.2 (25.1, 108.7) | 1.2 (0.6, 2.4) |
| 85+ | 374,508 | 4,505,319.3 | 8,312.6 | 7,038 (3,533, 12,050) | 156.2 (79.4, 270.2) | 1.9 (1.0, 3.2) |
| All | 2,066,072 | 223,544,153.0 | 924.2 | 26,760 (14,541, 47,464) | 12.0 (6.6, 21.6) | 1.3 (0.7, 2.3) |
Notes:
Defined by ICD-9-CM Codes as in-hospital death, acute respiratory failure, or severe sepsis (See Supplemental Digital Content).
We also estimated overall incidence rates for influenza-associated acute respiratory failure hospitalizations (3.6 per 100,000 person-years; 95%CI 1.8, 6.5), severe-sepsis hospitalizations (8.8 per 100,000 person-years; 95%CI 3.9, 16.5), and in-hospital death (3.7 per 100,000 person-years; 95%CI 2.1, 7.1) (Table 2). Most influenza-associated critical illness hospitalizations had severe-sepsis (73%), while a lower proportion had acute respiratory failure (30%) or in-hospital death (31%).
Table 2.
Adult Influenza-Associated Acute Respiratory Failure Hospitalizations, Severe Sepsis Hospitalizations, and In-Hospital Deaths by Age Group; AZ, CA, and WA, January 2003 – March 2009
| Age Group (years) | Total Influenza-associated In-Hospital Death | Influenza-Associated In-Hospital Death Incidence Rate per 100,000 Person-Years | Total Influenza-associated Acute Respiratory Failurea Hospitalizations | Influenza-Associated Acute Respiratory Failurea Incidence Rate per 100,000 Person-Yearsb | Total Influenza-associated Severe Sepsisa Hospitalizations | Influenza-Associated Severe Sepsisa Incidence Rate per 100,000 Person-Years |
|---|---|---|---|---|---|---|
| 18–49 | 631 (246, 1423) | 0.4 (0.2, 1.0) | 1210 (252, 2858) | 0.9 (0.2, 2.0) | 1912 (440, 4644) | 1.4 (0.3, 3.3) |
| 50–64 | 1076 (214, 2210) | 2.2 (0.5, 4.5) | 2024 (773, 4003) | 4.1 (1.6, 8.1) | 4941 (2198, 9583) | 10.1 (4.5, 18.8) |
| 65–74 | 1264 (519, 2805) | 7.3 (3.0, 16.1) | 1586 (595, 3022) | 9.1 (3.4, 17.5) | 4306 (1545, 8151) | 24.8 (9.2, 45.6) |
| 75–84 | 2304 (1116, 4721) | 19.4 (9.4, 38.8) | 2079 (781, 4039) | 17.5 (6.6, 34.0) | 3971 (709, 9460) | 33.5 (6.5, 77.7) |
| 85+ | 3071 (1469, 6183) | 68.2 (33.5, 135.2) | 1242 (476, 2176) | 27.6 (10.2, 48.0) | 4466 (1596, 7950) | 99.1 (36.6, 174.2) |
| All | 8345 (4441, 16134) | 3.7 (2.1, 7.1) | 8140 (3952, 14481) | 3.6 (1.8, 6.5) | 19596 (8511, 37451) | 8.8 (3.9, 16.5) |
Notes:
Defined by ICD-9-CM Codes (See Supplemental Digital Content).
We have previously estimated the frequency and incidence of influenza-associated acute respiratory failure using similar methods and the same hospitalization databases (20), although incidence estimates are slightly different due to the differences in age groups studied.
Comparison of Modeled Outcomes to ICD-9-CM-Coded Influenza Hospitalizations
To assess the potential under-recognition of critical illness due to influenza virus infection, we compared the estimated numbers of hospitalizations for each influenza-associated severe illness syndrome with the numbers of hospitalizations coded with influenza diagnoses in the SID databases (Table 3). The percentage of the number of influenza-coded hospitalizations divided by the number of modeled influenza-associated hospitalizations was low for critical illness (9.8%), as well as for its component syndromes, acute respiratory failure (13.9%), severe sepsis (9.0%), and in-hospital death (8.1%). The percentage of coded outcomes divided by modeled outcomes was highest in the 18–49 years age group for each outcome, and it generally declined with advancing age.
Table 3.
Coded Influenza Hospitalizations and Percentage of Total Modeled Influenza-Associated Hospitalizations by Adult Age Group; AZ, CA, and WA, January 2003 – March 2009
| Age Group (years) | Critical Illness Hospitalizations with ICD-9-CM Coded Influenza Diagnosisa (Percent of Modeled Events) | In-Hospital Deaths with ICD-9-CM Coded Influenza Diagnosisa (Percent of Modeled Events) | Acute Respiratory Failure Hospitalizations with ICD-9-CM Coded Influenza Diagnosisa (Percent of Modeled Events) | Severe Sepsis Hospitalizations with ICD-9-CM Coded Influenza Diagnosisa (Percent of Modeled Events) |
|---|---|---|---|---|
| 18–49 | 473 (15.0%) | 78 (12.4%) | 264 (21.8%) | 326 (17.1%) |
| 50–64 | 511 (10.2%) | 88 (8.2%) | 283 (14.0%) | 351 (7.1%) |
| 65–74 | 477 (9.5%) | 99 (7.8%) | 221 (13.9%) | 325 (7.5%) |
| 75–84 | 672 (10.3%) | 217 (9.4%) | 261 (12.6%) | 471 (11.9%) |
| 85+ | 479 (6.8%) | 193 (6.3%) | 100 (8.1%) | 295 (6.6%) |
| All | 2612 (9.8%) | 675 (8.1%) | 1129 (13.9%) | 1768 (9.0%) |
Notes:
Defined by ICD-9-CM Codes (See Supplemental Digital Content).
Sensitivity Analysis Assessing Potential Contribution of RSV to Modeled Outcomes
In a sensitivity analysis, we assessed whether we could be misattributing events associated with RSV to influenza. During 2003–04 when influenza and RSV were not coincident, the estimated influenza-associated critical illness incidence was 10.8 per 100,000 person-years (95%CI 2.6, 29.0), which was similar to annual incidence estimates during subsequent years when influenza and RSV co-circulated. These estimates ranged from 8.7 per 100,000 person-years (95%CI, 2.3, 22.9) in 2008–09 to 16.4 per 100,000 person-years (95%CI, 5.6, 35.3) in 2007–08.
DISCUSSION
Our study suggests that influenza is an important contributor to critical illness. We estimate that influenza-associated events account for 1.3% of all critical illness hospitalizations and 3.4% of critical illness hospitalizations occurring during the influenza season. Assuming similar risks of influenza-associated critical illness in other US states, if we extrapolate our incidence estimates to the 2010 US population and assume no more than one hospitalization per person, we estimate that a mean of about 28,000 adults are hospitalized for influenza-associated critical illness annually (33). Of these events, approximately 19,000 persons hospitalized with severe sepsis or acute respiratory failure survive to discharge.
The study also suggests that there is a large unrecognized burden of influenza-associated critical illness. Of the total estimated number of hospitalizations with influenza-associated critical illness, only 9.8% had an ICD-9-CM code for influenza disease. Previous research has shown that widespread testing is not common for influenza in pediatric patients at risk for influenza disease, and that hospitalized cases with laboratory-confirmed influenza virus infection often have non-influenza discharge codes (34–36). Other research has shown that 40–63% of hospitalized pediatric seasonal influenza cases may be undetected due to lack of disease recognition, influenza-specific testing, or false-negative laboratory tests (36–39). We found potentially greater under-recognition of influenza in the adult ICU than reported in these studies. Potential reasons for this may be that physicians for adults are less likely to appreciate the effectiveness of influenza treatment (40), that common case definitions used to identify influenza are insensitive in hospitalized adults (11), that physicians are using insensitive influenza tests (41), that many persons with influenza disease progressing to critical illness may no longer have detectable influenza virus (42), or, perhaps that a preceding viral prodrome to critical illness is not being sufficiently assessed or acted upon in the critically ill.
Our study should be interpreted in the context of its limitations. Data from Arizona, California, and Washington may not necessarily be generalizable to other US states. Approximately 2 percent of community hospitals in the states in our analysis did not submit data to the SID. Exclusion of discharges from these centers may have slightly lowered our incidence estimates. Our definition of critical illness may classify patients not admitted to an ICU as critically ill. Nevertheless, patients having sepsis with end-organ dysfunction or acute respiratory failure have a high risk of death regardless of whether they are admitted to the ICU, consistent with critical illness. We used a definition of severe sepsis that has been validated against medical record review (17, 43), however our definition of acute respiratory failure requiring mechanical ventilation may be insensitive (44). Nevertheless, our incidence rate estimates for severe sepsis and acute respiratory failure are comparable to other studies using different methodologies (15, 16, 45, 46). While a recent study has validated our general approach to estimating influenza-associated hospitalizations against prospective surveillance for laboratory-confirmed influenza in children (18), our model has not been validated with prospective influenza surveillance among adults or among persons hospitalized for critical illness. We did not have influenza testing data for the critical illness patients in this cohort, and influenza-associated events were modeled, not calculated. Influenza surveillance data are a convenience sample of specimens tested by participating clinical and public health laboratories and may over-represent ambulatory pediatric patients (47). However virologic surveillance data correlate highly with other national influenza surveillance which include adults and persons with severe influenza illness (47). Our model did not account for the circulation of respiratory syncytial virus (RSV), although a sensitivity analysis found that estimates of influenza-associated critical illness were similar during periods with and without RSV circulation. The attributable event, incidence rate, and risk calculations assumed that influenza types/subtype correlations are non-negative and that virus activity is independent by type/subtype. If this assumption is violated, then we may have over-estimated the total number of influenza-associated events. Finally, absence of ICD-9-CM coding for influenza disease does not necessarily mean lack of influenza testing, diagnosis, or treatment.
Despite these limitations our study has important implications for practicing clinicians and public health officials. Providers who care for critically ill individuals should have a heightened suspicion for influenza in their patients, and they should have a lower threshold to test those with acute respiratory failure or severe sepsis for influenza, particularly when influenza is known to be circulating in their communities. Public health officials should consider efforts to target critical care providers to increase awareness of influenza and testing of critically ill patients. Mortality among the critically ill is high, and neuraminidase inhibitor therapy has been shown to benefit hospitalized patients with severe influenza disease (48, 49). WHO and CDC recommend that all persons with acute critical illness receive empiric oseltamivir therapy when influenza is known to be in the patient’s community while clinicians await the results of sensitive influenza diagnostic tests (50–52). Laboratory testing should not delay treatment and should not rely on insensitive assays such as rapid influenza diagnostic tests (52). Additional measures, such as vaccinating medical staff and implementing infection control procedures are also necessary to protect vulnerable patients from the nosocomial spread of influenza virus (51).
CONCLUSIONS
Influenza is the most common vaccine-preventable disease in the United States (24, 53). Our study suggests that influenza is also a common cause of critical illness and that it may be under-recognized by treating physicians. More efforts are needed to improve our ability to determine which critically ill patients should be assessed and treated for influenza disease. Physicians should consider influenza virus infection in patients with critical illness, particularly when influenza is known to be circulating in the community.
Supplementary Material
Acknowledgments
Source of Funding: Dr. Ortiz receives funding from the Robert Wood Johnson Harold Amos Medical Faculty Development Program. Dr. Goss receives funding from the Cystic Fibrosis Foundation, the NIH (R01HL103965, R01HL113382, R01AI101307, U M1HL119073, P30DK089507) and the FDA (R01FD003704). Dr. Cooke is supported by Mentored Clinical Scientist Research Career Development Award from the Agency for Healthcare Research and Quality (K08HS020672).
The authors would like to thank the following people for their assistance with this project: Derek Angus, Billy Kreuter, and Florian Mayr. The authors would also like to acknowledge the organizations that contributed to the State Inpatient Databases (SID) of the Healthcare Cost and Utilization Project (HCUP) used in this study: Arizona Department of Health Services, California Office of Statewide Health Planning and Development, and Washington State Department of Health.
Footnotes
Institutions were work was performed: University of Washington
Conflicts of Interest: The authors declare no conflicts of interest.
DISCLAIMER
The opinions expressed by authors contributing to this journal do not necessarily reflect the opinions of the Centers for Disease Control and Prevention or the institutions with which the authors are affiliated.
Copyright form disclosures: Dr. Ortiz’s institution received grant support from Robert Wood Johnson Dr. Shay disclosed government work. Dr. Rue’s institution received grant support from Robert Wood Johnson. Dr. Neradilek disclosed work for hire. Her institution received support for participation in review activities and support for manuscript writing/review. Dr. Seymour received support for article research from NIH. His institution received grant support from NIH. Dr. Goss served as a board member for Transave (No fee paid) and KaloBios Pharmaceuticals (Fee donated to CF clinical research), received grant support from Transave (Grant to analyze symptom score data in a clinical trial) and Vertex Pharmaceuticals (Grant to perform analysis using multiple existing data sets), lectured for F. Hoffmann-La Roche Ltd (Honoraria for preparing and giving symposium Talk), and received support for manuscript preparation from Johns Hopkins University (Honoraria for preparing and giving CME talks). His institution received grant support from the Cystic Fibrosis Foundation (Grants to conduct clinical trials in MRSA erradication, home monitoring and use of IV Gallium all in CF. Grant to Chair CFF Patient Registry Committee), NIH (Grants to conduct clinical trials in home monitoring in CF and the use of IV gallium in CF), and the FDA (Grants to conduct a clinical trial the use of IV gallium in CF). Dr. Cooke received support for article research from the Agency for Healthcare Research and Quality. His institution received grant support from AHRQ. The remaining authors have disclosed that they do not have any potential conflicts of interest.
References
- 1.World Health Organization. Battle against respiratory viruses (brave) initiative 2012. 2013 Mar 26; Available from: http://www.who.int/influenza/patient_care/clinical/brave/en/index.html.
- 2.Randolph AG, Vaughn F, Sullivan R, Rubinson L, Thompson BT, Yoon G, Smoot E, Rice TW, Loftis LL, Helfaer M, Doctor A, Paden M, Flori H, Babbitt C, Graciano AL, Gedeit R, Sanders RC, Giuliano JS, Zimmerman J, Uyeki TM. Critically ill children during the 2009–2010 influenza pandemic in the united states. Pediatrics. 2011;128:e1450–1458. doi: 10.1542/peds.2011-0774. [DOI] [PMC free article] [PubMed] [Google Scholar]
- 3.Rice TW, Rubinson L, Uyeki TM, Vaughn FL, John BB, Miller RR, 3rd, Higgs E, Randolph AG, Smoot BE, Thompson BT. Critical illness from 2009 pandemic influenza a virus and bacterial coinfection in the united states. Critical care medicine. 2012;40:1487–1498. doi: 10.1097/CCM.0b013e3182416f23. [DOI] [PMC free article] [PubMed] [Google Scholar]
- 4.Jouvet P, Hutchison J, Pinto R, Menon K, Rodin R, Choong K, Kesselman M, Veroukis S, Andre Dugas M, Santschi M, Guerguerian AM, Withington D, Alsaati B, Joffe AR, Drews T, Skippen P, Rolland E, Kumar A, Fowler R. Critical illness in children with influenza a/ph1n1 2009 infection in canada. Pediatric critical care medicine: a journal of the Society of Critical Care Medicine and the World Federation of Pediatric Intensive and Critical Care Societies. 2010;11:603–609. doi: 10.1097/PCC.0b013e3181d9c80b. [DOI] [PubMed] [Google Scholar]
- 5.Kumar A, Zarychanski R, Pinto R, Cook DJ, Marshall J, Lacroix J, Stelfox T, Bagshaw S, Choong K, Lamontagne F, Turgeon AF, Lapinsky S, Ahern SP, Smith O, Siddiqui F, Jouvet P, Khwaja K, McIntyre L, Menon K, Hutchison J, Hornstein D, Joffe A, Lauzier F, Singh J, Karachi T, Wiebe K, Olafson K, Ramsey C, Sharma S, Dodek P, Meade M, Hall R, Fowler RA. Critically ill patients with 2009 influenza a(h1n1) infection in canada. JAMA: the journal of the American Medical Association. 2009;302:1872–1879. doi: 10.1001/jama.2009.1496. [DOI] [PubMed] [Google Scholar]
- 6.Reed C, Angulo FJ, Swerdlow DL, Lipsitch M, Meltzer MI, Jernigan D, Finelli L. Estimates of the prevalence of pandemic (h1n1); united states. april-july 2009; 2009. [DOI] [PMC free article] [PubMed] [Google Scholar]
- 7.Uyeki TM, Prasad R, Vukotich C, Stebbins S, Rinaldo CR, Ferng YH, Morse SS, Larson EL, Aiello AE, Davis B, Monto AS. Low sensitivity of rapid diagnostic test for influenza. Clinical infectious diseases: an official publication of the Infectious Diseases Society of America. 2009;48:e89–92. doi: 10.1086/597828. [DOI] [PubMed] [Google Scholar]
- 8.Poehling KA, Edwards KM, Weinberg GA, Szilagyi P, Staat MA, Iwane MK, Bridges CB, Grijalva CG, Zhu Y, Bernstein DI, Herrera G, Erdman D, Hall CB, Seither R, Griffin MR. The underrecognized burden of influenza in young children. The New England journal of medicine. 2006;355:31–40. doi: 10.1056/NEJMoa054869. [DOI] [PubMed] [Google Scholar]
- 9.Rello J, Rodriguez A, Ibanez P, Socias L, Cebrian J, Marques A, Guerrero J, Ruiz-Santana S, Marquez E, Del Nogal-Saez F, Alvarez-Lerma F, Martinez S, Ferrer M, Avellanas M, Granada R, Maravi-Poma E, Albert P, Sierra R, Vidaur L, Ortiz P, Prieto del Portillo I, Galvan B, Leon-Gil C. Intensive care adult patients with severe respiratory failure caused by influenza a (h1n1)v in spain. Critical care (London, England) 2009;13:R148. doi: 10.1186/cc8044. [DOI] [PMC free article] [PubMed] [Google Scholar]
- 10.Nair H, Nokes DJ, Gessner BD, Dherani M, Madhi SA, Singleton RJ, O’Brien KL, Roca A, Wright PF, Bruce N, Chandran A, Theodoratou E, Sutanto A, Sedyaningsih ER, Ngama M, Munywoki PK, Kartasasmita C, Simoes EA, Rudan I, Weber MW, Campbell H. Global burden of acute lower respiratory infections due to respiratory syncytial virus in young children: A systematic review and meta-analysis. Lancet. 2010;375:1545–1555. doi: 10.1016/S0140-6736(10)60206-1. [DOI] [PMC free article] [PubMed] [Google Scholar]
- 11.Babcock HM, Merz LR, Fraser VJ. Is influenza an influenza-like illness? Clinical presentation of influenza in hospitalized patients Infection control and hospital epidemiology: the official journal of the Society of Hospital Epidemiologists of America. 2006;27:266–270. doi: 10.1086/501539. [DOI] [PubMed] [Google Scholar]
- 12.Ortiz JR, Cooke CR, Goss CH. Influenza pneumonia surveillance among hospitalized adults substantially underestimates the burden of severe influenza disease. Options for the Control of Influenza Conference; Cape Town, South Africa. 2013. [Google Scholar]
- 13.Healthcare Cost and Utilization Project (HCUP) Hcup state inpatient databases (sid) Rockville, MD: Agency for Healthcare Research and Quality; 2003–2009. [PubMed] [Google Scholar]
- 14.Centers for Disease Control and Prevention. United states surveillance data: 1997–1998 through 2009–2010 seasons. 2010. [Google Scholar]
- 15.Behrendt CE. Acute respiratory failure in the united states: Incidence and 31-day survival. Chest. 2000;118:1100–1105. doi: 10.1378/chest.118.4.1100. [DOI] [PubMed] [Google Scholar]
- 16.Gaieski DF, Edwards JM, Kallan MJ, Carr BG. Benchmarking the incidence and mortality of severe sepsis in the united states. Critical care medicine. 2013;41:1167–1174. doi: 10.1097/CCM.0b013e31827c09f8. [DOI] [PubMed] [Google Scholar]
- 17.Iwashyna TJ, Odden A, Rohde J, Bonham C, Kuhn L, Malani P, Chen L, Flanders S. Identifying patients with severe sepsis using administrative claims: Patient-level validation of the angus implementation of the international consensus conference definition of severe sepsis. Medical care. 2012 doi: 10.1097/MLR.0b013e318268ac86. [DOI] [PMC free article] [PubMed] [Google Scholar]
- 18.Seymour CW, Rea TD, Kahn JM, Walkey AJ, Yealy DM, Angus DC. Severe sepsis in pre-hospital emergency care: Analysis of incidence, care, and outcome. American journal of respiratory and critical care medicine. 2012;186:1264–1271. doi: 10.1164/rccm.201204-0713OC. [DOI] [PMC free article] [PubMed] [Google Scholar]
- 19.Seymour CW, Kahn JM, Cooke CR, Watkins TR, Heckbert SR, Rea TD. Prediction of critical illness during out-of-hospital emergency care. JAMA: the journal of the American Medical Association. 2010;304:747–754. doi: 10.1001/jama.2010.1140. [DOI] [PMC free article] [PubMed] [Google Scholar]
- 20.Ortiz JR, Neuzil KM, Rue TC, Zhou H, Shay DK, Cheng PY, Cooke CR, Goss CH. Population-based incidence estimates of influenza-associated respiratory failure hospitalizations, 2003 – 2009. American journal of respiratory and critical care medicine. 2013 doi: 10.1164/rccm.201212-2341OC. [DOI] [PubMed] [Google Scholar]
- 21.Centers for Disease Control and Prevention. Estimates of deaths associated with seasonal influenza --- united states, 1976–2007. MMWR Morbidity and mortality weekly report. 2010;59:1057–1062. [PubMed] [Google Scholar]
- 22.Thompson WW, Shay DK, Weintraub E, Brammer L, Bridges CB, Cox NJ, Fukuda K. Influenza-associated hospitalizations in the united states. JAMA: the journal of the American Medical Association. 2004;292:1333–1340. doi: 10.1001/jama.292.11.1333. [DOI] [PubMed] [Google Scholar]
- 23.Thompson WW, Shay DK, Weintraub E, Brammer L, Cox N, Anderson LJ, Fukuda K. Mortality associated with influenza and respiratory syncytial virus in the united states. JAMA: the journal of the American Medical Association. 2003;289:179–186. doi: 10.1001/jama.289.2.179. [DOI] [PubMed] [Google Scholar]
- 24.Zhou H, Thompson WW, Viboud CG, Ringholz CM, Cheng P-Y, Steiner C, Abedi GR, Anderson LJ, Brammer L, Shay DK. Hospitalizations associated with influenza and respiratory syncytial virus in the united states, 1993–2008. Clinical Infectious Diseases. 2012;54:1427–1436. doi: 10.1093/cid/cis211. [DOI] [PMC free article] [PubMed] [Google Scholar]
- 25.Centers for Disease Control and Prevention. Overview of influenza surveillance in the united states 2011. 2013 Mar 26; Available from: http://www.cdc.gov/flu/weekly/overview.htm.
- 26.Mullooly JP, Bridges CB, Thompson WW, Chen J, Weintraub E, Jackson LA, Black S, Shay DK. Influenza- and rsv-associated hospitalizations among adults. Vaccine. 2007;25:846–855. doi: 10.1016/j.vaccine.2006.09.041. [DOI] [PubMed] [Google Scholar]
- 27.Ortiz JR, Zhou H, Shay DK, Neuzil KM, Fowlkes AL, Goss CH. Monitoring influenza activity in the united states: A comparison of traditional surveillance systems with google flu trends. PloS one. 2011;6:e18687. doi: 10.1371/journal.pone.0018687. [DOI] [PMC free article] [PubMed] [Google Scholar]
- 28.United States Census Bureau. US Population projections. 2010 Nov 17; Available from: http://www.census.gov/population/www/projections/
- 29.Davison AC, Hinkley DV. Bootstrap methods and their application. Cambridge University Press; 1997. [Google Scholar]
- 30.Falsey AR, Hennessey PA, Formica MA, Cox C, Walsh EE. Respiratory syncytial virus infection in elderly and high-risk adults. The New England journal of medicine. 2005;352:1749–1759. doi: 10.1056/NEJMoa043951. [DOI] [PubMed] [Google Scholar]
- 31.Widmer K, Zhu Y, Williams JV, Griffin MR, Edwards KM, Talbot HK. Rates of hospitalizations for respiratory syncytial virus, human metapneumovirus, and influenza virus in older adults. The Journal of infectious diseases. 2012;206:56–62. doi: 10.1093/infdis/jis309. [DOI] [PMC free article] [PubMed] [Google Scholar]
- 32.Lee N, Lui GC, Wong KT, Li TC, Tse EC, Chan JY, Yu J, Wong SS, Choi KW, Wong RY, Ngai KL, Hui DS, Chan PK. High morbidity and mortality in adults hospitalized for respiratory syncytial virus infections. Clinical infectious diseases: an official publication of the Infectious Diseases Society of America. 2013 doi: 10.1093/cid/cit471. [DOI] [PubMed] [Google Scholar]
- 33.United States Census Bureau. Age and sex composition 2010, 2011. 2013 Sep 18; Available from: http://www.census.gov/prod/cen2010/briefs/c2010br-03.pdf.
- 34.Keren R, Wheeler A, Coffin SE, Zaoutis T, Hodinka R, Heydon K. Icd-9 codes for identifying influenza hospitalizations in children. Emerging infectious diseases. 2006;12:1603–1604. doi: 10.3201/eid1210.051525. [DOI] [PMC free article] [PubMed] [Google Scholar]
- 35.Poehling KA, Edwards KM, Weinberg GA, Szilagyi P, Staat MA, Iwane MK, Bridges CB, Grijalva CG, Zhu Y, Bernstein DI, Herrera G, Erdman D, Hall CB, Seither R, Griffin MR. The underrecognized burden of influenza in young children. New England Journal of Medicine. 2006;355:31–40. doi: 10.1056/NEJMoa054869. [DOI] [PubMed] [Google Scholar]
- 36.Reed C, Angulo FJ, Swerdlow DL, Lipsitch M, Meltzer MI, Jernigan D, Finelli L. Estimates of the prevalence of pandemic (h1n1) 2009, united states, april-july 2009. Emerging infectious diseases. 2009;15:2004–2007. doi: 10.3201/eid1512.091413. [DOI] [PMC free article] [PubMed] [Google Scholar]
- 37.Grijalva CG, Craig AS, Dupont WD, Bridges CB, Schrag SJ, Iwane MK, Schaffner W, Edwards KM, Griffin MR. Estimating influenza hospitalizations among children. Emerging infectious diseases. 2006;12:103–109. doi: 10.3201/eid1201.050308. [DOI] [PMC free article] [PubMed] [Google Scholar]
- 38.Grijalva CG, Weinberg GA, Bennett NM, Staat MA, Craig AS, Dupont WD, Iwane MK, Postema AS, Schaffner W, Edwards KM, Griffin MR. Estimating the undetected burden of influenza hospitalizations in children. Epidemiology and infection. 2007;135:951–958. doi: 10.1017/S095026880600762X. [DOI] [PMC free article] [PubMed] [Google Scholar]
- 39.Kostova D, Reed C, Finelli L, Cheng P-Y, Gargiullo PM, Shay DK, Singleton JA, Meltzer MI, Lu P-j, Bresee JS. Influenza illness and hospitalizations averted by influenza vaccination in the united states, 2005–2011. PloS one. 2013;8:e66312. doi: 10.1371/journal.pone.0066312. [DOI] [PMC free article] [PubMed] [Google Scholar]
- 40.Katz MA, Lamias MJ, Shay DK, Uyeki TM. Use of rapid tests and antiviral medications for influenza among primary care providers in the united states. Influenza and other respiratory viruses. 2009;3:29–35. doi: 10.1111/j.1750-2659.2009.00070.x. [DOI] [PMC free article] [PubMed] [Google Scholar]
- 41.Centers for Disease Control and Prevention. Rapid diagnostic testing for influenza. 2013 Sep 18; Available from: http://www.cdc.gov/flu/professionals/diagnosis/rapidlab.htm.
- 42.Noh JY, Song JY, Hwang SY, Choi WS, Heo JY, Cheong HJ, Kim WJ. Viral load dynamics in adult patients with a(h1n1)pdm09 influenza. Epidemiology and infection. 2013:1–6. doi: 10.1017/S0950268813001672. [DOI] [PMC free article] [PubMed] [Google Scholar]
- 43.Seymour Cw, Rea TD, Kahn JM, Walkey AJ, Yealy DM, Angus DC. Severe sepsis in pre-hospital emergency care: Analysis of incidence, care, and outcome. doi: 10.1164/rccm.201204-0713OC. [DOI] [PMC free article] [PubMed] [Google Scholar]
- 44.Quan H, Parsons GA, Ghali WA. Validity of procedure codes in international classification of diseases, 9th revision, clinical modification administrative data. Medical care. 2004;42:801–809. doi: 10.1097/01.mlr.0000132391.59713.0d. [DOI] [PubMed] [Google Scholar]
- 45.Lewandowski K. Contributions to the epidemiology of acute respiratory failure. Critical care (London, England) 2003;7:288–290. doi: 10.1186/cc2352. [DOI] [PMC free article] [PubMed] [Google Scholar]
- 46.Luhr OR, Antonsen K, Karlsson M, Aardal S, Thorsteinsson A, Frostell CG, Bonde J. Incidence and mortality after acute respiratory failure and acute respiratory distress syndrome in sweden, denmark, and iceland. The arf study group. American journal of respiratory and critical care medicine. 1999;159:1849–1861. doi: 10.1164/ajrccm.159.6.9808136. [DOI] [PubMed] [Google Scholar]
- 47.Centers for Disease Control and Prevention. Overview of influenza surveillance in the united states. 2012. 2013 Mar 26; Available from: http://www.cdc.gov/flu/pdf/weekly/overview.pdf.
- 48.US Food and Drug Administration. Zanamavir highlights of prescribing information 2010. 2013 Mar 26; Available from: http://www.accessdata.fda.gov/drugsatfda_docs/label/2010/021036s019lbl.pdf.
- 49.US Food and Drug Administration. Oseltamivir highlights of prescribing information 2012. 2013 Mar 26; Available from: http://www.accessdata.fda.gov/drugsatfda_docs/label/2012/021087s062lbl.pdf.
- 50.Fiore AE, Fry A, Shay D, Gubareva L, Bresee JS, Uyeki TM. Antiviral agents for the treatment and chemoprophylaxis of influenza --- recommendations of the advisory committee on immunization practices (acip) MMWR Recommendations and reports: Morbidity and mortality weekly report Recommendations and reports/Centers for Disease Control. 2011;60:1–24. [PubMed] [Google Scholar]
- 51.World Health Organization. Clinical management of human infection with pandemic (h1n1) 2009: Revised guidance 2009. 2013 Mar 26; Available from: http://www.who.int/csr/resources/publications/swineflu/clinical_management/en/index.html.
- 52.Centers for Disease Control and Prevention. Cdc influenza update for geriatricians and other clinicians caring for people 65 and older. 2013 Mar 26; Available from: http://www.cdc.gov/flu/professionals/2012-2013-guidance-geriatricians.htm.
- 53.Roush SW, Murphy TV. Historical comparisons of morbidity and mortality for vaccine-preventable diseases in the united states. JAMA: the journal of the American Medical Association. 2007;298:2155–2163. doi: 10.1001/jama.298.18.2155. [DOI] [PubMed] [Google Scholar]
Associated Data
This section collects any data citations, data availability statements, or supplementary materials included in this article.