

Summary
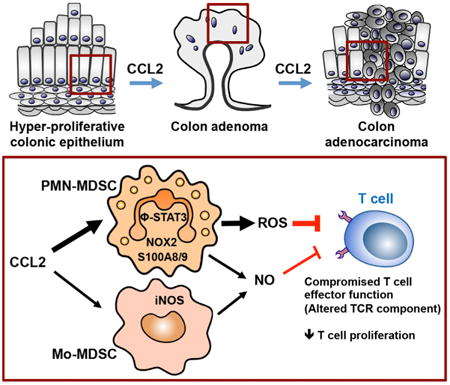
Our study reveals a non-canonical role for CCL2 in modulating non-macrophage, myeloid-derived suppressor cells (MDSCs) and shaping a tumor-permissive microenvironment during colon cancer development. We found that intratumoral CCL2 levels increased in patients with colitis-associated colorectal cancer (CRC), adenocarcinomas, and adenomas. Deletion of CCL2 blocked progression from dysplasia to adenocarcinoma and reduced the number of colonic MDSCs in a spontaneous mouse model of colitis-associated CRC. In a transplantable mouse model of adenocarcinoma and an APC-driven adenoma model, CCL2 fostered MDSC accumulation in evolving colonic tumors and enhanced polymorphonuclear (PMN)-MDSC immunosuppressive features. Mechanistically, CCL2 regulated T cell suppression of PMN-MDSCs in a STAT3-mediated manner. Furthermore, CCL2 neutralization decreased tumor numbers and MDSC accumulation and function. Collectively, our experiments support that perturbing CCL2 and targeting MDSCs may afford therapeutic opportunities for colon cancer interception and prevention.
Graphical abstract
Introduction
Colorectal cancer (CRC) is the second leading cause of cancer deaths in the United States (Tenesa and Dunlop, 2009). CRC includes hereditary, sporadic, and colitis-associated colon cancer. Inflammatory bowel disease (IBD) is associated with an increased risk of developing IBD-associated CRC (Itzkowitz, 2003). Chronic inflammation plays a key role in tumor initiation in colitis-associated CRC. Although other types of CRC develop without any signs of macroscopic inflammation, robust infiltration of multiple immune cells is a common feature of sporadic CRC.
Immune cells play a central role in the tumor microenvironment (Hanahan and Coussens, 2012). CRC involves imbalanced Th1/Th17/Th2 responses (Galon et al., 2013), altered innate lymphoid cell activity (Pearson et al., 2012), and enhanced immunosuppressive regulatory T cells and tumor-associated macrophages (TAMs) (Kang et al., 2010). Accumulating evidence supports that myeloid-derived suppressor cells (MDSCs) contribute to cancer immune evasion by suppressing T cell anti-tumor functions and modulating innate immune responses (Gabrilovich and Nagaraj, 2009). MDSCs comprise a heterogeneous population of immature myeloid cells characterized by co-expression of CD11b and Gr-1 and lack features of mature macrophages and dendritic cells in tumor-bearing mice (Gabrilovich et al., 2012). MDSCs can be divided into two distinct sub-populations: monocytic MDSCs (Mo-MDSCs) and polymorphonuclear (PMN)-MDSCs, also known as granulocytic (G)-MDSCs (Gabrilovich et al., 2012). These two subsets differ in their gene expression profiles and immunosuppressive activities (Gabrilovich and Nagaraj, 2009). In many cancers, including CRC, blood MDSC numbers correlate with stage and metastatic burden (Diaz-Montero et al., 2009). However, factors regulating MDSC subset accumulation and MDSC's distinct contributions to CRC development remain underexplored.
Chemokines, which recruit immune cells to inflamed sites, contribute to the pathogenesis of colitis and colon cancer. CCL2, a member of the C-C chemokine family, regulates the recruitment of myeloid cells into inflamed sites and tumors. CCL2-mediated macrophage recruitment promotes tumor growth, progression, and metastasis in breast, ovarian, and prostate cancers (Fader et al., 2010; Qian et al., 2011; Zhang et al., 2010). Monocytes recruited to tumors through the CCL2-CCR2 axis are polarized to TAMs, contributing to tumor cell survival (McClellan et al., 2012). Two prior studies suggested that CCL2 increased colon tumor numbers in mice through a CCL2-CCR2-dependent recruitment of myeloid cells (McClellan et al., 2012; Popivanova et al., 2009). The complete functional repertoire of colonic CCL2 remains unclear, and whether colonic CCL2 expression is elevated in human colitis-associated CRC is unknown.
We identify a role for CCL2 in influencing MDSC accumulation and function in the colon and tumor microenvironment during colon carcinogenesis. Using human colitis-associated CRC, sporadic CRC, and adenomas in conjunction with three distinct and complementary mouse models of colorectal carcinogenesis, we elucidate cellular and molecular mechanisms by which CCL2 affects PMN-MDSC accumulation and immunosuppressive function during this neoplastic process. Together, our results highlight a pro-neoplastic role for CCL2 in regulating MDSC accumulation and the importance of MDSCs and CCL2 in the development of CRC.
Results
Increased Colonic CCL2 Expression Is Associated with Neoplastic Progression in Human and Mouse Colitis-Associated CRC
Although elevated CCL2 expression has been linked to tumor progression by myeloid cell influxes via CCR2-mediated altered endothelial vascular permeability (Wolf et al., 2012) and CCL2 expression has been mapped to specific cell types (Tsuyada and Wang, 2013), colonic CCL2 levels have not been assessed across the neoplastic continuum. To assess CCL2 levels in human colitis-associated CRC, we used immunohistochemistry and semiquantitative histomorphometry to measure the total CCL2+ area in colonic tissues in 11 cases of human IBD with active colitis, dysplasia, and adenocarcinoma (ACA). CCL2 expression was increased in regions of active colitis or dysplasia versus no colitis (normal) (p < 0.01 and p < 0.05, respectively). CCL2 levels were significantly higher in areas of ACA versus active colitis or dysplasia (p < 0.05) (Figures 1A and S1A). CCL2 staining was both clustered and diffuse in the majority of tissues with ACA involvement, and both epithelial cells and infiltrating lamina propria immune cells appear to express CCL2 (Figure 1A, right panel). The association between increasing CCL2 levels and ACA in human colitis-associated neoplasia prompted us to evaluate the function of CCL2 in colitis-associated CRC in mice.
Figure 1. CCL2 Levels Increase with Neoplastic Progression in Human and Mouse Colitis-Associated CRC.
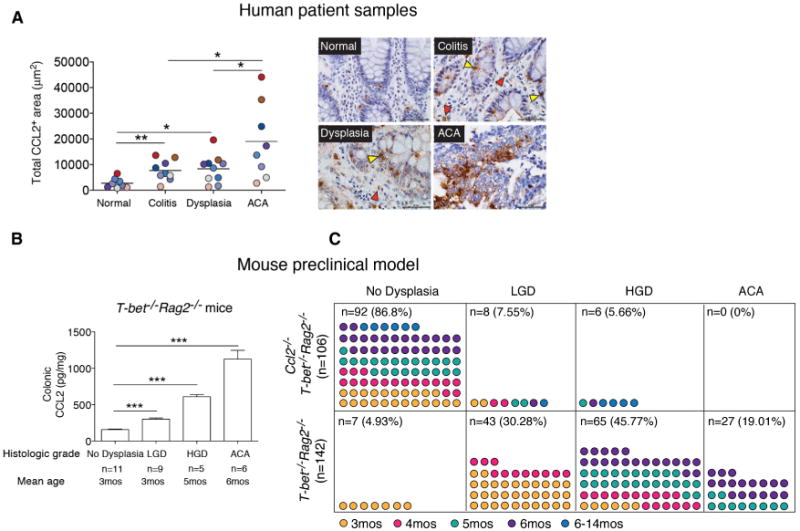
(A) CCL2 expression levels in 11 human colitis-associated colorectal dysplasia and adenocarcinoma (ACA) cases. Left panel: total CCL2+ area from five fields (objective 40×) plotted for each case. Areas for quantification were no colitis (normal), colitis (no dysplasia/ACA), dysplasia, and ACA. Symbols are color-coded to track samples. Right panel: representative images of CCL2 immunostaining in human colon samples. Yellow triangles, epithelial cells; red triangles, infiltrating immune cells. Scale bar, 50 μm.
(B) CCL2 colonic protein levels from T-bet−/− Rag2−/− mice across the neoplastic continuum, quantitated by ELISA. Mean ± SEM with age and number of mice per group shown.
(C) Prevalence of dysplasia and neoplasia in Ccl2−/− T-bet−/− Rag2−/− and T-bet−/− Rag2−/− mice monitored by mouse age. Symbols represent data from individual mice, with color-coding indicating age in months.
*p < 0.05, **p < 0.01, and ***p < 0.001 (unpaired, two-tailed Student's t test). See also Figure S1.
T-bet−/− Rag2−/− mice develop colonic dysplasia and ACA, which bear similarities to human colitis-associated dysplasia and CRC (Garrett et al., 2009). We determined the colonic CCL2 expression levels in BALB/c T-bet−/− Rag2−/− mice with no dysplasia, low-grade dysplasia (LGD), high-grade dysplasia (HGD), and ACA. The BALB/c background was selected, as colitis penetrance and HGD and ACA frequency are higher compared with the C57BL/6 background (Ermann et al., 2011; Garrett et al., 2009). Similar to results of human colitis-associated CRC patients, CCL2 levels increased in T-bet−/− Rag2−/− mice during colorectal carcinogenesis and were elevated in ACA-involved tissue (p < 0.0001 in all cases) (Figure 1B). Prior studies examining CCL2 function in colitis-associated CRC have used mice with altered CCR2 expression (Popivanova et al., 2009). However, CCR2, like many chemokine receptors, can bind several chemokines (CCL2, CCL7, CCL8, CCL12, CCL13, and CCL16; Zlotnik and Yoshie, 2012), and CCL2 can bind CCR2, CCR3, and CCR4 (Lazennec and Richmond, 2010; Schall and Proudfoot, 2011). To delineate CCL2's role in colitis-associated neoplastic progression, we generated BALB/c Ccl2−/− T-bet−/− Rag2−/− mice and monitored them for the development of dysplasia and ACA for over a year, guided by prior observations of dysplasia and cancer frequencies in T-bet−/− Rag2−/− mice (Garrett et al., 2009). Ccl2−/− T-bet−/− Rag2−/− (n = 106) and T-bet−/− Rag2−/− (n = 142) mice developed colitis of similar severity over a similar time course (Figures S1B and S1C), and Ccl2−/− T-bet−/− Rag2−/− mice succumbed with poor body condition, as did T-bet−/− Rag2−/− mice, over the same time frame. However, Ccl2−/− T-bet−/− Rag2−/− mice did not develop ACA, and the frequency of dysplasia was markedly lower in Ccl2−/− T-bet−/− Rag2−/− mice than in T-bet−/− Rag2−/− mice (LGD 7.55% versus 30.28%, HGD 5.66% versus 45.77%) (Figure 1C). These observations suggest that colonic CCL2 may function in tumor initiation or as a neoplastic factor contributing to progression from dysplasia to ACA in colitis-associated CRC.
CCL2 Influences Colonic MDSC Accumulation and Immunosuppressive Features in Pre-malignant Stages of Colorectal Carcinogenesis
Chronic inflammation contributes to tumor initiation in colitis-associated CRC, and infiltration of immune cells, specifically CD11b+ myeloid cells, plays a central role in carcinogenesis. CCL2 recruits myeloid cells, including TAMs, and influences their polarization in the tissue microenvironment (Sica and Mantovani, 2012). Given the elevated levels of CCL2 in T-bet−/− Rag2−/− colons during carcinogenesis, we examined whether CCL2 affected recruitment of colonic myeloid cells, including TAMs. Although Ccl2−/− T-bet−/− Rag2−/− mice do not develop cancer, examining colonic tissues from T-bet−/− Rag2−/− and Ccl2−/− T-bet−/− Rag2−/− mice would enable us to determine if CCL2 acts on tumor-promoting myeloid cells in the colon during the early stages of the neoplastic process. We analyzed colonic myeloid cells in T-bet−/− Rag2−/− and Ccl2−/− T-bet−/− Rag2−/− mice using a flow cytometry scheme and markers that have been previously validated for the study of tumor-associated myeloid cells (Figures 2A and 2B) (Franklin et al., 2014; Youn et al., 2008). There were no significant differences in total CD11b+ cell, CD11b+Gr-1− myeloid cell (Figures 2A, 2B, and S2A, population I), or M2-like TAM (CD11b+Gr-1−F4/80+MMR+) numbers between T-bet−/− Rag2−/− and Ccl2−/− T-bet−/− Rag2−/− mice (Figure 2C). Given these data, we next investigated whether CCL2 influences other intratumoral myeloid cells.
Figure 2. CCL2 Induces Colonic MDSC Accumulation and Alters MDSC Gene Expression in Colitis-Associated Pre-malignancy.
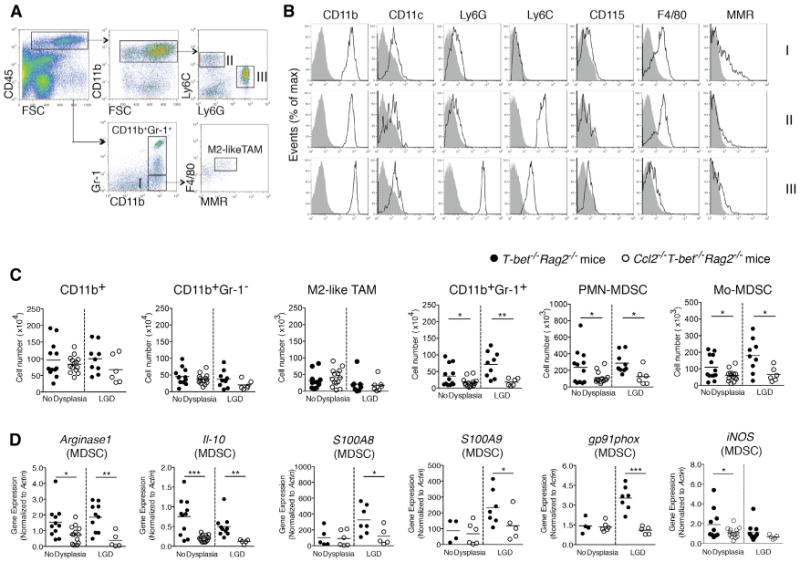
Colonic myeloid cells were isolated from Ccl2−/− T-bet−/− Rag2−/− and T-bet−/− Rag2−/− mice with or without low-grade dysplasia (LGD).
(A) The gating strategy for myeloid cell subset identification. Following a leukocytes gate (CD45+), cells are further gated for CD11b+ myeloid cells only and CD11b+Gr-1+ MDSCs or CD11b+Gr-1− macrophages (population I). Ly6C and Ly6G were used to distinguish Mo-MDSCs (population II) and PMN-MDSCs (population III). The F4/80 and MMR flow plot was used to identify tumor-promoting macrophages (TAMs and M2-like TAMs).
(B) Flow cytometric analysis of populations I-III as gated in (A). Data are representative of at least three independent experiments.
(C) Quantification of select colonic myeloid cells by flow cytometry. Symbols represent data from individual mice, and bars show the mean.
(D) Colonic MDSC sorted from Ccl2−/−T-bet−/− Rag2−/− and T-bet−/− Rag2−/− mice and Arginase1 and Il10 (C), S100A8, S100A9, gp91phox, and iNOS (D) expression levels were evaluated by qRT-PCR. Symbols represent data from individual mice. Data are from age-matched (4- to 5-month old) and littermate mice. *p < 0.05, **p < 0.01, and ***p < 0.001 (unpaired, two-tailed Student's t test). See also Figure S2.
MDSCs suppress anti-tumor immune responses and promote tumor growth and metastasis (Gabrilovich et al., 2012). The functions and phenotypes of splenic MDSCs have been explored in many mouse solid tumor models, however, the functions and features of intestinal MDSCs during colonic carcinogenesis remain under-investigated. We queried whether CCL2 affected colonic MDSC accumulation and found that CD11b+Gr-1 + MDSC numbers increased 2-fold in the colons of T-bet−/− Rag2−/− mice versus Ccl2−/− T-bet−/− Rag2−/− mice before dysplasia was detectable and increased 4-fold in LGD (p < 0.01 and p <0.05, respectively) (Figure 2C). Prior to the development of dysplasia and in LGD, Mo-MDSCs (Figures 2A, 2B, and S2A, population II) and PMN-MDSCs (Figures 2A, 2B, and S2A, population III) increased 2-fold in T-bet−/− Rag2−/− mice versus Ccl2−/− T-bet−/− Rag2−/− mice, p < 0.05 (Figure 2C). There were also differences in PMN-MDSC and Mo-MDSC numbers in HGD between T-bet−/− Rag2−/− and Ccl2−/− T-bet−/− Rag2−/− mice, although the number of mice in each group was small, as few Ccl2−/− T-bet−/− Rag2−/− mice develop HGD (Figure S2B).
Recent studies suggest that Arginase1 (Arg1), IL-10, and reactive oxygen species (ROS) underlie MDSC immunosuppressive activities (Gabrilovich and Nagaraj, 2009). S100A8 and S100A9 also promote MDSC accumulation and enhance their suppressive activity (Sinha et al., 2008). To test if CCL2 alters expression of these factors, we isolated colonic MDSCs from both T-bet−/− Rag2−/− and Ccl2−/− T-bet−/− Rag2−/− mice with either no dysplasia or LGD. Arginase1 and Il10 expression were significantly decreased in colonic MDSCs in Ccl2−/− T-bet−/− Rag2−/− mice in the absence of dysplasia and in LGD (Figure 2D). In Ccl2−/− T-bet−/− Rag2−/− mice, we also observed significant downregulation of S100A8 and S100A9 as well as gp91phox, a component of the NADPH oxidase (Nox2) complex, which is necessary for colonic MDSC ROS production (Figure 2D). Our data support that CCL2 drives MDSC accumulation in the colon as dysplasia develops and that CCL2-driven MDSC functional features, in the absence of adaptive immune responses, contribute to a tumor-permissive microenvironment in colitis-associated CRC development.
CCL2 Enhances Tumor MDSC Accumulation during Colonic ACA Growth
Cancer cells can produce CCL2, leading to recruitment of tumor-promoting myeloid cells into the tumor during carcinogenesis. qRT-PCR analysis of 43 healthy and CRC patients (nine or ten subjects per CRC stage) suggested that CCL2 transcripts were increased in CRC versus normal tissues (Wolf et al., 2012). Based on these data, we sought to confirm that CCL2 protein levels were increased in human colon ACA. Using human tissue microarrays, which included both normal colon tissue (n = 29) and ACA (n = 119), we found that CCL2 levels significantly increased in the ACA samples (Figure 3A).
Figure 3. CCL2 Levels Increase in Human Sporadic CRC and CCL2 Enhances Tumor MDSC Accumulation during Colonic Adenocarcinoma Growth.
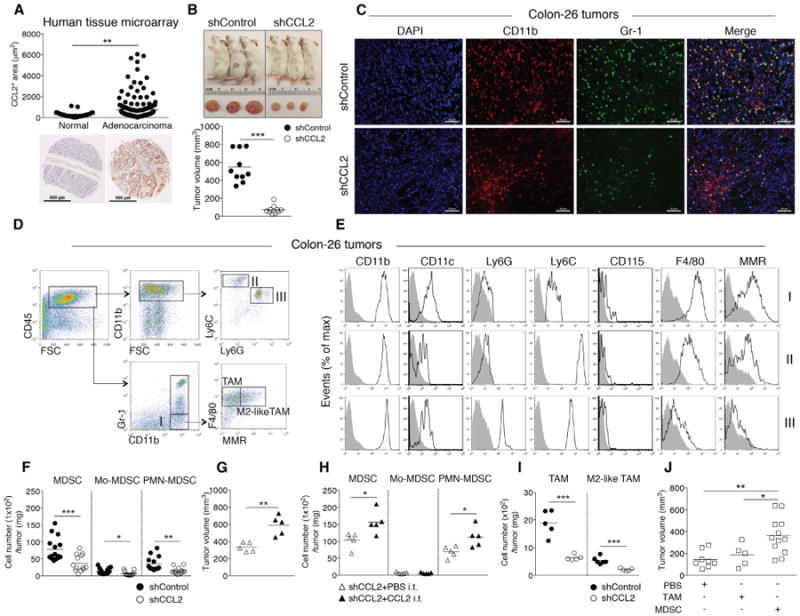
(A) CCL2 levels in human colon adenocarcinoma tissue microarrays (normal, n = 29; adenocarcinoma, n = 119). Representative images are shown. Scale bar, 500 μm.
(B-F) Colon26shGFP (shControl) or Colon26shCCL2-2 (shCCL2) cells were subcutaneously injected into BALB/c mice and tumor growth evaluated at day14. (B) Representative images of tumor-bearing mice (upper panel) and tumor volumes (lower panel). (C) Representative immunofluorescence microscopy images. Tumors were stained with DAPI and for CD11b and Gr-1; single-channel and pseudocolored images. Scale bar, 50 μm. (D) Flow cytometry gating strategy and (E) analysis of intratumoral Mo-MDSCs, PMN-MDSCs, and CD11b+Gr-1− myeloid cells. (F) Intratumoral MDSC, PMN-MDSC, and Mo-MDSC numbers from shControl versus shCCL2 tumor-bearing mice with cell numbers normalized by tumor weight. Symbols represent individual mice.
(G and H) shCCL2 cells were subcutaneously injected into mice and recombinant CCL2 or PBS was intratumorally injected into shCCL2 tumor-bearing mice at day 5 and day 12. Tumor volumes at day 19 (G). Intratumoral MDSC, PMN-MDSC, and Mo-MDSC numbers normalized by tumor weight (H).
(I) Intratumoral TAM and M2-like-TAM cell numbers.
(J) shCCL2 cells were subcutaneously injected into mice, and then sorted TAMs or MDSCs from spleens of shControl tumor-bearing mice were intratumorally injected into shCCL2 tumor-bearing mice at day 5. Tumor volumes were evaluated at day 14.
All data reflect at least three independent experiments. *p < 0.05, **p < 0.01, and ***p < 0.001 (unpaired, two-tailed Student's t test). See also Figure S3.
To examine whether cancer-cell-produced CCL2 affects accumulation and function of MDSC populations in colonic ACAs, we employed the Colon-26 colonic ACA transplantation model (Ohana et al., 2003), as ACAs do not develop in Ccl2−/− T-bet−/− Rag2−/− mice. We perturbed CCL2 expression in Colon-26 cells by generating Colon-26 cell lines with stable short-hairpin RNA (shRNA) knockdown of their endogenous Ccl2 and shRNA for GFP (shControl) as a control. We verified knockdown by CCL2 protein determinations from supernatants of the shCCL2 Colon-26 cell lines and selected one stable cell line (shCCL2) (Figure S3A). We measured tumor volume and size and counted the number of intratumoral MDSCs at day 14 after subcutaneous injection of shControl and shCCL2 stable cell lines. This time point was selected to comply with humane endpoints governing tumor size. shControl tumors were considerably larger (nearly 9-fold) than shCCL2 tumors in volume and size (Figure 3B) (p < 0.0001); however, there was no significant difference in in vitro proliferation between shControl and shCCL2 Colon-26 cells (Figure S3B). As expected, we observed higher intratumoral CCL2 levels in shControl tumor as compared to shCCL2 tumor (Figure S3C).
We examined CD11b+Gr-1+ MDSC accumulation in shControl and shCCL2 tumors using immunofluorescence microscopy (Figure 3C). Next, we characterized the intratumoral myeloid cell populations using flow cytometry (Figures 3D and 3E) as in Figure 2. MDSC numbers increased over 4-fold (p < 0.0001) and Mo-MDSC and PMN-MDSC subpopulations accumulated over 2-fold in the shControl tumors compared to those from shCCL2 tumors (p < 0.05 and p < 0.001, respectively) when normalized by tumor weight (Figure 3F). To confirm if CCL2 was driving increased tumor growth and MDSC accumulation, we performed “add-back” experiments wherein we intratumorally injected recombinant CCL2 or PBS into shCCL2 tumor-bearing mice at day 5 after injection of shCCL2 Colon-26 cells and examined tumor volume and the number of MDSCs at day 14 after injection. Tumor volume was significantly increased in shCCL2 tumor-bearing mice injected with recombinant CCL2 (p < 0.001) (Figure 3G), as were intratumoral MDSC and PMN-MDSC numbers (p < 0.05) (Figure 3H).
To address if CCL2 affects other myeloid cells in the tumor microenvironment, we examined tumor-promoting macrophages, including TAMs (CD11b+Gr-1−F4/80+) and M2-like TAMs (CD11b+Gr-1−F4/80+MMR+). Tumor-promoting macrophages significantly increased in the shControl tumors but were significantly fewer than the MDSC numbers (Figure 3I). There were no statistically significant differences in tumor-associated neutrophils (CD11b+Ly6G+) between shControl and shCCL2 tumor-bearing mice (Figure S3D) (Fridlender et al., 2009).
To determine if MDSCs or TAMs contribute to tumor growth, we sorted splenic MDSCs and TAMs from shControl tumor-bearing mice at day 14 and intratumorally injected the cells into shCCL2 tumor-bearing mice at day 5. shCCL2 tumor-bearing mice injected with MDSCs from shControl tumors showed significantly increased tumor growth as compared with mice receiving TAMs or PBS (Figure 3J). These results indicate that CCL2 drives MDSC accumulation in the tumor microenvironment and support that MDSCs contribute to increased tumor growth.
CCL2 Modulates PMN-MDSC Suppression of T Cells by Increasing PMN-MDSC ROS and Enhancing PMN-MDSC-Mediated Decreases in T Cell Receptor ζ Chain
MDSCs suppress T cell activation (Gabrilovich and Nagaraj, 2009). While there are some similarities among MDSCs (both PMN-MDSCs and Mo-MDSCs), neutrophils, and inflammatory monocytes, a principal difference is that PMN-MDSCs and Mo-MDSCs suppress T cell proliferation but neutrophils and inflammatory monocytes do not (Damuzzo et al., 2015; Gabrilovich et al., 2012). Also, while neutrophils from naive tumor-free mice and intratumoral PMN-MDSCs show similar Ly6C and Ly6G staining, their CCR2 expression differs greatly (Figure S4A). To evaluate the immunosuppressive activity of MDSCs and to determine whether CCL2 in the tumor microenvironment enhances MDSC-mediated suppression of T cells, we examined the inhibition of PMN-MDSCs and Mo-MDSCs on T cell proliferation in vitro. PMN-MDSCs or Mo-MDSCs isolated from shControl and shCCL2 tumors were co-incubated with syngeneic CD4+ or CD8+ T cells, and proliferation of T cells was analyzed by flow cytometry.PMN-MDSCs,but not Mo-MDSCs, from shControl tumors were more effective in suppressing both CD4+ and CD8+ T cell proliferation than PMN-MDSCs from shCCL2 tumors (p < 0.001 and p < 0.05, respectively) (Figures 4A and 4B). We also examined whether CCL2 had similar effects on intratumoral macrophages, including TAMs and M2-like TAMs. Neither TAMs nor M2-like TAMs from shControl tumors inhibited CD4+ T cell proliferation (Figure S4B). Also, there was no significant difference in the suppression of CD4+ and CD8+ T cell proliferation with tumor-promoting macrophages populations (TAMs and M2-like TAMs) from shControl and shCCL2 tumors (Figure S4C).
Figure 4. CCL2 Promotes T Cell Suppression via PMN-MDSCs.
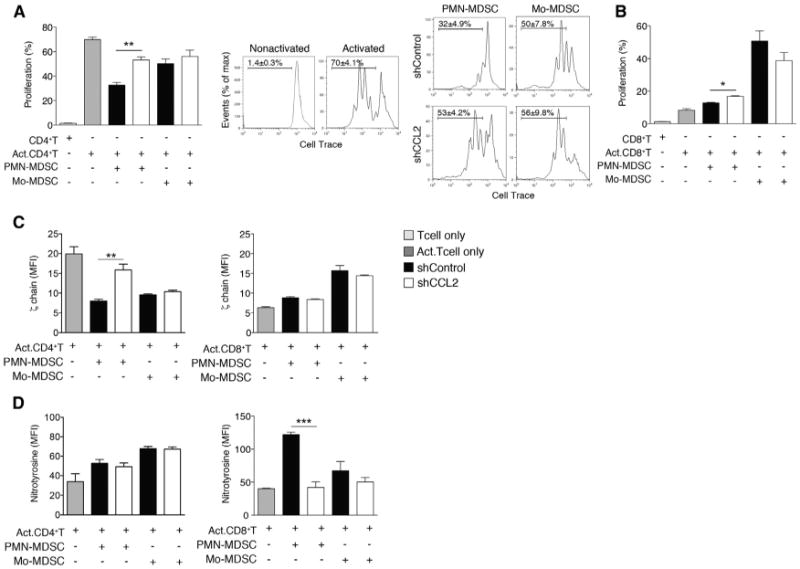
(A and B)T cell proliferation assays. Intratumoral PMN-MDSCs and Mo-MDSCs were sorted from shControl or shCCL2 tumor-bearing mice. (A) CellTrace-labeled splenic CD4+T cells from syngeneic mice were coincubated for 3 days with sorted intratumoral PMN-MDSCs or Mo-MDSCs. Representative flow cytometric analyses of activated or nonactivated CD4+ T cell proliferation and activated CD4+ T cell in the presence of sorted MDSCs are shown. Bar graph shows mean ± SEM of three independent experiments. (B) CellTrace-labeled splenic CD8+T cells were coincubated for 3 days with sorted intratumoral PMN-MDSCs or Mo-MDSCs.
(C and D) Suppressive mechanisms of PMN-MDSCs or Mo-MDSCs on TCR components. ζ chain expression (C) and nitrotyrosine levels (D) of CD4+ T cells or CD8+ T cells coincubated with sorted intratumoral PMN-MDSCs or Mo-MDSCs were measured by flow cytometry. Data, shown as MFI ± SEM, reflect three independent experiments.
*p < 0.05, **p < 0.01, and ***p < 0.001 (unpaired, two-tailed Student's t test). See also Figure S4.
MDSC-mediated suppression of T cells has been associated with altered T cell receptor (TCR) function, ranging from decreased TCR ζ chain expression (Ezernitchi et al., 2006; Sade-Feldman et al., 2013) to the nitration of tyrosines in the TCR signaling complex and subsequent desensitization of the TCR (Nagaraj et al., 2007). To determine whether CCL2 influences MDSC-mediated decreased TCR ζ chain expression and tyrosine nitration, we co-cultured PMN-MDSCs or Mo-MDSCs isolated from shControl and shCCL2 tumors with CD4+ T cells and CD8+ T cells and assessed T cell ζ chain expression and tyrosine nitration. PMN-MDSCs, but not Mo-MDSCs, isolated from shControl tumors resulted in decreased TCR ζ chain expression in CD4+ T cells as compared to PMN-MDSCs from shCCL2 tumor (p < 0.001), whereas this was not observed with CD8+ T cells (Figure 4C). In contrast, expression of nitrotyrosine significantly increased with CD8+ T cells co-cultured with PMN-MDSCs from shControl, but there was no significant induction of tyrosine nitration in CD4+ T cells co-cultured with PMN-MDSCs (Figure 4D).
MDSC immunosuppressive activity has been linked to MDSC Arg1 expression and nitric oxide and ROS production (Gabrilovich et al., 2012). PMN-MDSCs exert T cell inhibition mainly through ROS production, whereas Mo-MDSCs suppress T cells predominantly via the enzymes Arg1 and inducible nitric oxide synthase (iNOS) and through the production of reactive nitrogen species (Gabrilovich and Nagaraj, 2009; Movahedi et al., 2008; Youn et al., 2008). Given that the suppressive activity of PMN-MDSCs increased in shControl tumors (Figure 4A), we examined ROS levels in shControl and shCCL2 tumors by Hydro-Cy3 staining (Leoni et al., 2013). Immunofluorescence staining data supported that ROS levels increased in MDSCs in shControl tumors as compared to shCCL2 tumors (p < 0.00001) (Figure 5A). Using flow cytometry, we found that PMN-MDSCs from shControl tumors showed significantly higher ROS levels as compared to shCCL2 tumors; this was not observed for Mo-MDSCs (Figure 5B).
Figure 5. CCL2 Enhances Function of PMN-MDSCs.

(A) Representative images from shControl and shCCL2 tumors stained with DAPI, and for ROS (Hydro-Cy3), CD11b, and Gr-1. Single-channel pseudocolored and merged images (left panel). Scale bar, 20 μm. Microscopy-based quantitation of MFI of ROS per MDSC from shControl and shCCL2 tumors is shown (right panel).
(B) ROS production levels in intratumoral PMN-MDSCs and Mo-MDSCs from shControl or shCCL2 tumor-bearing mice were detected by DCFDA staining and flow cytometry. Data are shown as MFI ± SEM.
(C and D) Expression levels of gp91phox (C), S100A8 and S100A9 (D) in intratumoral PMN-MDSCs and Mo-MDSCs from shControl or shCCL2 tumors measured by RT-qPCR. Mean relative expression ± SEM are shown.
(E) Expression of iNOS levels (MFI) in sorted intratumoral PMN-MDSCs or Mo-MDSCs from shControl or shCCL2 tumor-bearing mice measured by flow cytometry.
(F) Expression of PD-L1 in sorted tumor-derived PMN-MDSCs or Mo-MDSCs from shControl or shCCL2 tumor-bearing mice measured by flow cytometry. Data are shown as MFI ± SEM.
All data reflect three independent experiments. *p < 0.05, **p < 0.01, and ****p < 0.0001 (unpaired, two-tailed Student's t test). See also Figure S5.
To determine the mechanisms by which CCL2 may influence PMN-MDSC ROS production, we examined gp91phox and p47phox, components of the Nox2 complex (Corzo et al., 2009). PMN-MDSCs, but not Mo-MDSCs, from shControl tumors had elevated gp91phox expression as compared to shCCL2 tumors (Figure 5C). p47phox expression was very low in both MDSC subsets, and there were no differences between shControl and shCCL2 tumors (Figure S5A). S100A8 and S100A9, which promote MDSC accumulation (Sinha et al., 2008), also participate in the formation of the Nox2 complex (Cheng et al., 2008). PMN-MDSCs in shControl tumors had significantly higher levels of S100A8 and S100A9 as compared to shCCL2 tumors, while Mo-MDSCs expressed relatively low levels (Figure 5D). These results are consistent with data suggesting that oxidative stress is involved in MDSC-dependent inhibition of T cell activation through the TCR. Hydrogen peroxide (H2O2) and peroxynitrite (ONOO−) are produced by the combined and cooperative activities of Nox2 complex, Arg1, and iNOS. H2O2 leads to reduced TCR ζ chain expression and peroxynitrite causes nitration of components of the TCR signaling complex (Gabrilovich et al., 2012). We observed that expression of nitrotyrosine significantly increased in CD8+ T cells co-cultured with PMN-MDSCs from shControl tumors (Figure 4D). Next, we asked if Arg1 and iNOS affect the function of PMN-MDSCs in a CCL2-dependent manner. iNOS expression, but not Arg1, increased in both PMN-MDSCs and Mo-MDSCs from shControl versus shCCL2 tumors (Figures 5E and S5B). We also analyzed Arg1 and iNOS expression in intratumoral TAMs and M2-like TAMs, but there were no significant differences between shControl and shCCL2 tumors (Figure S5C).
MDSCs in some tumor sites show differential expression of PD-L1, and blockade of PD-L1 under hypoxic conditions abrogated MDSC-mediated suppression of T cells by modulating MDSC cytokine production (Noman et al., 2014). There is now a large body of preclinical and clinical data supporting that blockade of T cell immune checkpoints can significantly enhance antitumor immunity (Pardoll, 2012; West et al., 2013). Given these data and the effects we observed of CCL2 on MDSCs, we examined if CCL2 affected MDSC PD-L1 expression. In PMN-MDSCs from shCCL2 tumors, there was a modest but not statistically significant decrease in PD-L1 expression as compared to shControl tumors and no difference observed in Mo-MDSCs (Figure 5F). Taken together, our data support that CCL2 influences ROS production and expression of iNOS in colon tumor PMN-MDSCs and affects MDSC-mediated suppression of T cells via alterations to the TCR complex.
CCL2, via STAT3, Regulates PMN-MDSC T-Cell-Suppressive Activity
Prior studies suggest that STAT3 controls MDSC accumulation and suppressive activity via its transcriptional regulation of myeloid cell differentiation and survival (Poschke et al., 2010; Vasquez-Dunddel et al., 2013). In addition, both Nox2 and S100A8/9 are upregulated in a STAT3-dependent manner (Cheng et al., 2008; Corzo et al., 2009). To begin to resolve whether CCL2 regulates PMN-MDSCs and if STAT3 may be directly or indirectly involved, we analyzed intracellular phosphorylated (p-STAT3) levels in PMN-MDSCs. PMN-MDSC pSTAT3 levels from shControl tumors were 4-fold higher than those from shCCL2 tumors (Figures 6A and S6). C/EBPβ is another transcription factor that plays a critical role in regulating MDSC differentiation and immunosuppressive activities (Lechner et al., 2011; Marigo et al., 2010). However, C/ebpβ expression was not different in either PMN-MDSCs or Mo-MDSCs from shControl versus shCCL2 tumors (Figure 6B). To assess if CCL2 was mediating its effects on intratumoral PMN-MDSCs via STAT3, we treated sorted PMN-MDSCs from shControl tumors with the STAT3 inhibitor S3I-201 and confirmed the inhibition of p-STAT3 expression in PMN-MDSCs (Figure 6C). Inhibition of STAT3 signaling in PMN-MDSCs reduced ROS production, as well as expression levels of gp91phox, S100A8, and S100A9 (Figures 6D–6G). We also observed decreased iNOS expression in PMN-MDSCs treated with the STAT3 inhibitor (Figure 6H). Inhibiting STAT3 signaling with S31-201 reduced PMN-MDSC suppression of T cell proliferation and led to alterations in TCR ζ chain expression and tyrosine nitration (Figures 6I–6L). These results support that CCL2 maybe upstream of STAT3 activation and that activation of a CCL2-STAT3 pathway may result in increased suppressive T cell activity through ROS production and gp91phox and S100A8/9 expression in PMN-MDSCs.
Figure 6. CCL2, via STAT3, Regulates PMN-MDSC T-Cell-Suppressive Activity.

(A) Phospho-STAT3 (p-STAT3) levels from PMN-MDSCs from shControl or shCCL2 tumors measured by flow cytometry. Mean ± SEM. **p < 0.001. Unpaired, two-tailed Student's t test.
(B) Expression of C/ebpβ measured by qRT-PCR with data normalized to actin expression (mean relative expression ± SEM).
(C–H) Analysis of sorted intratumoral PMN-MDSCs from the mice with shControl tumors followed by treatment with a STAT3 inhibitor (S3I-201) (50 μM) for 18 hr. Phospho-STAT3 (p-STAT3) levels (C) and ROS levels (DCFDA staining) (D), gp91phox (E) S100A8 (F), S100A9 (G) and iNOS (H) expression levels were measured. Data are shown as mean ± SEM. *p < 0.05, **p < 0.01 (paired, two-tailed Student's t test).
(I–L) Sorted intratumoral PMN-MDSCs from shCCL2 tumor-bearing mice were treated with S31-201 and then coincubated with CD4+ T cells or CD8+ T cells. T cell proliferation assays: CD4+ T cells (I) and CD8+ T cells (J) are shown. Division index represents T cell divisions. *p < 0.05, **p < 0.01 (paired, two-tailed Student's t test). ζ chain expression of CD4+ T cells (K) and nitrotyrosine levels of CD8+ T cells (L) measured by flow cytometry. All data represent two or three independent experiments. *p < 0.05 (paired, two-tailed Student's t test). See also Figure S6.
CCL2 Affects Adenoma Number and MDSC Accumulation in ApcMin/+ Mice
Many sporadic CRCs begin as polyps or adenomas, which are pre-cancerous tumors. Fewer than 10% of all adenomas become ACAs; however, more than 95% of CRCs develop from adenomas. Therefore, identifying treatments for colorectal adenomas to be given at or after their detection is an opportunity for cancer prevention.
Given our results in human tissue samples, mouse models of colitis-associated CRC, and a transplantable CRC model, we examined the level of CCL2 in adenomas. In a human tissue microarray, which included normal colon tissue (n = 38) and adenomas (n = 40), CCL2 was significantly increased in adenomas p < 0.05 (Figure 7A). With these data on increased CCL2 in adenoma and published data showing that MDSCs accumulate in human colorectal adenomas (Kimura et al., 2013), we sought to determine if CCL2 would affect intestinal tumor formation and alter intratumoral MDSCs in a mouse model of intestinal adenomas. ApcMin/+ mice develop small intestinal adenomas with a high penetrance. This model is of preclinical utility, as the APC gene is mutated in over 80% of human cancer and human germline APC mutations are a cause of familial adenomatous polyposis.
Figure 7. CCL2 Affects Adenoma Number and MDSC Accumulation in ApcMin/+ Mice.
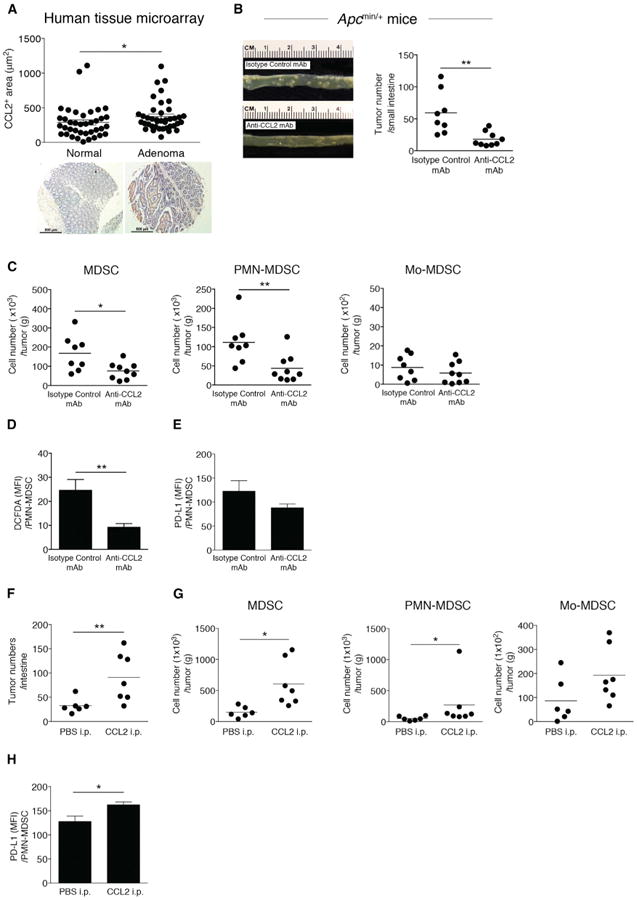
(A) CCL2 levels in human colon adenoma tissue microarrays (normal, n = 38; adenoma, n = 40). Representative images are shown. Scale bar, 500 μm.
(B–E) ApcMin/+ mice were injected with anti-CCL2 or isotype control mAb (10 μg/kg) from 6 to 10 weeks of age twice a week for 4 weeks. (B) Photograph of intestinal tumors from representative mice (left panel). Intestinal tumor counts from ApcMin/+ mice (right panel). Symbols represent data from individual mice.
(C) MDSC, PMN-MDSC, and Mo-MDSC numbers from intestinal tumors from ApcMin/+ mice treated with anti-CCL2 or isotype control mAb, with cell numbers normalized by tumor weight. (D) ROS production levels (DCFDA staining) in intratumoral PMN-MDSCs from ApcMin/+ mice treated with anti-CCL2 or isotype control mAb. (E) Expression of PD-L1 in intratumoral PMN-MDSCs from ApcMin/+ mice treated with anti-CCL2 or isotype control mAb measured by flow cytometry.
(F–H) ApcMin/+ mice were injected with recombinant mouse CCL2 (20 μg/kg) from 6 to 10 weeks of age twice a week for 4 weeks or with PBS as a control. (F) Intestinal tumor counts. (G) Intestinal tumor MDSC, PMN-MDSC, and Mo-MDSC numbers. (H) PD-L1 expression in intratumoral PMN-MDSCs from ApcMin/+ mice treated with recombinant CCL2 or PBS measured by flow cytometry.
All data reflect at least three independent experiments. *p < 0.05 and **p < 0.01 (unpaired, two-tailed Student's t test).
A prior study suggested that Ccl2−/− ApcMin/+ mice developed fewer tumors (McClellan etal., 2012), and while this wasa promising observation, such constitutive deletion has limited translational application to humans. We perturbed CCL2 by injecting ApcMin/+ mice with anti-CCL2 or isotype control monoclonal antibody (mAb). Antibody-mediated CCL2 neutralization reduced small intestinal tumor numbers in ApcMin/+ mice (Figure 7B). Intratumoral MDSC and PMN-MDSC numbers decreased in tumors from ApcMin/+ mice treated with anti-CCL2 mAb, while the number of intratumoral Mo-MDSC were not different (Figure 7C). Intratumoral PMN-MDSC ROS production significantly decreased (Figure 7D). Given the trend we observed in CCL2-mediated intratumoral MDSC PD-L1 levels in the Colon-26 model (Figure 5F), we examined PMN-MDSC PD-L1 expression inApcMin/+ adenomas. We observed a modest decrease in PMN-MDSC PD-L1 expression in adenomas from ApcMin/+ mice treated with anti-CCL2 (Figure 7E). To confirm whether CCL2 was driving increased tumor number and MDSC accumulation in this adenoma mouse model, we performed add-back experiments wherein we intraperitoneally injected recombinant CCL2 or PBS into ApcMin/+ mice every 3 days for 4 weeks. Small intestinal tumor numbers in ApcMin/+ mice treated with recombinant CCL2 significantly increased (Figure 7F), as did intratumoral MDSC and PMN-MDSC numbers (Figure 7G). We found a significant increase of PMN-MDSC PD-L1 expression in adenomas from ApcMin/+ mice treated with recombinant CCL2 (Figure 7H). These data support that CCL2 affects intestinal adenoma numbers as well PMN-MDSC accumulation and function within adenomas. These results, in conjunction with the data from the other preclinical models studied herein, suggest that antibody-mediated neutralization of CCL2 could be a potential therapeutic for CRC prevention and interception.
Discussion
Tumor-associated inflammation contributes to cancer growth and spread, and intratumoral immune cells influence patient prognosis and survival (Galon et al., 2013; Jochems and Schlom, 2011). While various immune cells and immunomodulatory factors have been linked to increased cancer metastatic potential, identifying immune checkpoints at the earliest stages of cancer development and leveraging such discoveries to prevent cancer development and progression has been a challenge especially in CRC. Here, focusing on CCL2 in mouse models of CRC, we demonstrate that CCL2 functionsas a neoplastic factor that regulates MDSC accumulation and function and fosters a tumor permissive-microenvironment that influences early-stage colon carcinogenesis. We also show that constitutive deletion or antibody-mediated neutralization of CCL2 halts neoplastic progression in an inflammation-associated CRC model and APC-driven intestinal tumors in mice, respectively, providing a rationale for the therapeutic potential of CCL2 inhibitors and neutralizing antibodies in CRC prevention and treatment.
MDSCs have emerged as key effector cellsin the tumor micro-environment of many solid tumor malignancies, and our understanding of the factors that influence MDSC recruitment and function continues to expand. For example, ACA-produced granulocyte-macrophage colony-stimulating factor recruits immature myeloid cells that accumulate in pancreatic ductal ACAs in mice, thwarts CD8+T cell-mediated anti-tumor immunity, and alters splenic MDSC proliferation and function (Bayne et al., 2012). In the dextran sodium sulfate (DSS)-azoxymethane (AOM) model of inflammation-associated CRC, loss of CXCR2 resulted in reduced tumor number, and CXCR2 expression on MDSCs was a key underlying mechanism (Katoh et al., 2013). Based on our data, CCL2 contributes to intratumoral MDSC accumulation and also influences MDSC-mediated suppression of CD4+ and CD8+ T cells via distinct pathways.
Several factors have been implicated in the T-cell-suppressive activities of MDSCs. Our data support that CCL2 influences PMN-MDSC ROS production via regulation of gp91phox, S100A8, and S100A9, likely mediated by STAT3 activation. While MDSC-produced ROS is known to influence TCR ζ chain expression, our experiments enabled us to identify key components of the pathway by which CCL2 regulates ROS production in PMN-MDSCs. ROS play a myriad of roles in carcinogenesis and influence not only cancer death and survival but also responsiveness to chemotherapy and radiation. Our data on ROS were selectively focused on how CCL2 regulates ROS in PMN-MDSCs and its subsequent role in suppressing T cells. We observed that CCL2 also influences iNOS levels in both Mo-MDSC and PMN-MDSCs. Tyrosine nitrosylation of the TCR complex is another mechanism by which MDSCs mediated suppression of T cells, and our data support that CCL2 plays a role here. MDSCs utilize several overlapping mechanisms of suppression and prior work has often focused on disrupting selective MDSC functions. In contrast, our study, which utilizes multiple mouse models, unveils that CCL2 regulates several suppressive functions of MDSCs with consequences for both the innate and adaptive immune contribution to colorectal tumorigenesis.
Our finding that CCL2 influenced early-stage CRC and MDSCs rather than macrophages was unexpected given the literature on CCL2 in human metastatic prostate cancer, metastatic breast cancer (humans and mouse models), and the DSS-AOM model (McClellan et al., 2012; Mizutani et al., 2009; Popivanova et al., 2009; Qian et al., 2011). Furthermore, our data that CCL2 perturbations affected early-stage colorectal carcinogenesis both in the presence and absence of macroscopic inflammation were unanticipated, given the distinct molecular pathways underpinning colitis-associated versus sporadic CRC (Clausen et al., 2001; Itzkowitz, 2003).
Beyond immune cells in the tumor microenvironment contributing to carcinogenesis, the microbiota has also emerged as a focus of recent interest (Garrett, 2015; Sears and Garrett, 2014). Fusobacterium nucleatum is a Gram-negative oral bacterium that is enriched in colon cancers and adenomas (Castellarin et al., 2012; Kostic et al., 2012; McCoy et al., 2013) and has been associated with increased MDSC tumor infiltration in the ApcMin/+ model in the absence of macroscopic inflammation (Kostic et al., 2013). While the mice in this study did not harbor F. nucleatum, it is notable that F. nucleatum elicits high levels of CCL2 from the oral epithelium (Milward et al., 2007). Perhaps CCL2 is a common node by which bacteria in tumors or cancer cells themselves seek to evade immune destruction by enlisting MDSCs.
Given the unanticipated nature of some of our findings regarding CCL2's effects on tumor development, we sought to validate the clinical relevance and translational potential of our findings by examining a small subset of human patients with IBD-associated CRC, colon ACA tissue microarrays, and a colon adenoma tissue microarray. Based on these human data, our findings of antibody-mediated CCL2 neutralization in ApcMin/+ mice, and our experiments suggesting that there is a CCL2-MDSC immune checkpoint at the earliest stage of CRC development, more CCL2-directed therapies are warranted and merit consideration in CRC prevention.
A recent study reported that CCL2 neutralization decreased breast cancer metastases in mice, but interruption of CCL2 inhibition led to increased metastases and decreased survival (Bonapace et al., 2014). This study suggests that tumor type and timing for a CCL2-directed therapy are critical and more broadly highlights the dynamic nature of cancer's responsiveness to a therapeutic. During some window of time, a particular therapy may be very beneficial, but as cancer evolves and spreads, that same treatment may worsen cancer progression. CCL2-directed therapies may indeed have a very specific therapeutic window. Our studies support that CCL2-neutralizing therapies may play an important role in early-stage high-risk colon cancer treatment and represent a promising application of immunotherapy in colon cancer prevention.
Immunotherapies, to date, fall into three general categories: cancer vaccines, adoptive cell therapies, and immune checkpoint inhibitors (Allard et al., 2013; Pajtasz-Piasecka et al., 2008). In the last few years, immune checkpoint inhibitors have showed enormous promise in melanoma, renal cell cancer, non-small cell lung cancer, and bladder cancer (Bailey and McDermott, 2013; Langer, 2014; Ott et al., 2013). In particular, antibodies targeting the PD-1, PD-L1, and CTLA4 checkpoints appear very promising for these solid malignancies. However, it remains to be determined why targeting these immune checkpoint inhibitors is more efficacious in some solid tumor malignancies versus others and in some, but not all, patients with the same malignancy. Our findings that CCL2 influences the expression of PD-L1 in PMN-MDSCs and that CCL2 promotes PMN-MDSC-mediated suppression of T cells raise the question of whether intratumoral CCL2, PMN-MDSCs, and CCL2/PMN-MDSC-mediated suppression of T cells may be important factors to consider when determining why current immune checkpoint therapies may not work for all patients. We suggest that intratumoral or serum CCL2 and PMN-MDSC levels may be useful to select patients for current immune checkpoint therapies and that CCL2 neutralizing agents may be needed to enhance responsiveness to current immune checkpoint directed therapies in some patients. A caveat of our work is that there may be differences between MDSCs generated from human peripheral blood and mouse MDSCs (Lechner et al., 2010). Future studies should be carried out in human colorectal adenomas and ACAs to better characterize MDSC subsets and functionality, ideally, in response to CCL2 neutralization.
Experimental Procedures
Human Samples
De-identified formalin fixed paraffin-embedded colonic tissue samples from IBD patients with active colitis, LGD, HGD, and ACA were obtained from Brigham and Women's Hospital. Pathology was evaluated by G.S and R.O.
Animals and Tumor Models
All mice (BALB/c, BALB/c T-bet−/− Rag2−/−, BALB/c Ccl2−/−T-bet−/− Rag2−/−, and C57BL/6-ApcMin/+) were maintained in the barrier facility at the Harvard T.H. Chan School of Public Health. For the generation of BALB/c Ccl2−/− T-bet−/− Rag2−/− mice, T-bet−/− Rag2−/− mice were bred to the Ccl2−/− mice on the BALB/cJ background, which were obtained from the investigator who generated them (Prof. Barrett Rollins, Dana-Farber Cancer Institute). Genotyping for Ccl2 was performed according to the instructions from the vendor and for T-bet and Rag2 as previously described (Garrett et al., 2007, 2009). Wild-type (WT) BALB/c mice (6–8 weeks) were bred in-house and originally obtained from Jackson Laboratory. All mice are female. All experimentation was carried out in accordance with institutional guidelines. For the Colon-26 transplantation model, shControl or shCCL2 Colon-26 cells (2 × 10⁶) were subcutaneously injected into the flank of WT BALB/c mice (6–8 weeks). For details on additional mouse model experimentation, see Supplemental Experimental Procedures.
Tissue Microarray Analysis
Arrays CO727 and CO2085b included both colon ACA and normal colon tissue. Array CO809a included colon adenoma and normal colon tissue. For details, see Supplemental Experimental Procedures.
Statistical Analysis
Student's t test or the two-way ANOVA was performed using GraphPad Prism software (version 6.0).
Supplementary Material
Figure S1, related to Figure 1. Increased CCL2 contributes to progression from dysplasia to ACA in human and mouse colitis-associated colorectal cancer
(A) Representative CCL2 staining images of human tissue sections, scale bar 200 micrometers. (B) Representative H&E staining of the colon from T-bet-/- Rag2-/- and Ccl2-/- T-bet-/- Rag2-/- mice, scale bar 200 micrometers. (C) Histologic colitis scores for Ccl2-/- T-bet-/- Rag2-/- and T-bet-/- Rag2-/- mice across the neoplastic continuum. Symbols represent data from individual mice.
Figure S2, related to Figure 2. Analysis of colonic myeloid cell populations from Ccl2-/- T-bet-/- Rag2-/- and T-bet-/- Rag2-/- mice
(A) Gr-1 and CCR2 expression levels on populations I-III as gated in Figure 2A. (B) Colonic myeloid cell populations from Ccl2-/- T-bet-/- Rag2-/- and T-bet-/- Rag2-/- mice with high-grade dysplasia. Left panel: the numbers of Colonic CD11b+ myeloid cells, MDSCs (CD11b+Gr-1+) and macrophages (CD11b+Gr-1-). Right panel: the numbers of PMN-MDSCs (CD11b+Ly6G+Ly6Clow), Mo-MDSCs (CD11b+Ly6G-Ly6Chigh) and M2-like TAMs (CD11b+Gr-1-F4/80+MMR+). Symbols represent data from individual mice.
Figure S3, related to Figure 3. Analysis of intratumoral CCL2 levels and gating strategy for myeloid cell subset identification
(A) CCL2 protein determinations of shCCL2 Colon-26 cell lines and Colon26shGFP (shControl) quantitated by ELISA. (B) Proliferation of shControl and shCCL2 cells using the MTS assay. Data shown as MFI ± SEM. (C) Intratumoral CCL2 protein determinations from shControl and shCCL2 tumor-bearing mice by ELISA, mean ± SEM. Data represent three independent experiments with 3-4 mice per experiment. (D) The percentage and number of tumor-associated neutrophils. Symbols represent data from individual mice.
**P< 0.01, ***P< 0.001. Unpaired, two-tailed Student's t test.
Figure S4, related to Figure 4. Analysis of neutrophils and T cell suppressive activity of tumor-promoting macrophages
(A) Flow cytometric analysis of neutrophils and PMN-MDSCs, left panel: Ly6C and Ly6G staining, right panel: CCR2 staining. ***P< 0.001. Unpaired, two-tailed Student's t test. (B) Intratumoral TAMs and M2-like TAMs were sorted from shControl tumor-bearing mice. CellTrace™-labeled splenic CD4+T cells were coincubated with sorted TAMs or M2-like TAMs. Representative flow cytometric analysis of CD4+ T cell proliferation in the presence of sorted tumor-promoting macrophages is shown. (C) Intratumoral tumor-promoting macrophages (TAMs and M2-like TAMs) were sorted from shControl or shCCL2 tumor-bearing mice. CellTrace™-labeled splenic CD4+ or CD8+ T cells were coincubated with both tumor-promoting macrophage. Bar graph shows mean ± SEM of two independent experiments.
Figure S5, related to Figure 5. Functional gene or protein expression in MDSCs or tumor-promoting macrophages
(A-B) Expression levels of p47phox (RT-qPCR) (A) and Arginase1 (flow cytometry) (B) in intratumoral PMN-MDSCs and Mo-MDSCs from shControl or shCCL2 tumors. Mean relative expression ± SEM from three independent experiments. (C) Expression of Arginase 1 and iNOS levels (MFI) in sorted intratumoral TAMs and M2-like TAMs from shControl or shCCL2 tumor-bearing mice measured by flow cytometry. Data reflect two independent experiments.
Figure S6, related to Figure 6. Flow analysis of phospho-STAT3 levels
Phospho-STAT3 (p-STAT3) levels in PMN-MDSCs from shControl or shCCL2 tumors measured by flow cytometry. A representative flow cytometry image is shown.
Highlights.
CCL2 is elevated in human dysplastic colon lesions, adenoma, and adenocarcinoma
CCL2 affects MDSC accumulation and function in colonic carcinogenesis
CCL2 modulates T cell suppression of PMN-MDSCs in a STAT3-mediated fashion
CCL2 neutralization re-shapes the tumor microenvironment, halting colon cancer
Acknowledgments
We thank members of the Garrett lab and Dr. Mikael Pittet for discussions and advice. We thank Yo Sup Moon and Dr. Curtis Huttenhower for thoughtful discussions about transcriptomics and cancer. This study was supported by R01CA154426 (NCI), K08AI078942 (NIAID), a Burroughs Wellcome Career in Medical Sciences Award, a Searle Scholars Award, and a Cancer Research Institute Investigator Award.
Footnotes
Supplemental Information: Supplemental Information includes Supplemental Experimental Procedures and six figures and can be found with this article online at http://dx.doi.org/10.1016/j.celrep.2015.06.024.
References
- Allard B, Pommey S, Smyth MJ, Stagg J. Targeting CD73 enhances the antitumor activity of anti-PD-1 and anti-CTLA-4 mAbs. Clin Cancer Res. 2013;19:5626–5635. doi: 10.1158/1078-0432.CCR-13-0545. [DOI] [PubMed] [Google Scholar]
- Bailey A, McDermott DF. Immune checkpoint inhibitors as novel targets for renal cell carcinoma therapeutics. Cancer J. 2013;19:348–352. doi: 10.1097/PPO.0b013e31829e3153. [DOI] [PubMed] [Google Scholar]
- Bayne LJ, Beatty GL, Jhala N, Clark CE, Rhim AD, Stanger BZ, Vonderheide RH. Tumor-derived granulocyte-macrophage colony-stimulating factor regulates myeloid inflammation and T cell immunity in pancreatic cancer. Cancer Cell. 2012;21:822–835. doi: 10.1016/j.ccr.2012.04.025. [DOI] [PMC free article] [PubMed] [Google Scholar]
- Bonapace L, Coissieux MM, Wyckoff J, Mertz KD, Varga Z, Junt T, Bentires-Alj M. Cessation of CCL2 inhibition accelerates breast cancer metastasis by promoting angiogenesis. Nature. 2014;515:130–133. doi: 10.1038/nature13862. [DOI] [PubMed] [Google Scholar]
- Castellarin P, Stevenson K, Biasotto M, Yuan A, Woo SB, Treister NS. Extensive dental caries in patients with oral chronic graft-versus-host disease. Biol Blood Bone Marrow Transplant. 2012;18:1573–1579. doi: 10.1016/j.bbmt.2012.04.009. [DOI] [PubMed] [Google Scholar]
- Cheng P, Corzo CA, Luetteke N, Yu B, Nagaraj S, Bui MM, Ortiz M, Nacken W, Sorg C, Vogl T, et al. Inhibition of dendritic cell differentiation and accumulation of myeloid-derived suppressor cells in cancer is regulated by S100A9. protein J Exp Med. 2008;205:2235–2249. doi: 10.1084/jem.20080132. [DOI] [PMC free article] [PubMed] [Google Scholar]
- Clausen OP, Andersen SN, Strøomkjaer H, Nielsen V, Rognum TO, Bolund L, Køolvraa S. A strategy combining flow sorting and comparative genomic hybridization for studying genetic aberrations at different stages of colorectal tumorigenesis in ulcerative colitis. Cytometry. 2001;43:46–54. doi: 10.1002/1097-0320(20010101)43:1<46::aid-cyto1018>3.0.co;2-u. [DOI] [PubMed] [Google Scholar]
- Corzo CA, Cotter MJ, Cheng P, Cheng F, Kusmartsev S, Sotomayor E, Padhya T, McCaffrey TV, McCaffrey JC, Gabrilovich DI. Mechanism regulating reactive oxygen species in tumor-induced myeloid-derived suppressor cells. J Immunol. 2009;182:5693–5701. doi: 10.4049/jimmunol.0900092. [DOI] [PMC free article] [PubMed] [Google Scholar]
- Damuzzo V, Pinton L, Desantis G, Solito S, Marigo I, Bronte V, Mandruzzato S. Complexity and challenges in defining myeloid-derived suppressor cells. Cytometry B Clin Cytom. 2015;88:77–91. doi: 10.1002/cyto.b.21206. [DOI] [PMC free article] [PubMed] [Google Scholar]
- Diaz-Montero CM, Salem ML, Nishimura MI, Garrett-Mayer E, Cole DJ, Montero AJ. Increased circulating myeloid-derived suppressor cells correlate with clinical cancer stage, metastatic tumor burden, and doxorubicin-cyclophosphamide chemotherapy. Cancer Immunol Immun-other. 2009;58:49–59. doi: 10.1007/s00262-008-0523-4. [DOI] [PMC free article] [PubMed] [Google Scholar]
- Ermann J, Garrett WS, Kuchroo J, Rourida K, Glickman JN, Bleich A, Glimcher LH. Severity of innate immune-mediated colitis is controlled by the cytokine deficiency-induced colitis susceptibility-1 (Cdcs1) locus. Proc Natl Acad Sci USA. 2011;108:7137–7141. doi: 10.1073/pnas.1104234108. [DOI] [PMC free article] [PubMed] [Google Scholar]
- Ezernitchi AV, Vaknin I, Cohen-Daniel L, Levy O, Manaster E, Halabi A, Pikarsky E, Shapira L, Baniyash M. TCR zeta down-regulation under chronic inflammation is mediated by myeloid suppressor cells differentially distributed between various lymphatic organs. J Immunol. 2006;177:4763–4772. doi: 10.4049/jimmunol.177.7.4763. [DOI] [PubMed] [Google Scholar]
- Fader AN, Rasool N, Vaziri SA, Kozuki T, Faber PW, Elson P, Biscotti CV, Michener CM, Rose PG, Rojas-Espaillat L, et al. CCL2 expression in primary ovarian carcinoma is correlated with chemotherapy response and survival outcomes. Anticancer Res. 2010;30:4791–4798. [PubMed] [Google Scholar]
- Franklin RA, Liao W, Sarkar A, Kim MV, Bivona MR, Liu K, Pamer EG, Li MO. The cellular and molecular origin of tumor-associated macrophages. Science. 2014;344:921–925. doi: 10.1126/science.1252510. [DOI] [PMC free article] [PubMed] [Google Scholar]
- Fridlender ZG, Sun J, Kim S, Kapoor V, Cheng G, Ling L, Worthen GS, Albelda SM. Polarization of tumor-associated neutrophil phenotype by TGF-beta: “N1” versus “N2” TAN. Cancer Cell. 2009;16:183–194. doi: 10.1016/j.ccr.2009.06.017. [DOI] [PMC free article] [PubMed] [Google Scholar]
- Gabrilovich DI, Nagaraj S. Myeloid-derived suppressor cells as regulators of the immune system. Nat Rev Immunol. 2009;9:162–174. doi: 10.1038/nri2506. [DOI] [PMC free article] [PubMed] [Google Scholar]
- Gabrilovich DI, Ostrand-Rosenberg S, Bronte V. Coordinated regulation of myeloid cells by tumours. Nat Rev Immunol. 2012;12:253–268. doi: 10.1038/nri3175. [DOI] [PMC free article] [PubMed] [Google Scholar]
- Galon J, Angell HK, Bedognetti D, Marincola FM. The continuum of cancer immunosurveillance: prognostic, predictive, and mechanistic signatures. Immunity. 2013;39:11–26. doi: 10.1016/j.immuni.2013.07.008. [DOI] [PubMed] [Google Scholar]
- Garrett WS. Cancer and the microbiota. Science. 2015;348:80–86. doi: 10.1126/science.aaa4972. [DOI] [PMC free article] [PubMed] [Google Scholar]
- Garrett WS, Lord GM, Punit S, Lugo-Villarino G, Mazmanian SK, Ito S, Glickman JN, Glimcher LH. Communicable ulcerative colitis induced by T-bet deficiency in the innate immune system. Cell. 2007;131:33–45. doi: 10.1016/j.cell.2007.08.017. [DOI] [PMC free article] [PubMed] [Google Scholar]
- Garrett WS, Punit S, Gallini CA, Michaud M, Zhang D, Sigrist KS, Lord GM, Glickman JN, Glimcher LH. Colitis-associated colorectal cancer driven by T-bet deficiency in dendritic cells. Cancer Cell. 2009;16:208–219. doi: 10.1016/j.ccr.2009.07.015. [DOI] [PMC free article] [PubMed] [Google Scholar]
- Hanahan D, Coussens LM. Accessories to the crime: functions of cells recruited to the tumor microenvironment. Cancer Cell. 2012;21:309–322. doi: 10.1016/j.ccr.2012.02.022. [DOI] [PubMed] [Google Scholar]
- Itzkowitz S. Colon carcinogenesis in inflammatory bowel disease: applying molecular genetics to clinical practice. J Clin Gastroenterol. 2003;36:S70–S74. doi: 10.1097/00004836-200305001-00012. discussion S94–S76. [DOI] [PubMed] [Google Scholar]
- Jochems C, Schlom J. Tumor-infiltrating immune cells and prognosis: the potential link between conventional cancer therapy and immunity. Exp Biol Med (Maywood) 2011;236:567–579. doi: 10.1258/ebm.2011.011007. [DOI] [PMC free article] [PubMed] [Google Scholar]
- Kang JC, Chen JS, Lee CH, Chang JJ, Shieh YS. Intratumoral macrophage counts correlate with tumor progression in colorectal cancer. J Surg Oncol. 2010;102:242–248. doi: 10.1002/jso.21617. [DOI] [PubMed] [Google Scholar]
- Katoh H, Wang D, Daikoku T, Sun H, Dey SK, Dubois RN. CXCR2-expressing myeloid-derived suppressor cells are essential to promote colitis-associated tumorigenesis. Cancer Cell. 2013;24:631–644. doi: 10.1016/j.ccr.2013.10.009. [DOI] [PMC free article] [PubMed] [Google Scholar]
- Kimura T, McKolanis JR, Dzubinski LA, Islam K, Potter DM, Salazar AM, Schoen RE, Finn OJ. MUC1 vaccine for individuals with advanced adenoma of the colon: a cancer immunoprevention feasibility study. Cancer Prev Res (Phila) 2013;6:18–26. doi: 10.1158/1940-6207.CAPR-12-0275. [DOI] [PMC free article] [PubMed] [Google Scholar]
- Kostic AD, Gevers D, Pedamallu CS, Michaud M, Duke F, Earl AM, Ojesina AI, Jung J, Bass AJ, Tabernero J, et al. Genomic analysis identifies association of Fusobacterium with colorectal carcinoma. Genome Res. 2012;22:292–298. doi: 10.1101/gr.126573.111. [DOI] [PMC free article] [PubMed] [Google Scholar]
- Kostic AD, Chun E, Robertson L, Glickman JN, Gallini CA, Michaud M, Clancy TE, Chung DC, Lochhead P, Hold GL, et al. Fusobacterium nucleatum potentiates intestinal tumorigenesis and modulates the tumor-immune microenvironment. Cell Host Microbe. 2013;14:207–215. doi: 10.1016/j.chom.2013.07.007. [DOI] [PMC free article] [PubMed] [Google Scholar]
- Langer CJ. Emerging immunotherapies in the treatment of non-small cell lung cancer (NSCLC): the role of immune checkpoint inhibitors. Am J Clin Oncol. 2014 doi: 10.1097/COC.0000000000000059. Published online March 28, 2014. http://dx.doi.org/10.1097/COC.0000000000000059. [DOI] [PubMed]
- Lazennec G, Richmond A. Chemokines and chemokine receptors: new insights into cancer-related inflammation. Trends Mol Med. 2010;16:133–144. doi: 10.1016/j.molmed.2010.01.003. [DOI] [PMC free article] [PubMed] [Google Scholar]
- Lechner MG, Liebertz DJ, Epstein AL. Characterization of cytokine-induced myeloid-derived suppressor cells from normal human peripheral blood mononuclear cells. J Immunol. 2010;185:2273–2284. doi: 10.4049/jimmunol.1000901. [DOI] [PMC free article] [PubMed] [Google Scholar]
- Lechner MG, Megiel C, Russell SM, Bingham B, Arger N, Woo T, Epstein AL. Functional characterization of human Cd33+ and Cd11b+ myeloid-derived suppressor cell subsets induced from peripheral blood mononuclear cells co-cultured with a diverse set of human tumor cell lines. J Transl Med. 2011;9:90. doi: 10.1186/1479-5876-9-90. [DOI] [PMC free article] [PubMed] [Google Scholar]
- Leoni G, Alam A, Neumann PA, Lambeth JD, Cheng G, McCoy J, Hilgarth RS, Kundu K, Murthy N, Kusters D, et al. Annexin A1, formyl peptide receptor, and NOX1 orchestrate epithelial repair. J Clin Invest. 2013;123:443–454. doi: 10.1172/JCI65831. [DOI] [PMC free article] [PubMed] [Google Scholar]
- Marigo I, Bosio E, Solito S, Mesa C, Fernandez A, Dolcetti L, Ugel S, Sonda N, Bicciato S, Falisi E, et al. Tumor-induced tolerance and immune suppression depend on the C/EBPbeta transcription factor. Immunity. 2010;32:790–802. doi: 10.1016/j.immuni.2010.05.010. [DOI] [PubMed] [Google Scholar]
- McClellan JL, Davis JM, Steiner JL, Enos RT, Jung SH, Carson JA, Pena MM, Carnevale KA, Berger FG, Murphy EA. Linking tumor-associated macrophages, inflammation, and intestinal tumorigenesis: role of MCP-1. Am J Physiol Gastrointest Liver Physiol. 2012;303:G1087–G1095. doi: 10.1152/ajpgi.00252.2012. [DOI] [PMC free article] [PubMed] [Google Scholar]
- McCoy AN, Araújo-Pérez F, Azcárate-Peril A, Yeh JJ, Sandler RS, Keku TO. Fusobacterium is associated with colorectal adenomas. PLoS ONE. 2013;8:e53653. doi: 10.1371/journal.pone.0053653. [DOI] [PMC free article] [PubMed] [Google Scholar]
- Milward MR, Chapple IL, Wright HJ, Millard JL, Matthews JB, Cooper PR. Differential activation of NF-kappaB and gene expression in oral epithelial cells by periodontal pathogens. Clin Exp Immunol. 2007;148:307–324. doi: 10.1111/j.1365-2249.2007.03342.x. [DOI] [PMC free article] [PubMed] [Google Scholar]
- Mizutani K, Sud S, McGregor NA, Martinovski G, Rice BT, Craig MJ, Varsos ZS, Roca H, Pienta KJ. The chemokine CCL2 increases prostate tumor growth and bone metastasis through macrophage and osteoclast recruitment. Neoplasia. 2009;11:1235–1242. doi: 10.1593/neo.09988. [DOI] [PMC free article] [PubMed] [Google Scholar]
- Movahedi K, Guilliams M, Van den Bossche J, Van den Bergh R, Gysemans C, Beschin A, De Baetselier P, Van Ginderachter JA. Identification of discrete tumor-induced myeloid-derived suppressor cell sub-populations with distinct T cell-suppressive activity. Blood. 2008;111:4233–4244. doi: 10.1182/blood-2007-07-099226. [DOI] [PubMed] [Google Scholar]
- Nagaraj S, Gupta K, Pisarev V, Kinarsky L, Sherman S, Kang L, Herber DL, Schneck J, Gabrilovich DI. Altered recognition of antigen is a mechanism of CD8+ T cell tolerance in cancer. Nat Med. 2007;13:828–835. doi: 10.1038/nm1609. [DOI] [PMC free article] [PubMed] [Google Scholar]
- Noman MZ, Desantis G, Janji B, Hasmim M, Karray S, Dessen P, Bronte V, Chouaib S. PD-L1 is a novel direct target of HIF-1α, and its blockade under hypoxia enhanced MDSC-mediated T cell activation. J Exp Med. 2014;211:781–790. doi: 10.1084/jem.20131916. [DOI] [PMC free article] [PubMed] [Google Scholar]
- Ohana G, Bar-Yehuda S, Arich A, Madi L, Dreznick Z, Rath-Wolfson L, Silberman D, Slosman G, Fishman P. Inhibition of primary colon carcinoma growth and liver metastasis by the A3 adenosine receptor agonist CF101. Br J Cancer. 2003;89:1552–1558. doi: 10.1038/sj.bjc.6601315. [DOI] [PMC free article] [PubMed] [Google Scholar]
- Ott PA, Hodi FS, Robert C. CTLA-4 and PD-1/PD-L1 blockade: new immunotherapeutic modalities with durable clinical benefit in melanoma patients. Clin Cancer Res. 2013;19:5300–5309. doi: 10.1158/1078-0432.CCR-13-0143. [DOI] [PubMed] [Google Scholar]
- Pajtasz-Piasecka E, Rossowska J, Duś D, Weber-Dabrowska B, Zabtocka A, Górski A. Bacteriophages support anti-tumor response initiated by DC-based vaccine against murine transplantable colon carcinoma. Immunol Lett. 2008;116:24–32. doi: 10.1016/j.imlet.2007.11.004. [DOI] [PubMed] [Google Scholar]
- Pardoll DM. The blockade of immune checkpoints in cancer immuno-therapy. Nat Rev Cancer. 2012;12:252–264. doi: 10.1038/nrc3239. [DOI] [PMC free article] [PubMed] [Google Scholar]
- Pearson C, Uhlig HH, Powrie F. Lymphoid microenvironments and innate lymphoid cells in the gut. Trends Immunol. 2012;33:289–296. doi: 10.1016/j.it.2012.04.004. [DOI] [PubMed] [Google Scholar]
- Popivanova BK, Kostadinova FI, Furuichi K, Shamekh MM, Kondo T, Wada T, Egashira K, Mukaida N. Blockade of a chemokine, CCL2, reduces chronic colitis-associated carcinogenesis in mice. Cancer Res. 2009;69:7884–7892. doi: 10.1158/0008-5472.CAN-09-1451. [DOI] [PubMed] [Google Scholar]
- Poschke I, Mougiakakos D, Hansson J, Masucci GV, Kiessling R. Immature immunosuppressive CD14+HLA-DR-/low cells in melanoma patients are Stat3hi and overexpress CD80, CD83, and DC-sign. Cancer Res. 2010;70:4335–4345. doi: 10.1158/0008-5472.CAN-09-3767. [DOI] [PubMed] [Google Scholar]
- Qian BZ, Li J, Zhang H, Kitamura T, Zhang J, Campion LR, Kaiser EA, Snyder LA, Pollard JW. CCL2 recruits inflammatory monocytes to facilitate breast-tumour metastasis. Nature. 2011;475:222–225. doi: 10.1038/nature10138. [DOI] [PMC free article] [PubMed] [Google Scholar]
- Sade-Feldman M, Kanterman J, Ish-Shalom E, Elnekave M, Horwitz E, Baniyash M. Tumor necrosis factor-α blocks differentiation and enhances suppressive activity of immature myeloid cells during chronic inflammation. Immunity. 2013;38:541–554. doi: 10.1016/j.immuni.2013.02.007. [DOI] [PubMed] [Google Scholar]
- Schall TJ, Proudfoot AE. Overcoming hurdles in developing successful drugs targeting chemokine receptors. Nat Rev Immunol. 2011;11:355–363. doi: 10.1038/nri2972. [DOI] [PubMed] [Google Scholar]
- Sears CL, Garrett WS. Microbes, microbiota, and colon cancer. Cell Host Microbe. 2014;15:317–328. doi: 10.1016/j.chom.2014.02.007. [DOI] [PMC free article] [PubMed] [Google Scholar]
- Sica A, Mantovani A. Macrophage plasticity and polarization in vivo veritas. J Clin Invest. 2012;122:787–795. doi: 10.1172/JCI59643. [DOI] [PMC free article] [PubMed] [Google Scholar]
- Sinha P, Okoro C, Foell D, Freeze HH, Ostrand-Rosenberg S, Srikrishna G. Proinflammatory S100 proteins regulate the accumulation of myeloid-derived suppressor cells. J Immunol. 2008;181:4666–4675. doi: 10.4049/jimmunol.181.7.4666. [DOI] [PMC free article] [PubMed] [Google Scholar]
- Tenesa A, Dunlop MG. New insights into the aetiology of colorectal cancer from genome-wide association studies. Nat Rev Genet. 2009;10:353–358. doi: 10.1038/nrg2574. [DOI] [PubMed] [Google Scholar]
- Tsuyada A, Wang SE. Fibroblast-derived CCL2induces cancer stem cells—response. Cancer Res. 2013;73:1032–1033. doi: 10.1158/0008-5472.CAN-12-3194. [DOI] [PMC free article] [PubMed] [Google Scholar]
- Vasquez-Dunddel D, Pan F, Zeng Q, Gorbounov M, Albesiano E, Fu J, Blosser RL, Tam AJ, Bruno T, Zhang H, et al. STAT3 regulates arginase-I in myeloid-derived suppressor cells from cancer patients. J Clin Invest. 2013;123:1580–1589. doi: 10.1172/JCI60083. [DOI] [PMC free article] [PubMed] [Google Scholar]
- West EE, Jin HT, Rasheed AU, Penaloza-Macmaster P, Ha SJ, Tan WG, Youngblood B, Freeman GJ, Smith KA, Ahmed R. PD-L1 blockade synergizes with IL-2 therapy in reinvigorating exhausted T cells. J Clin Invest. 2013;123:2604–2615. doi: 10.1172/JCI67008. [DOI] [PMC free article] [PubMed] [Google Scholar]
- Wolf MJ, Hoos A, Bauer J, Boettcher S, Knust M, Weber A, Simonavicius N, Schneider C, Lang M, Stuürzl M, et al. Endothelial CCR2 signaling induced by colon carcinoma cells enables extravasation via the JAK2-Stat5 and p38MAPK pathway. Cancer Cell. 2012;22:91–105. doi: 10.1016/j.ccr.2012.05.023. [DOI] [PubMed] [Google Scholar]
- Youn JI, Nagaraj S, Collazo M, Gabrilovich DI. Subsets of myeloid-derived suppressor cells in tumor-bearing mice. J Immunol. 2008;181:5791–5802. doi: 10.4049/jimmunol.181.8.5791. [DOI] [PMC free article] [PubMed] [Google Scholar]
- Zhang J, Lu Y, Pienta KJ. Multiple roles of chemokine (C-C motif) ligand 2 in promoting prostate cancer growth. J Natl Cancer Inst. 2010;102:522–528. doi: 10.1093/jnci/djq044. [DOI] [PMC free article] [PubMed] [Google Scholar]
- Zlotnik A, Yoshie O. The chemokine superfamily revisited. Immunity. 2012;36:705–716. doi: 10.1016/j.immuni.2012.05.008. [DOI] [PMC free article] [PubMed] [Google Scholar]
Associated Data
This section collects any data citations, data availability statements, or supplementary materials included in this article.
Supplementary Materials
Figure S1, related to Figure 1. Increased CCL2 contributes to progression from dysplasia to ACA in human and mouse colitis-associated colorectal cancer
(A) Representative CCL2 staining images of human tissue sections, scale bar 200 micrometers. (B) Representative H&E staining of the colon from T-bet-/- Rag2-/- and Ccl2-/- T-bet-/- Rag2-/- mice, scale bar 200 micrometers. (C) Histologic colitis scores for Ccl2-/- T-bet-/- Rag2-/- and T-bet-/- Rag2-/- mice across the neoplastic continuum. Symbols represent data from individual mice.
Figure S2, related to Figure 2. Analysis of colonic myeloid cell populations from Ccl2-/- T-bet-/- Rag2-/- and T-bet-/- Rag2-/- mice
(A) Gr-1 and CCR2 expression levels on populations I-III as gated in Figure 2A. (B) Colonic myeloid cell populations from Ccl2-/- T-bet-/- Rag2-/- and T-bet-/- Rag2-/- mice with high-grade dysplasia. Left panel: the numbers of Colonic CD11b+ myeloid cells, MDSCs (CD11b+Gr-1+) and macrophages (CD11b+Gr-1-). Right panel: the numbers of PMN-MDSCs (CD11b+Ly6G+Ly6Clow), Mo-MDSCs (CD11b+Ly6G-Ly6Chigh) and M2-like TAMs (CD11b+Gr-1-F4/80+MMR+). Symbols represent data from individual mice.
Figure S3, related to Figure 3. Analysis of intratumoral CCL2 levels and gating strategy for myeloid cell subset identification
(A) CCL2 protein determinations of shCCL2 Colon-26 cell lines and Colon26shGFP (shControl) quantitated by ELISA. (B) Proliferation of shControl and shCCL2 cells using the MTS assay. Data shown as MFI ± SEM. (C) Intratumoral CCL2 protein determinations from shControl and shCCL2 tumor-bearing mice by ELISA, mean ± SEM. Data represent three independent experiments with 3-4 mice per experiment. (D) The percentage and number of tumor-associated neutrophils. Symbols represent data from individual mice.
**P< 0.01, ***P< 0.001. Unpaired, two-tailed Student's t test.
Figure S4, related to Figure 4. Analysis of neutrophils and T cell suppressive activity of tumor-promoting macrophages
(A) Flow cytometric analysis of neutrophils and PMN-MDSCs, left panel: Ly6C and Ly6G staining, right panel: CCR2 staining. ***P< 0.001. Unpaired, two-tailed Student's t test. (B) Intratumoral TAMs and M2-like TAMs were sorted from shControl tumor-bearing mice. CellTrace™-labeled splenic CD4+T cells were coincubated with sorted TAMs or M2-like TAMs. Representative flow cytometric analysis of CD4+ T cell proliferation in the presence of sorted tumor-promoting macrophages is shown. (C) Intratumoral tumor-promoting macrophages (TAMs and M2-like TAMs) were sorted from shControl or shCCL2 tumor-bearing mice. CellTrace™-labeled splenic CD4+ or CD8+ T cells were coincubated with both tumor-promoting macrophage. Bar graph shows mean ± SEM of two independent experiments.
Figure S5, related to Figure 5. Functional gene or protein expression in MDSCs or tumor-promoting macrophages
(A-B) Expression levels of p47phox (RT-qPCR) (A) and Arginase1 (flow cytometry) (B) in intratumoral PMN-MDSCs and Mo-MDSCs from shControl or shCCL2 tumors. Mean relative expression ± SEM from three independent experiments. (C) Expression of Arginase 1 and iNOS levels (MFI) in sorted intratumoral TAMs and M2-like TAMs from shControl or shCCL2 tumor-bearing mice measured by flow cytometry. Data reflect two independent experiments.
Figure S6, related to Figure 6. Flow analysis of phospho-STAT3 levels
Phospho-STAT3 (p-STAT3) levels in PMN-MDSCs from shControl or shCCL2 tumors measured by flow cytometry. A representative flow cytometry image is shown.