

Abstract
Amacrine cells (ACs) are the most diverse class of neurons in the retina. The variety of signals provided by ACs allows the retina to encode a wide range of visual features. Of the 30–50 AC types in mammalian species, few have been studied in detail. Here, we combine genetic and viral strategies to identify and to characterize morphologically three vasoactive intestinal polypeptide-expressing GABAergic AC types (VIP1-, VIP2-, and VIP3-ACs) in mice. Somata of VIP1- and VIP2-ACs reside in the inner nuclear layer and somata of VIP3-ACs in the ganglion cell layer, and they show asymmetric distributions along the dorsoventral axis of the retina. Neurite arbors of VIP-ACs differ in size (VIP1-ACs ≈ VIP3-ACs > VIP2-ACs) and stratify in distinct sublaminae of the inner plexiform layer. To analyze light responses and underlying synaptic inputs, we target VIP-ACs under 2-photon guidance for patch-clamp recordings. VIP1-ACs depolarize strongly to light increments (ON) over a wide range of stimulus sizes but show size-selective responses to light decrements (OFF), depolarizing to small and hyperpolarizing to large stimuli. The switch in polarity of OFF responses is caused by pre- and postsynaptic surround inhibition. VIP2- and VIP3-ACs both show small depolarizations to ON stimuli and large hyperpolarizations to OFF stimuli but differ in their spatial response profiles. Depolarizations are caused by ON excitation outweighing ON inhibition, whereas hyperpolarizations result from pre- and postsynaptic OFF-ON crossover inhibition. VIP1-, VIP2-, and VIP3-ACs thus differ in response polarity and spatial tuning and contribute to the diversity of inhibitory and neuromodulatory signals in the retina.
Keywords: amacrine cell, receptive field, retina, VIP
in many parts of the nervous system, the diversity of local circuit neurons, or interneurons, exceeds that of projection neurons (Markram et al. 2004; Somogyi and Klausberger 2005; Taniguchi et al. 2011). The diversity of interneurons may be greatest in the retina, where 30–50 types of amacrine cells (ACs) mediate interactions among bipolar cells, amacrine cells, and ganglion cells, the projection neurons that transmit visual information to the brain (Helmstaedter et al. 2013; MacNeil and Masland 1998; Masland 2012).
Thirteen bipolar cell types carry different components of photoreceptor signals from the outer to the inner retina (i.e., parallel pathways), where their axons target specific sublaminae of the inner plexiform layer (IPL; Euler et al. 2014). Some AC types extend neurites in multiple sublaminae of the IPL and likely mediate interactions between pathways (Menger et al. 1998; Werblin 2010), whereas others target a single sublamina and likely mediate interactions within a pathway (Briggman et al. 2011; Lin and Masland 2006). In addition, AC types differ greatly in the size of lateral territories their neurites cover and, as a result, the areas of visual space from which they receive input (Masland 2012). Gene expression profiles match the morphological diversity of ACs (Cherry et al. 2009; Kay et al. 2011; Siegert et al. 2012) and support a range of AC output signals. In addition to GABA or glycine, many AC types release neuromodulators including bioactive peptides (Bagnoli et al. 2003; Gustincich et al. 1997; Vaney 2004). Few AC types have been functionally characterized, due in part to the limited accessibility of their somata in the middle of the retina and a paucity of tools for cell-type-specific targeting. The complement of inhibitory and neuromodulatory signals that shape visual processing in the retina, therefore, remains mostly unexplored.
Here, we combine genetic and viral strategies to identify and characterize three AC types expressing vasoactive intestinal polypeptide (VIP-ACs) in the mouse retina. VIP-ACs have been identified in several species, including humans (Tornqvist and Ehinger 1988), monkeys (Lammerding-Koppel et al. 1991), rabbits (Casini and Brecha 1991, 1992; Sagar 1987), guinea pigs (Lee et al. 2002), and rats (Terubayashi et al. 1983). Single-cell anatomy has only been examined in a few studies and appears to differ between species as does the number of VIP-AC types (Lammerding-Koppel et al. 1991; Lee et al. 2002). Functional responses of VIP-ACs have not yet been reported. Here, we analyze the morphology of VIP-ACs, adding two types (VIP2- and VIP3-ACs) to the recently described VIP1-ACs (Zhu et al. 2014) in mice. We then target all three VIP-AC types for patch-clamp recordings in retinal flat mount preparation and find that, in accordance with their morphological diversity, they receive distinct combinations of excitatory and inhibitory input from ON and OFF pathways over different areas of visual space. As a result, VIP-AC types differ in response polarity and spatial response profiles contributing to the variety of signals in the inner retina.
MATERIALS AND METHODS
Mice.
All experiments were performed in young adult (postnatal days 25-35) VIP-ires-Cre (Taniguchi et al. 2011) mice crossed to a fluorescent reporter strain (Ai9, tdTomato; Madisen et al. 2010) or injected with adeno-associated virus (AAV) vectors. Procedures were approved by the Animal Studies Committee of Washington University School of Medicine and performed in compliance with the National Institutes of Health Guide for the Care and Use of Laboratory Animals.
AAV.
Two Brainbow AAV vectors (AAV9-hEF1a-lox-TagBFP-lox-eYFP-lox-WPRE-hGH-InvBYF and AAV9-hEF1a-lox-mCherry-lox-mTFP1-lox-WPRE-hGH-InvCheTF; Cai et al. 2013) were injected (1:1, 250–500 nl) into the vitreous of newborn VIP-ires-Cre mice as described before (Soto et al. 2013), and retinas were examined 3–4 wk after the injection.
Tissue preparation.
Mice were euthanized, their eyes removed, and retinas isolated as described previously (Akrouh and Kerschensteiner 2013). For patch-clamp recordings, mice were dark-adapted >2 h, and all subsequent procedures were performed under infrared illumination (>900 nm). For imaging, retinal flat mounts were fixed for 30 min with 4% paraformaldehyde in mouse artificial cerebrospinal fluid containing (in mM): 119 NaCl, 2.5 KCl, 1 NaH2PO4, 2.5 CaCl2, 1.3 MgCl2, 20 HEPES, and 11 glucose (pH adjusted to 7.37 using NaOH).
Immunohistochemistry.
Fixed retinal flat mounts and sections were stained with primary antibodies against choline acetyltransferase (goat anti-ChAT; 1:1,000; Millipore) and VIP (rabbit anti-VIP; 1:1,000; Immunostar) visualized with secondary antibodies coupled to Alexa 488 or Alexa 633 (1:1,000; Millipore).
Imaging and analysis.
Fixed retinas were imaged on an FV1000 laser-scanning confocal microscope (Olympus) using 20 × 0.85- and 60 × 1.35-numerical aperture (NA) oil-immersion objectives. Images were acquired at a voxel size of 0.206–0.5 μm (x/y–z). Borders of the IPL with the inner nuclear (INL) and ganglion cell layers (GCL) were identified by collecting reflected laser light, and immunostaining for ChAT was used as a reference marker of stratification in the IPL. Brainbow-AAV-labeled neurons in VIP-ires-Cre mice were divided into three putative types (VIP1-, VIP2-, and VIP3-ACs) based on their morphology as follows. First, bistratified neurons (VIP1-ACs) were separated from monostratified neurons. Second, monostratified neurons were separated into those with somata in the INL (VIP2-ACs) and those with somata in the GCL (VIP3-ACs). VIP2- and VIP3-ACs identified in this way showed nonoverlapping distributions of arbor territories and different stratification depths (Fig. 2). Consistent physiological responses within these groups support the morphological identification of three VIP-AC types. Neurite territories for VIP-ACs with somata at mideccentricity were measured as the areas of the smallest convex polygons to encompass the respective arbors in maximum intensity projections. Density recovery profiles (DRPs) of somata in the INL and GCL were calculated following the definition of Rodieck (1991) using previously described algorithms to automate the identification of soma positions (Soto et al. 2012).
Fig. 2.
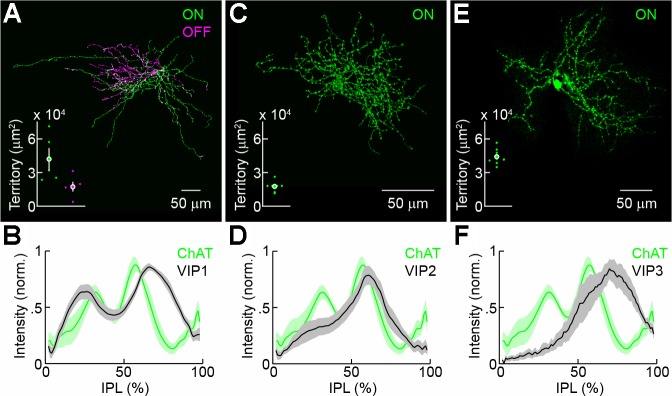
Morphology of VIP1-, VIP2-, and VIP3-ACs. A, C, and E: maximum intensity projections of confocal image stacks of representative VIP1- (A), VIP2- (C), and VIP3-ACs (E) labeled by Brainbow adeno-associated virus injection in VIP-ires-Cre mice (A and C) and dye infusion during patch-clamp recording (E). Neurites in the ON (OFF) sublamina are shown in green (magenta). Insets show territories covered by the respective arbors (VIP1-AC: n = 5, VIP2-AC: n = 7, VIP3-AC: n = 9). Each dot represents data from 1 cell, whereas filled circles (error bars) indicate the means (± SE) of the respective population. B, D, and F: intensity distributions of labeled VIP1- (B), VIP2- (D), and VIP3-ACs (F) across the depth of the inner plexiform layer (IPL; 0% = INL; 100% = GCL) are shown alongside the distribution of choline acetyltransferase (ChAT) staining. Lines (shaded area) indicate means (± SE) of the respective populations.
Electrophysiology.
Whole cell patch-clamp recordings were obtained in the dorsal halves (Wang et al. 2011; Wei et al. 2010) of flat-mounted retinas continuously superfused (6–8 ml/min) with warm (33–35°C) Ames' Medium (Sigma) equilibrated with 95% O2-5% CO2. Current-clamp recordings were performed with an intracellular solution containing (in mM): 125 K-gluconate, 10 NaCl, 1 MgCl2, 10 EGTA, 5 HEPES, 5 ATP-Na, and 0.1 GTP-Na (pH adjusted to 7.2 with KOH). The intracellular solution used in voltage-clamp recordings contained (in mM): 120 Cs-gluconate, 1 CaCl2, 1 MgCl2, 10 Na-HEPES, 11 EGTA, 10 TEA-Cl, and 2 Qx314 (pH adjusted to 7.2 with CsOH). Patch pipettes had resistances of 4–7 MΩ (borosilicate glass). All reported voltages were corrected for liquid junction potentials (voltage-clamp: −14 mV, current-clamp: −12.6 mV). Signals were amplified with a MultiClamp 700B amplifier (Molecular Devices), filtered at 3 kHz (8-pole Bessel low-pass), and sampled at 10 kHz (Digidata 1440A; Molecular Devices). Excitatory and inhibitory postsynaptic currents were isolated by clamping the voltage of the recorded cell at the reversal potential for Cl− (−60 mV) and cations (0 mV), respectively. In VIP1-ACs, gap junctions likely contribute to currents measured in voltage-clamp (Park et al. 2015). Only cells in which current amplitudes to full-field contrast steps (50%) at the beginning and end of the recording varied by <10% were used for analysis. In current-clamp recordings, no bias current was injected. The resting membrane potential of the three VIP-AC types under these conditions was: VIP1-ACs, −50.5 ± 2.2 mV, n = 10; VIP2-ACs, −49.2 ± 3 mV, n = 9; and VIP3-ACs, −41.7 ± 3 mV, n = 5.
Fluorescent somata in the INL and GCL of VIP-ires-Cre Ai9 mice were targeted under two-photon guidance (excitation wavelength: 900 nm). Correct targeting was confirmed by monitoring diffusion of a fluorescent dye (Alexa 488, 0.1 mM) from the recording electrode into the soma during break in. VIP1-, VIP2-, and VIP3-ACs were distinguished by the position of their somata (VIP1- and VIP2-ACs in INL and VIP3-ACs in GCL) and the distinct arborization patterns and sizes of their neurites imaged at the end of each recording.
Visual stimuli and analysis.
Stimuli were written in MATLAB (The MathWorks) using Cogent Graphics extensions (John Romaya, University College London) and were presented on an organic light-emitting display (refresh rate: 60 Hz; eMagin) focused onto photoreceptors. The mean intensity of all stimuli was 2,500 rhodopsin isomerization/rod/s (2,500 R*). To probe spatial response profiles, short luminance steps (Weber contrast ± 100%, 500 ms) from the mean were presented every 2.5 s in circles of varying size centered on the soma of the recorded cell. Stimuli were repeated four times in different pseudorandom sequences. Electrophysiology data were analyzed using scripts written in MATLAB. Responses (voltage and conductance) were measured as baseline-subtracted averages during 100-ms time windows.
Statistics.
Population data are reported as means ± SE throughout the text. Paired and unpaired t-tests were used to assess statistical significance of observed differences.
RESULTS
Throughout this study, we used VIP-ires-Cre mice to target VIP-ACs (Taniguchi et al. 2011). Crossed to a fluorescent reporter strain (Ai9, tdTomato; Madisen et al. 2010), VIP-ires-Cre mice label cells in INL as well as in the GCL. INL and GCL cells are distributed along opposing dorsoventral gradients with INL cells ∼20% more abundant in the ventral retina (Fig. 1, A and B) and GCL cells largely restricted to the dorsal retina (Fig. 1, E and F). Even in the dorsal retina, however, the density of INL cells exceeds that of GCL cells >10-fold. DRPs showed a clear exclusion zone between tdTomato-expressing cells in the GCL but not in the INL, indicating that >1 cell type is labeled in the INL (Fig. 1, C and G). We confirmed that nearly all tdTomato-positive cells in the INL and ∼80% of tdTomato-positive cells in the GCL stain for VIP (Fig. 1, D and H). In addition, in the INL, where the quality of VIP staining allowed for this analysis, nearly all VIP-positive neurons express tdTomato. In agreement with previous results (Lee et al. 2002; Zhu et al. 2014), we found that VIP-ACs in the INL and GCL costain for GABA (data not shown). VIP-ires-Cre mice thus specifically and, at least in the INL, completely label VIP-expressing GABAergic ACs.
Fig. 1.

Distribution of vasoactive intestinal polypeptide (VIP)-expressing amacrine cells (ACs) in the inner nuclear (INL) and ganglion cell layers (GCL). A and E: maximum intensity projections through the INL (A) and GCL (E) of a VIP-ires-Cre Ai9 (tdTomato shown in red) mouse stained for VIP (cyan). B and F: density of tdTomato-expressing cells in the dorsal and ventral INL (B; n = 4 retinae) and GCL (E; n = 6 retinae) of VIP-ires-Cre Ai9 retinae. C and G: density recovery profiles (DRPs) of tdTomato-expressing cells in the dorsal INL (C) and GCL (G). norm., Normalized. D and H: conditional probabilities of tdTomato-positive cells staining for VIP (left bars) in the INL (D; n = 16 retinae) and GCL (H; n = 8 retinae) and of VIP-positive cells expressing tdTomato (right bar) in the INL (D; n = 16 retinae). *P < 0.05 and ***P < 0.001.
To analyze the morphology of VIP-ACs, we injected Brainbow AAVs (Cai et al. 2013) into the vitreous of VIP-ires-Cre mice. Based on anatomic features, labeled cells were divided into three groups (VIP1-, VIP2-, and VIP3-ACs). Cell bodies of VIP1-ACs reside in the INL, and their large, sparsely branched neurite arbors stratify peripheral to ON and OFF ChAT bands in the IPL (Fig. 2, A and B; ON territory: 41,890 ± 9,507 μm2, OFF territory: 17,424 ± 4,398 μm2, n = 5). These features match those of the VIP-ACs previously identified in mice (Zhu et al. 2014). Like VIP1-ACs, VIP2-ACs are located in the INL, but their smaller and more densely branched neurites stratify in a single arbor overlapping with the ON ChAT band (Fig. 2, C and D; territory: 17,507 ± 9,507 μm2, n = 7; P < 0.02 for comparison with ON territory of VIP1-ACs). VIP3-ACs are displaced in the GCL, and their large neurite arbors, intermediate in branching density to VIP1- and VIP2-ACs, stratify between the ON ChAT band and the boundary between the IPL and GCL (Fig. 2, E and F; territory: 44,195 ± 2,195 μm2, n = 9; P < 10−6 for comparison with territory of VIP2-ACs). Differences in stratification depths and arbor sizes argue against VIP2- and VIP3-AC being mirror populations of the same cell type. VIP-ACs thus constitute a morphologically diverse group of three putative cell types positioned to participate in different retinal circuits.
To assess functional differences among putative VIP-AC types, we targeted fluorescent somata in the INL and GCL of flat-mounted VIP-ires-Cre Ai9 retinas under two-photon guidance for whole cell patch-clamp recordings. Recorded cells were assigned to the three putative types based on their soma position and characteristic morphology revealed by inclusion of a fluorescent dye (Alexa 488) in the intracellular solution. Overall, cells within a morphological group showed matching functional properties, whereas light responses and synaptic inputs differed between morphological groups, arguing that VIP1-, VIP2-, and VIP3-ACs indeed represent distinct cell types. Probing spatial profiles of ON and OFF responses, we found that VIP1-ACs depolarize to light increments and decrements when stimuli are restricted to their receptive field center (diameter: < 200 μm; Fig. 3, A–C). As stimulus size increases, however, OFF responses are suppressed and eventually switch polarity, whereas ON responses decrease only slightly. Asymmetric surround inhibition (OFF > ON) was evident in the excitatory input to VIP1-ACs isolated in voltage-clamp recordings (Fig. 3, D–F). In addition, direct inhibition of VIP1-ACs elicited by OFF stimuli exceeds that elicited by ON stimuli (Fig. 3, G–I). VIP1-ACs responses thus are dominated by ON depolarizations, which show mild surround suppression, whereas OFF responses are size-selective, depolarizing to small and hyperpolarizing to large stimuli as a result of pre- and postsynaptic surround inhibition.
Fig. 3.

Light responses and synaptic inputs of VIP1-ACs. A, D, and G: representative voltage (A), excitatory postsynaptic current (EPSC; D), and inhibitory postsynaptic current (IPSC; G) responses to light (100% contrast, ON, left column) and dark (−100% contrast, OFF, right column) circles of increasing size (diameter noted in A) presented for 500 ms from a gray background. Traces begin at stimulus onset. Vm, membrane potential; Exc, excitatory; Inh, inhibitory. B, E, and H: summary data of ON (○) and OFF (●) sensitivity profiles of VIP1-ACs for voltage (B; n = 10), excitatory (E; n = 15), and inhibitory (H; n = 11) responses. Responses of each cell were normalized to their maximum. Difference-of-Gaussian fits are shown as solid lines (Enroth-Cugell and Robson 1966). C, F, and I: amplitudes of ON (open bars) and OFF (filled bars) voltage (C), excitatory (F), and inhibitory (I) responses to circles with a diameter of 150 and 600 μm. Bars (error bars) indicate means (± SE) of respective populations. *P < 0.05, **P < 0.01, and ***P < 0.001.
By contrast, VIP2-ACs exhibit small ON depolarizations and large OFF hyperpolarizations (Fig. 4, A–C). Matching the comparatively narrow lateral extent of their neurite arbors, response amplitudes peak for small stimuli (diameter: ∼150 μm) with moderate surround suppression for larger stimuli. Voltage-clamp recordings revealed that ON depolarizations result from ON excitation outweighing ON inhibition, whereas OFF hyperpolarizations are evoked by coincident increases in inhibition and suppression of tonic excitation at light OFF (Fig. 4, D–I). Both ON and OFF inhibition show strong surround suppression. Stratifying in the ON part of the IPL (S3/4), the light responses of VIP2-ACs thus are dominated by OFF hyperpolarizations mediated by pre- and postsynaptic OFF-ON crossover inhibition.
Fig. 4.

Light responses and synaptic inputs of VIP2-ACs. A, D, and G: representative voltage (A), EPSC (D), and IPSC (G) traces recorded during presentation of light (100% contrast, ON, left column) and dark (−100% contrast, OFF, right column) circles of increasing size (diameter noted in A) presented for 500 ms from a gray background. Traces begin at stimulus onset. B, E, and H: summary data of ON (○) and OFF (●) sensitivity profiles of VIP2-ACs for voltage (B; n = 9), excitatory (E; n = 8), and inhibitory (H; n = 7) responses. Responses of each cell were normalized to their maximum. Difference-of-Gaussian fits are shown as solid lines. C, F, and I: amplitudes of ON (open bars) and OFF (filled bars) voltage (C), excitatory (F), and inhibitory (I) responses to circles with a diameter of 150 and 600 μm. Bars (error bars) indicate means (± SE) of respective populations. *P < 0.05, ** P < 0.01, and *** P < 0.001.
VIP3-ACs similarly respond with large hyperpolarizations to light decrements and small depolarizations to light increments (Fig. 5, A–C). Fitting their wide-field morphology, responses of VIP3-ACs peak at larger stimuli compared with medium-field VIP2-ACs (Masland 2012). ON depolarizations are restricted to small stimuli because excitatory inputs at light ON show strong surround suppression (Fig. 5, D–F), whereas inhibition of VIP3-ACs does not (Fig. 5, H and I). OFF hyperpolarizations are accounted for by simultaneous decreases in excitation and increases in inhibition. Thus, similar to VIP2-ACs, light responses of VIP3-ACs are dominated by pre- and postsynaptic OFF-ON crossover inhibition. However, the responses of both cell types differ in their spatial tuning.
Fig. 5.

Light responses and synaptic inputs of VIP3-ACs. A, D, and G: representative voltage (A), EPSC (D), and IPSC (G) responses to light (100% contrast, ON, left column) and dark (−100% contrast, OFF, right column) circles of increasing size (diameter noted in A) presented for 500 ms from a gray background. Traces begin at stimulus onset. B, E, and H: summary data of ON (○) and OFF (●) sensitivity profiles of VIP3-ACs for voltage (B; n = 5), excitatory (E; n = 8), and inhibitory (H; n = 8) responses. Responses of each cell were normalized to their maximum. Difference-of-Gaussian fits are shown as solid lines. C, F, and I: amplitudes of ON (open bars) and OFF (filled bars) voltage (C), excitatory (F), and inhibitory (I) responses to circles with a diameter of 150 and 600 μm. Bars (error bars) indicate means (± SE) of respective populations. *P < 0.05 and **P < 0.01.
DISCUSSION
Using a combination of knock-in mice, viral gene delivery, and targeted patch-clamp recordings, we identify and characterize three VIP-expressing GABAergic AC types (VIP-ACs) in mice. Concurrently with our findings, another study identified the same AC types and recorded similar light responses from them (Park et al. 2015). Morphologically, VIP1-ACs closely resemble type 40 ACs of a recent anatomic survey (Helmstaedter et al. 2013). Multiple AC types with similar morphology to VIP2- and VIP3-ACs were identified in the same survey, precluding conclusive matching. The lopsided distributions of VIP-ACs along the dorsoventral axis of the retina, particularly the scarcity of VIP3-ACs in the ventral retina, adds to a growing list of cell types with asymmetric distributions that suggests specializations in information processing in different parts of the visual field in mice (Bleckert et al. 2014; Haverkamp et al. 2005; Hughes et al. 2013; Zhang et al. 2012). The behavioral significance of this remains to be tested.
Although the number of cell types and their morphology appears to differ, VIP-ACs are a conserved feature of mammalian (Lammerding-Koppel et al. 1991; Lee et al. 2002; Sagar 1987; Tornqvist and Ehinger 1988; Zhu et al. 2014) and nonmammalian retinae (Bruun et al. 1985; Tornqvist et al. 1982). In the following, we discuss our insights into VIP1-, VIP2-, and VIP3-ACs in the context of their two likely outputs (GABA and VIP), beginning with neuromodulation.
Despite recent progress, the parameters of neuropeptide transmission are less understood than those of conventional synaptic transmission (van den Pol 2012). Neuropeptides are released in an activity-dependent manner by fusion of dense core vesicles, which can occur at synapses and/or nonsynaptic sites (Dreifuss 1975; Gainer et al. 1986; Tallent 2008). The distance over which neuropeptides convey signals is being debated but in many cases spans at least several micrometers (Fuxe et al. 2007; Jan and Jan 1982; van den Pol 2012). Together, neurites of VIP1-, VIP2-, and VIP3-ACs cover much of the depth of the IPL, suggesting that VIP may influence many if not all circuits in the inner retina. VIP signals through G-protein-coupled receptors, primarily VPAC2R, which appears to be expressed widely among retinal neurons (D'Agata and Cavallaro 1998; Harmar et al. 2004; Olianas et al. 1997), and VIP has been shown to enhance GABAergic transmission onto bipolar and ganglion cells postsynaptically (Jensen 1993; Veruki and Yeh 1992, 1994). Visual stimulation dominantly depolarizes VIP1- but hyperpolarizes VIP2- and VIP3-ACs. In the context of volume transmission of VIP, it is tempting to speculate that opposing response polarities may serve in part to stabilize the inhibitory tone of retinal circuits.
VIP1-ACs are bistratified and receive excitatory input from ON and OFF bipolar cells. Whereas OFF inputs are size-selective, ON inputs show broad spatial tuning. VIP1-ACs may thus mediate stimulus-size-dependent cross-pathway inhibition (Chen and Li 2012; Munch et al. 2009). Alternatively, neurites in ON and OFF sublaminae could function independent of each other (Euler et al. 2002; Grimes et al. 2010). Future experiments recording activity in a neurite-specific manner are needed to distinguish between these possibilities.
Although they differ in their spatial tuning, light responses of VIP2- and VIP3-ACs are both dominated by OFF-ON crossover inhibition (Figs. 4 and 5). The resulting hyperpolarizations may suppress tonic GABA release at light OFF and provide a disinhibitory signal to circuits in different sublaminae of the IPL, similar to the conserved function of VIP-positive neurons in cortical circuits (Fu et al. 2014; Lee et al. 2013; Pfeffer et al. 2013; Pi et al. 2013). The three morphologically and functionally distinct VIP-AC types identified and characterized here thus likely contribute to the diversity of neuromodulatory and inhibitory signals that shape visual processing in the retina.
GRANTS
This work was supported by the Research to Prevent Blindness Foundation (Career Development Award to D. Kerschensteiner and an unrestricted grant to the Dept. of Ophthalmology and Visual Sciences at Washington University), the National Eye Institute (R01-EY-021855 and R01-EY-023341 to D. Kerschensteiner and P30-EY-0268 to the Dept. of Ophthalmology and Visual Sciences at Washington University), and the National Science Foundation (DGE-1143954 to A. Akrouh).
DISCLOSURES
No conflicts of interest, financial or otherwise, are declared by the author(s).
AUTHOR CONTRIBUTIONS
A.A. and D.K. conception and design of research; A.A. performed experiments; A.A. and D.K. analyzed data; A.A. and D.K. interpreted results of experiments; A.A. and D.K. prepared figures; D.K. drafted manuscript; A.A. and D.K. edited and revised manuscript; A.A. and D.K. approved final version of manuscript.
ACKNOWLEDGMENTS
We thank members of the Kerschensteiner laboratory for helpful discussions and comments on the manuscript.
REFERENCES
- Akrouh A, Kerschensteiner D. Intersecting circuits generate precisely patterned retinal waves. Neuron 79: 322–334, 2013. [DOI] [PMC free article] [PubMed] [Google Scholar]
- Bagnoli P, Dal Monte M, Casini G. Expression of neuropeptides and their receptors in the developing retina of mammals. Histol Histopathol 18: 1219–1242, 2003. [DOI] [PubMed] [Google Scholar]
- Bleckert A, Schwartz GW, Turner MH, Rieke F, Wong RO. Visual space is represented by nonmatching topographies of distinct mouse retinal ganglion cell types. Curr Biol 24: 310–315, 2014. [DOI] [PMC free article] [PubMed] [Google Scholar]
- Briggman KL, Helmstaedter M, Denk W. Wiring specificity in the direction-selectivity circuit of the retina. Nature 471: 183–188, 2011. [DOI] [PubMed] [Google Scholar]
- Bruun A, Ehinger B, Sytsma V, Tornqvist K. Retinal neuropeptides in the skates, Raja clavata, R. radiata, R. oscellata (Elasmobranchii). Cell Tissue Res 241: 17–24, 1985. [DOI] [PubMed] [Google Scholar]
- Cai D, Cohen KB, Luo T, Lichtman JW, Sanes JR. Improved tools for the Brainbow toolbox. Nat Methods 10: 540–547, 2013. [PubMed] [Google Scholar]
- Casini G, Brecha NC. Colocalization of vasoactive intestinal polypeptide and GABA immunoreactivities in a population of wide-field amacrine cells in the rabbit retina. Vis Neurosci 8: 373–378, 1992. [DOI] [PubMed] [Google Scholar]
- Casini G, Brecha NC. Vasoactive intestinal polypeptide-containing cells in the rabbit retina: immunohistochemical localization and quantitative analysis. J Comp Neurol 305: 313–327, 1991. [DOI] [PubMed] [Google Scholar]
- Chen S, Li W. A color-coding amacrine cell may provide a blue-off signal in a mammalian retina. Nat Neurosci 15: 954–956, 2012. [DOI] [PMC free article] [PubMed] [Google Scholar]
- Cherry TJ, Trimarchi JM, Stadler MB, Cepko CL. Development and diversification of retinal amacrine interneurons at single cell resolution. Proc Natl Acad Sci USA 106: 9495–9500, 2009. [DOI] [PMC free article] [PubMed] [Google Scholar]
- D'Agata V, Cavallaro S. Functional and molecular expression of PACAP/VIP receptors in the rat retina. Brain Res Mol Brain Res 54: 161–164, 1998. [DOI] [PubMed] [Google Scholar]
- Dreifuss JJ. A review on neurosecretory granules: their contents and mechanisms of release. Ann NY Acad Sci 248: 184–201, 1975. [DOI] [PubMed] [Google Scholar]
- Enroth-Cugell C, Robson JG. The contrast sensitivity of retinal ganglion cells of the cat. J Physiol 187: 517–552, 1966. [DOI] [PMC free article] [PubMed] [Google Scholar]
- Euler T, Detwiler PB, Denk W. Directionally selective calcium signals in dendrites of starburst amacrine cells. Nature 418: 845–852, 2002. [DOI] [PubMed] [Google Scholar]
- Euler T, Haverkamp S, Schubert T, Baden T. Retinal bipolar cells: elementary building blocks of vision. Nat Rev Neurosci 15: 507–519, 2014. [DOI] [PubMed] [Google Scholar]
- Fu Y, Tucciarone JM, Espinosa JS, Sheng N, Darcy DP, Nicoll RA, Huang ZJ, Stryker MP. A cortical circuit for gain control by behavioral state. Cell 156: 1139–1152, 2014. [DOI] [PMC free article] [PubMed] [Google Scholar]
- Fuxe K, Dahlstrom A, Hoistad M, Marcellino D, Jansson A, Rivera A, Diaz-Cabiale Z, Jacobsen K, Tinner-Staines B, Hagman B, Leo G, Staines W, Guidolin D, Kehr J, Genedani S, Belluardo N, Agnati LF. From the Golgi-Cajal mapping to the transmitter-based characterization of the neuronal networks leading to two modes of brain communication: wiring and volume transmission. Brain Res Rev 55: 17–54, 2007. [DOI] [PubMed] [Google Scholar]
- Gainer H, Wolfe SA Jr, Obaid AL, Salzberg BM. Action potentials and frequency-dependent secretion in the mouse neurohypophysis. Neuroendocrinology 43: 557–563, 1986. [DOI] [PubMed] [Google Scholar]
- Grimes WN, Zhang J, Graydon CW, Kachar B, Diamond JS. Retinal parallel processors: more than 100 independent microcircuits operate within a single interneuron. Neuron 65: 873–885, 2010. [DOI] [PMC free article] [PubMed] [Google Scholar]
- Gustincich S, Feigenspan A, Wu DK, Koopman LJ, Raviola E. Control of dopamine release in the retina: a transgenic approach to neural networks. Neuron 18: 723–736, 1997. [DOI] [PubMed] [Google Scholar]
- Harmar AJ, Sheward WJ, Morrison CF, Waser B, Gugger M, Reubi JC. Distribution of the VPAC2 receptor in peripheral tissues of the mouse. Endocrinology 145: 1203–1210, 2004. [DOI] [PubMed] [Google Scholar]
- Haverkamp S, Wassle H, Duebel J, Kuner T, Augustine GJ, Feng G, Euler T. The primordial, blue-cone color system of the mouse retina. J Neurosci 25: 5438–5445, 2005. [DOI] [PMC free article] [PubMed] [Google Scholar]
- Helmstaedter M, Briggman KL, Turaga SC, Jain V, Seung HS, Denk W. Connectomic reconstruction of the inner plexiform layer in the mouse retina. Nature 500: 168–174, 2013. [DOI] [PubMed] [Google Scholar]
- Hughes S, Watson TS, Foster RG, Peirson SN, Hankins MW. Nonuniform distribution and spectral tuning of photosensitive retinal ganglion cells of the mouse retina. Curr Biol 23: 1696–1701, 2013. [DOI] [PMC free article] [PubMed] [Google Scholar]
- Jan LY, Jan YN. Peptidergic transmission in sympathetic ganglia of the frog. J Physiol 327: 219–246, 1982. [DOI] [PMC free article] [PubMed] [Google Scholar]
- Jensen RJ. Effects of vasoactive intestinal peptide on ganglion cells in the rabbit retina. Vis Neurosci 10: 181–189, 1993. [DOI] [PubMed] [Google Scholar]
- Kay JN, Voinescu PE, Chu MW, Sanes JR. Neurod6 expression defines new retinal amacrine cell subtypes and regulates their fate. Nat Neurosci 14: 965–972, 2011. [DOI] [PMC free article] [PubMed] [Google Scholar]
- Lammerding-Koppel M, Thier P, Koehler W. Morphology and mosaics of VIP-like immunoreactive neurons in the retina of the rhesus monkey. J Comp Neurol 312: 251–263, 1991. [DOI] [PubMed] [Google Scholar]
- Lee EJ, Park SH, Kim IB, Kang WS, Oh SJ, Chun MH. Light- and electron-microscopic analysis of vasoactive intestinal polypeptide-immunoreactive amacrine cells in the guinea pig retina. J Comp Neurol 445: 325–335, 2002. [DOI] [PubMed] [Google Scholar]
- Lee S, Kruglikov I, Huang ZJ, Fishell G, Rudy B. A disinhibitory circuit mediates motor integration in the somatosensory cortex. Nat Neurosci 16: 1662–1670, 2013. [DOI] [PMC free article] [PubMed] [Google Scholar]
- Lin B, Masland RH. Populations of wide-field amacrine cells in the mouse retina. J Comp Neurol 499: 797–809, 2006. [DOI] [PubMed] [Google Scholar]
- MacNeil MA, Masland RH. Extreme diversity among amacrine cells: implications for function. Neuron 20: 971–982, 1998. [DOI] [PubMed] [Google Scholar]
- Madisen L, Zwingman TA, Sunkin SM, Oh SW, Zariwala HA, Gu H, Ng LL, Palmiter RD, Hawrylycz MJ, Jones AR, Lein ES, Zeng H. A robust and high-throughput Cre reporting and characterization system for the whole mouse brain. Nat Neurosci 13: 133–140, 2010. [DOI] [PMC free article] [PubMed] [Google Scholar]
- Markram H, Toledo-Rodriguez M, Wang Y, Gupta A, Silberberg G, Wu C. Interneurons of the neocortical inhibitory system. Nat Rev Neurosci 5: 793–807, 2004. [DOI] [PubMed] [Google Scholar]
- Masland RH. The tasks of amacrine cells. Vis Neurosci 29: 3–9, 2012. [DOI] [PMC free article] [PubMed] [Google Scholar]
- Menger N, Pow DV, Wassle H. Glycinergic amacrine cells of the rat retina. J Comp Neurol 401: 34–46, 1998. [DOI] [PubMed] [Google Scholar]
- Munch TA, da Silveira RA, Siegert S, Viney TJ, Awatramani GB, Roska B. Approach sensitivity in the retina processed by a multifunctional neural circuit. Nat Neurosci 12: 1308–1316, 2009. [DOI] [PubMed] [Google Scholar]
- Olianas MC, Ingianni A, Sogos V, Onali P. Expression of pituitary adenylate cyclase-activating polypeptide (PACAP) receptors and PACAP in human fetal retina. J Neurochem 69: 1213–1218, 1997. [DOI] [PubMed] [Google Scholar]
- Park SJ, Borghuis BG, Rahmani P, Zeng Q, Kim IJ, Demb JB. Function and circuitry of VIP+ interneurons in the mouse retina. J Neurosci 35: 10685–10700, 2015. [DOI] [PMC free article] [PubMed] [Google Scholar]
- Pfeffer CK, Xue M, He M, Huang ZJ, Scanziani M. Inhibition of inhibition in visual cortex: the logic of connections between molecularly distinct interneurons. Nat Neurosci 16: 1068–1076, 2013. [DOI] [PMC free article] [PubMed] [Google Scholar]
- Pi HJ, Hangya B, Kvitsiani D, Sanders JI, Huang ZJ, Kepecs A. Cortical interneurons that specialize in disinhibitory control. Nature 503: 521–524, 2013. [DOI] [PMC free article] [PubMed] [Google Scholar]
- Rodieck RW. The density recovery profile: a method for the analysis of points in the plane applicable to retinal studies. Vis Neurosci 6: 95–111, 1991. [DOI] [PubMed] [Google Scholar]
- Sagar SM. Vasoactive intestinal polypeptide (VIP) immunohistochemistry in the rabbit retina. Brain Res 426: 157–163, 1987. [DOI] [PubMed] [Google Scholar]
- Siegert S, Cabuy E, Scherf BG, Kohler H, Panda S, Le YZ, Fehling HJ, Gaidatzis D, Stadler MB, Roska B. Transcriptional code and disease map for adult retinal cell types. Nat Neurosci 15: 487–495, S1–S2, 2012. [DOI] [PubMed] [Google Scholar]
- Somogyi P, Klausberger T. Defined types of cortical interneurone structure space and spike timing in the hippocampus. J Physiol 562: 9–26, 2005. [DOI] [PMC free article] [PubMed] [Google Scholar]
- Soto F, Ma X, Cecil JL, Vo BQ, Culican SM, Kerschensteiner D. Spontaneous activity promotes synapse formation in a cell-type-dependent manner in the developing retina. J Neurosci 32: 5426–5439, 2012. [DOI] [PMC free article] [PubMed] [Google Scholar]
- Soto F, Watkins KL, Johnson RE, Schottler F, Kerschensteiner D. NGL-2 regulates pathway-specific neurite growth and lamination, synapse formation, and signal transmission in the retina. J Neurosci 33: 11949–11959, 2013. [DOI] [PMC free article] [PubMed] [Google Scholar]
- Tallent MK. Presynaptic inhibition of glutamate release by neuropeptides: use-dependent synaptic modification. Results Probl Cell Differ 44: 177–200, 2008. [DOI] [PubMed] [Google Scholar]
- Taniguchi H, He M, Wu P, Kim S, Paik R, Sugino K, Kvitsiani D, Fu Y, Lu J, Lin Y, Miyoshi G, Shima Y, Fishell G, Nelson SB, Huang ZJ. A resource of Cre driver lines for genetic targeting of GABAergic neurons in cerebral cortex. Neuron 71: 995–1013, 2011. [DOI] [PMC free article] [PubMed] [Google Scholar]
- Terubayashi H, Tsuto T, Fukui K, Obata HL, Okamura H, Fujisawa H, Itoi M, Yanaihara C, Yanaihara N, Ibata Y. VIP (vasoactive intestinal polypeptide)-like immunoreactive amacrine cells in the retina of the rat. Exp Eye Res 36: 743–749, 1983. [DOI] [PubMed] [Google Scholar]
- Tornqvist K, Ehinger B. Peptide immunoreactive neurons in the human retina. Invest Ophthalmol Vis Sci 29: 680–686, 1988. [PubMed] [Google Scholar]
- Tornqvist K, Uddman R, Sundler F, Ehinger B. Somatostatin and VIP neurons in the retina of different species. Histochemistry 76: 137–152, 1982. [DOI] [PubMed] [Google Scholar]
- van den Pol AN. Neuropeptide transmission in brain circuits. Neuron 76: 98–115, 2012. [DOI] [PMC free article] [PubMed] [Google Scholar]
- Vaney DI. Type 1 nitrergic (ND1) cells of the rabbit retina: comparison with other axon-bearing amacrine cells. J Comp Neurol 474: 149–171, 2004. [DOI] [PubMed] [Google Scholar]
- Veruki ML, Yeh HH. Vasoactive intestinal polypeptide modulates GABAA receptor function in bipolar cells and ganglion cells of the rat retina. J Neurophysiol 67: 791–797, 1992. [DOI] [PubMed] [Google Scholar]
- Veruki ML, Yeh HH. Vasoactive intestinal polypeptide modulates GABAA receptor function through activation of cyclic AMP. Vis Neurosci 11: 899–908, 1994. [DOI] [PubMed] [Google Scholar]
- Wang YV, Weick M, Demb JB. Spectral and temporal sensitivity of cone-mediated responses in mouse retinal ganglion cells. J Neurosci 31: 7670–7681, 2011. [DOI] [PMC free article] [PubMed] [Google Scholar]
- Wei W, Elstrott J, Feller MB. Two-photon targeted recording of GFP-expressing neurons for light responses and live-cell imaging in the mouse retina. Nat Protoc 5: 1347–1352, 2010. [DOI] [PMC free article] [PubMed] [Google Scholar]
- Werblin FS. Six different roles for crossover inhibition in the retina: correcting the nonlinearities of synaptic transmission. Vis Neurosci 27: 1–8, 2010. [DOI] [PMC free article] [PubMed] [Google Scholar]
- Zhang Y, Kim IJ, Sanes JR, Meister M. The most numerous ganglion cell type of the mouse retina is a selective feature detector. Proc Natl Acad Sci USA 109: E2391–E2398, 2012. [DOI] [PMC free article] [PubMed] [Google Scholar]
- Zhu Y, Xu J, Hauswirth WW, DeVries SH. Genetically targeted binary labeling of retinal neurons. J Neurosci 34: 7845–7861, 2014. [DOI] [PMC free article] [PubMed] [Google Scholar]