Abstract
The pulvinar is the largest extrageniculate thalamic visual nucleus in mammals. It establishes reciprocal connections with virtually all visual cortexes and likely plays a role in transthalamic cortico-cortical communication. In cats, the lateral posterior nucleus (LP) of the LP-pulvinar complex can be subdivided in two subregions, the lateral (LPl) and medial (LPm) parts, which receive a predominant input from the striate cortex and the superior colliculus, respectively. Here, we revisit the receptive field structure of LPl and LPm cells in anesthetized cats by determining their first-order spatiotemporal profiles through reverse correlation analysis following sparse noise stimulation. Our data reveal the existence of previously unidentified receptive field profiles in the LP nucleus both in space and time domains. While some cells responded to only one stimulus polarity, the majority of neurons had receptive fields comprised of bright and dark responsive subfields. For these neurons, dark subfields' size was larger than that of bright subfields. A variety of receptive field spatial organization types were identified, ranging from totally overlapped to segregated bright and dark subfields. In the time domain, a large spectrum of activity overlap was found, from cells with temporally coinciding subfield activity to neurons with distinct, time-dissociated subfield peak activity windows. We also found LP neurons with space-time inseparable receptive fields and neurons with multiple activity periods. Finally, a substantial degree of homology was found between LPl and LPm first-order receptive field spatiotemporal profiles, suggesting a high integration of cortical and subcortical inputs within the LP-pulvinar complex.
Keywords: cortico-thalamo-cortical pathways, electrophysiology, reverse correlation, thalamus, visual system
the pulvinar nucleus represents the main extrageniculate thalamic visual structure in higher-order mammals and is likely to be involved in various aspects of the visual function such as higher-order motion analysis and visual attention (Casanova 2004). In the cat, the lateral posterior (LP) nucleus-pulvinar complex can be subdivided in at least three different nuclei based on its afferent connectivity and its cyto- and chemoarchitecture: the lateral and medial part of the LP (LPl and LPm) and the pulvinar nucleus (Berson and Graybiel 1983; Graybiel and Berson 1980). In addition to inputs from the retina (Boire et al. 2004) and the superior colliculus (Caldwell and Mize 1981), these nuclei receive prominent inputs from virtually all visual cortical areas (Berson and Graybiel 1983; Scannell et al. 1999; Updyke 1977). Because these connections are reciprocal, cortico-thalamo-cortical pathways through the LP-pulvinar thalamic complex provide a complementary route for cortico-cortical information flow. The cortical input appears to dominate those coming from the retina and the superior colliculus since a majority of LP neurons exhibit “cortical-like” properties such as direction and orientation selectivity, binocularity (including the coding of retinal disparities), and complex motion sensitivity (Casanova et al. 1989; Casanova and Savard 1996; Chalupa and Abramson 1989; Dumbrava et al. 2001; Merabet et al. 1998). As such, the LP-pulvinar is considered a higher-order thalamic nucleus, in contrast to first-order nuclei such as the lateral geniculate nucleus (Sherman 2007; Sherman and Guillery 2002).
Despite the fact that several groups have described the response properties of neurons in the pulvinar of mammals (Bender 1982; Chalupa and Abramson 1989; Chalupa et al. 1983; Gattass et al. 1979; Mason 1981; Mathers and Rapisardi 1973; Nguyen et al. 2013; Petersen et al. 1985), very little is known on their receptive field (RF) spatiotemporal profiles. In this study, we describe the RF organization of neurons from the cat LP nuclei by quantitatively analyzing their spatial and temporal RF structure using sparse noise stimuli with reverse correlation analysis. This technique has been successfully used to capture the spatiotemporal organization of RF in the lateral geniculate (LGN) and perigeniculate nuclei (Cai et al. 1997; Sanchez et al. 2007), in area 17 (DeAngelis et al. 1993a; Jones and Palmer 1987), and in the lateral suprasylvian cortex (Piché et al. 2013) and provided a better understanding of response properties than traditional static RF profiles. Our aim was twofold: first, to uncover the fine structure of RF within the LP nuclei; second, to establish whether the differences in connectivity between its two main subdivisions, the LPl and LPm, are reflected in their RF spatiotemporal organization.
Our data reveal the presence of a previously underestimated large variety of RF profiles that may reflect the numerous cortical and subcortical inputs of LP cells. The fact that neurons in the LPm and LPl nuclei share similar RF spatiotemporal profiles suggests a high level of integration of the multiple afferent signals within the cat LP-pulvinar that offers an alternative (and likely enriched) route for cortico-cortical communication and processing.
METHODS
Animal preparation.
Experiments were carried out on 15 normal adult cats weighing ∼4 kg. All experimental procedures were performed in accordance with the guidelines set out by the Canadian Council for the Protection of Animals and were approved by the Ethics committee on animal research of the Université de Montréal. Animals were preanesthetized with a subcutaneous injection of atropine (0.1 mg/kg) and Atravet (1 mg/kg). General anesthesia was induced by inhalation of a mixture of 5% isoflurane and O2-N2O in a 50:50 ratio. Local anesthetic (2% lidocaine hydrochloride) was applied to incision and pressure points. Tracheotomy and cephalic vein cannulation were performed before transferring the animal to a stereotaxic apparatus. Following administration of gallamine triethiodide (10 mg·kg−1·h−1) in lactated Ringer solution, animals were artificially ventilated with isoflurane (2%) in a mixture of N2O-O2 (70:30). Expired level of CO2 was maintained between 28 and 32 mmHg by adjusting the tidal volume and respiratory rate. Rectal temperature was monitored and maintained at ∼38°C. The electrocardiogram and electroencephalogram were continuously monitored. Craniotomy and durotomy were performed to access the LGN and LP-pulvinar nuclei. The overlying cortex was covered with warm agar and melted wax to create a sealed chamber. Pupils were dilated, and nictitating membranes were retracted with 1% atropine and 2.5% phenylephrine hydrochloride, respectively. Eyes were protected with contact lenses of the appropriate refractive power. Because isoflurane has a strong depressive effect on the amplitude of visual responses (Villeneuve and Casanova 2003), it was replaced by halothane (0.5%) during recordings.
Recordings.
Varnished tungsten microelectrodes (3–4.5 MΩ; H-J Winston) were used to record extracellular activity of LP-pulvinar cells. Neuronal activity was amplified and band-pass filtered (5,000×, 300 Hz-3 kHz, Grass P511 amplifier; Grass Technologies), displayed on an oscilloscope, and played through an audio monitor. A “Hum Bug” device (Quest Scientific, North Vancouver, Canada) further filtered electrical interferences. Action potentials were first isolated with a WPI 121 windows discriminator (World Precision Instruments). Raw signals and TTL pulses were fed to an analog-digital interface (CED 1401 plus) and sampled at 25 kHz with the Spike2 acquisition software (version 5; CED, Cambridge, UK). Single units were isolated offline based on their waveform with the spike sorter tool in Spike2. Only single unit data were considered for the analysis described in this manuscript.
Visual stimulation.
For each cell, the RF was first manually mapped on a tangent screen placed 57 cm in front of the animal and subtending 98° × 74° of visual angle. Subsequently, sparse noise stimuli, centered on the manually estimated center of RFs, were delivered monocularly. The sparse noise stimulus was generated by a custom software developed in Python version 2.3.4 (www.python.org) running on a Pentium III 930-MHz computer with a NVIDIA GeForce2 GST graphic card and Windows operating system. The stimulus was projected with an InFocus LP725 projector (75 Hz, 800 × 600 pixel resolution) and consisted of a gray background (25 cd/m2), with bright (50 cd/m2) or dark (≈0 cd/m2) squares presented one at the time (for 32 or 64 ms), in a random and continuous sequence, without any delay. As discussed in De Angelis et al. (1993a), there is a tradeoff between the stimulus energy (size and duration) and the spatial and temporal resolution of the reverse correlation analysis. As such, squares of 10° in width were usually presented first; next, the stimulus size was progressively decreased down to the smallest stimulus size eliciting responses (usually between 2 and 5° of width). Depending on the stimulus size, squares were presented along 10 × 7, 15 × 11, or 20 × 15 position grids (columns × rows, nonoverlapping positions). Grid positions were tested 30 times for both bright and dark stimulus polarities (e.g., 20 × 15 positions × 2 polarities × 30 repetitions = stimulus sequence of 18,000 events).
Reverse correlation.
The reverse correlation technique used was adapted from Jones and Palmer (1987) and DeAngelis et al. (1993a) and is described in detail in Piché et al. (2013).
Bright and dark responsive subfields were analyzed separately to better highlight their features. Performing a subtraction of bright and dark responsive maps, as usually done with simple cells (DeAngelis et al. 1993a; Jones and Palmer 1987), would have caused the contribution of each subfield to be mutually canceled. A cross-correlation analysis between each spike occurrence and their preceding white noise stimulus sequence [2-dimensional (2D) stimulus positions and polarity during 500 ms of prespike time] was performed with a 1-ms resolution. This generated three-dimensional correlation histogram matrixes that contained the RF spatiotemporal profiles (2D maps at 500 prespike times). Spike probability values were calculated from the number of spikes associated to each matrix position (spatial position, polarity, and time) divided by the total number of spikes recorded during the stimulus block. Probability maps were filtered using a 2D adaptive pixelwise linear Wiener filter (Matlab Image Processing Toolbox; Mathworks, Natick, MA) using a 3 × 3 pixel area, and a subsequent spatial linear interpolation was carried out to increase the spatial resolution of the estimates of RF boundaries.
RF boundaries were delimited after applying a significance threshold on the probability maps obtained. The threshold was set at 1.96 times the SD of the probabilities obtained by chance. Chance level was estimated by taking the positive times from the cross-correlation (Borghuis et al. 2003), over a range equivalent to that for the reverse correlation.
Analysis of RF spatiotemporal properties.
Spatial boundaries of RFs were computed separately for each stimulus polarity and were taken from the prespike time associated with peak probability. Subfields were fitted with an ellipse through the regionprops Matlab function from which major and minor axis length were extracted. The major-to-minor axis length ratio was used to quantify the ovality of subfields. In the time domain, onset latency was determined when the probability exceeded the significance threshold for at least 5 ms of subsequent datapoints. Peak latency for each subfield was taken from the time point with maximal probability and offset latency when the probability fell below the significance threshold. The time window between latency offset and onset was considered the latency scatter.
Analysis of RF with polarity-opposed subfields.
Most cells responded to both stimulus polarities and were designated as neurons with polarity-opposed subfields. To describe the subfield size asymmetry, a subfield size index (SSI) was calculated from the total area of the bright minus dark responsive subfields divided by their sum (Piché et al. 2013). SSI values ranged from −1 to 1, with negative values indicative of a larger dark subfield size and positives reflecting larger bright subfield size. In addition, to describe and quantify the RF spatial organization of neurons with polarity-opposed subfields, a spatial overlap index (SOI) was calculated as follows: the bright and dark overlapping area was divided by the total area covered by the two subfields inclusively:
This index, calculated on a pixel-to-pixel basis, has the advantage to fully account subfield shape irregularities and ranges from zero (no overlap) to one (perfect spatial overlap).
The temporal overlap index (TOI; Piché et al. 2013) was calculated by subtracting the shortest offset latency between bright and dark subfields from the longer onset latency between them. Positive values indicate the exact time during which both subfields have significant spike probability values, whereas negative values indicate the time separating the spike probability peaks of both subfields. This index was further normalized to the entire time span where spike probability exceeds chance level in the RF, irrespective of the subfields (i.e., divided by the difference between longest offset and shortest onset latencies of subfields). As a result, negative TOI values indicate time-separated subfield spike probability peaks, and positive values indicate the time ratio during which the RF temporal profile is characterized by concomitant subfield spike probability peaks. The maximal value of one would indicate perfect synchrony between bright and dark subfields.
Drifting sine wave gratings.
A subset of neurons was also tested with drifting sine wave gratings. The gratings were projected in the same manner as described above; however, the stimulus was generated by a Macintosh G3 computer using VPixx 10 (Sentinel Medical Research, Ste-Julie, Quebec, Canada). Gratings were presented at 60% contrast at a mean luminance of 25 cd/m2. Randomized tests to determine the optimal direction (12 directions from 0 to 330°) and spatial (0.03–0.7 cycles/degree) and temporal (TF: 2–10 Hz) frequencies were performed for each cell. Direction selectivity was quantified using a direction index (DI), as previously described (Minville and Casanova 1998). The level of neuronal discharge modulation by the grating TF was expressed by the modulation index (MI), an index classically used to distinguish simple from complex cells (Skottun et al. 1991).
Histology.
Electrolytic lesions were performed at several locations along each successful penetration. At the end of each experiment, the animal was killed by intravenous administration of pentobarbital sodium (Euthanyl: 110 mg/kg) and then perfused transcardially with a phosphate buffer solution followed by a fixative (4% paraformaldehyde). Coronal serial sections (40 μm thick) were cut using a cryostat. Half of the sections was stained for acetylcholinesterase to identify LP-pulvinar subdivisions. The other half was Nissl stained to locate the lesions. Under microscopic inspection, each penetration was identified, and the location of neurons was determined.
Statistics.
Data values are reported as means ± SE. Statistical analyses were performed in MATLAB, using the Statistics toolbox. Normal distribution of data was tested using Kolmogorov-Smirnov tests. Normally distributed data were compared using Student's t-tests, whereas nonnormally distributed data were compared using Wilcoxon rank sum or signed rank tests for unpaired and paired comparisons, respectively. Classification cell counts were compared using Chi squared tests.
RESULTS
A total of 120 visual neurons was recorded in the LP nucleus. A number of cells did not respond to the sparse white noise stimulus (n = 29), and one unit was inactivated by this stimulus. As a result, 91 RF spatiotemporal profiles were obtained and will be described in the following sections. Binocularity was qualitatively evaluated. In agreement with a previous study (Casanova et al. 1989), 50 cells exhibited a preference for the contralateral eye, 32 were equally activated by the two eyes, and only 9 neurons preferred the ipsilateral eye. Eccentricity of RFs ranged from −6 to 27° in azimuth and from −18 to 32° in elevation. As mentioned previously, the sparse white noise stimuli comprised two stimuli with opposite polarities (bright and dark). When considered separately, bright and dark squares activated 66 and 85 cells, respectively. Sixty neurons responded to both stimulus polarities (and consequently exhibited 2 activated subfields in their RF), 6 only to bright, and 25 only to dark stimuli.
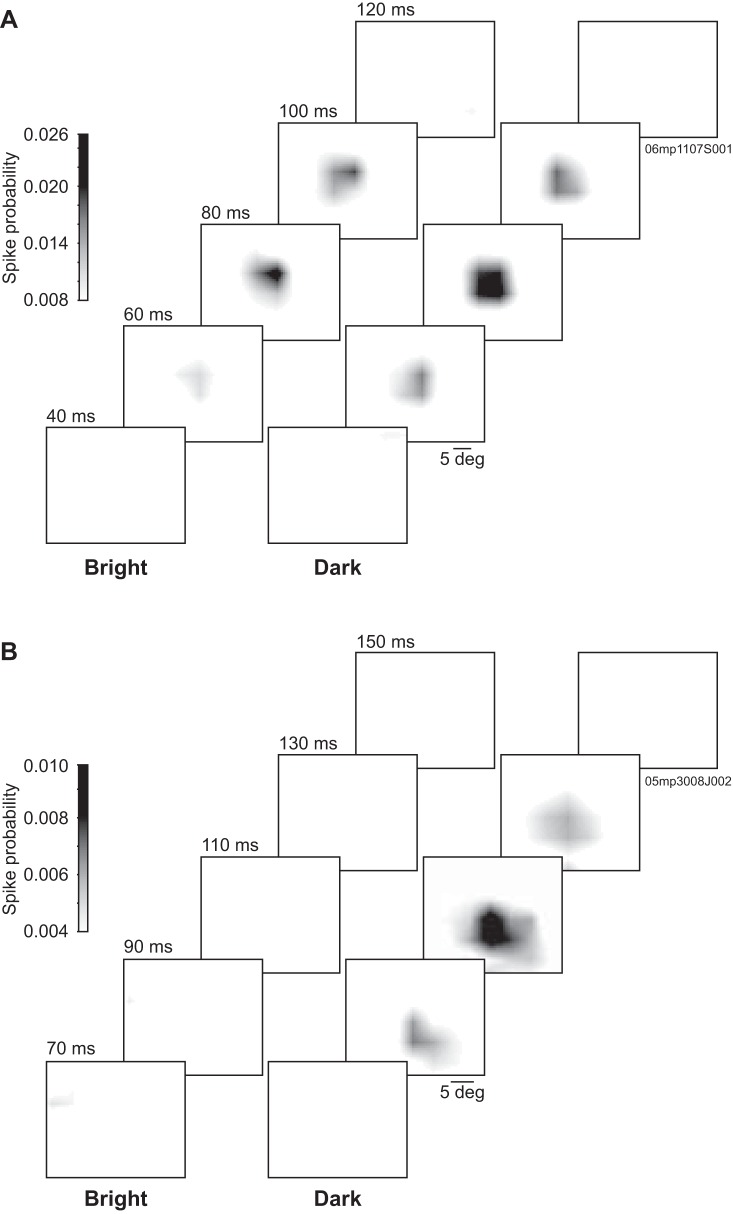
Figure 1 displays representative RF spatiotemporal profiles obtained through reverse correlation in the form of 2D probability maps computed at different prespike times. The LPl neuron presented in Fig. 1A responded to both stimulus polarities, and both bright and dark responsive subfields had similar temporal profiles, with a probability peak occurring around 80 ms. The LPm neuron shown in Fig. 1B responded only to dark stimuli and reached peak probability with a longer latency (110 ms). In the following sections, spatial and temporal parameters will be described in more detail.
Fig. 1.
Representative spatiotemporal receptive field (RF) profiles from lateral posterior nucleus (LP) neurons. Grayscale-coded probability spatial maps from LP neurons obtained at different prespike times shown separately for bright and dark stimuli. A: this lateral LP (LPl) neuron responded to both bright and dark stimuli with spatially overlapping RF subfields and with coinciding peak probability latencies of ∼80 ms. This neuron was probed with 6.5° squares distributed on a 15 × 11 stimulation position grid. B: this medial LP (LPm) neuron responded to dark stimuli only, with a peak probability latency of ∼110 ms. This neuron was probed with 5° squares distributed on a 20 × 15 stimulation position grid.
General observations.
In the space domain, the mean RF size (including the 2 subfields when present) was of 771 ± 72 deg2 (n = 90). When considering the bright and dark subfields separately, the dark subfields were on average larger than bright subfields. Indeed, the mean size for bright and dark subfields was of 314 ± 35 and 511 ± 38 deg2, respectively (P < 0.001, Wilcoxon rank sum test, n = 66 for bright and 85 for dark subfields). The distribution histogram of subfield sizes for each subfield population is shown in Fig. 2A. In accordance with RF structures of putative input sources to the LP (Dreher et al. 1996; Pernberg et al. 1998; Piché et al. 2013), RF subfields were elongated with an average major-to-minor axis ratio of 1.63 ± 0.11 (P < 0.001, Wilcoxon signed rank test, n = 151).
Fig. 2.
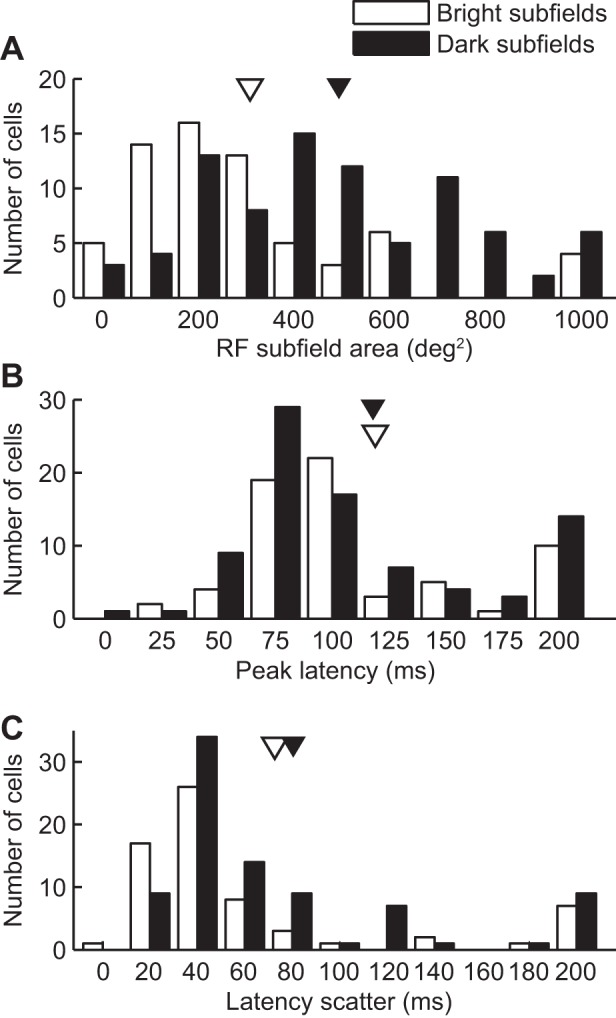
Basic spatial and temporal features of LP neuron RFs. Distribution histograms of basic RF features for bright (open bars) and dark (filled bars) subfields. Means are indicated by arrowheads. A: distribution histogram of RF subfield sizes. Note that the dark subfield size distribution is shifted to higher surface values (mean in deg2 for bright subfields: 314 ± 35 and for dark subfields: 511 ± 38). B: distribution histogram of the prespike time associated with the maximal spike probability (peak latency). Mean peak latency was 119 ± 6 ms and was not found to differ between bright and dark subfields (bright: 119 ± 9, n = 66, dark: 118 ± 8, n = 85, P > 0.05 Wilcoxon rank sum test). C: distribution histogram of the time duration during which spike probability was above chance levels (latency scatter). A small, yet significant, increase in latency scatter was observed for dark subfields (bright: 73 ± 12 ms, dark: 81 ± 8 ms, P < 0.01 Wilcoxon rank sum test).
In the time domain, onset and peak latencies and latency scatter values were computed. The mean subfield onset latency was 89 ± 6 ms (n = 151), and, although we detected a trend in the data toward shorter onset latencies for dark subfields, it was not statistically significant (bright: 94 ± 9 ms, dark: 86 ± 7 ms, P = 0.1 Wilcoxon rank sum test). The mean latency to obtain peak probability was 119 ± 6 ms for all subfields (n = 151) and was not found to differ between bright and dark subfields (bright: 119 ± 9 ms, n = 66, dark: 118 ± 8 ms, n = 85, P > 0.05 Wilcoxon rank sum test; Fig. 2B). Finally, the latency scatter, i.e., the time extent where spike probability is higher than chance, was calculated. For the majority of subfields (61%, n = 92), latency scatter values were within the range of 20–60 ms, and the average from the entire subfield population was of 77 ± 7 ms (n = 151). When comparing latency scatter for bright and dark subfields, a small, yet significant, increase in latency scatter was observed for dark subfields (bright: 73 ± 12 ms, dark: 81 ± 8 ms, P < 0.01 Wilcoxon rank sum test). Despite this difference in mean latency scatter, bright and dark subfield population distribution histograms were similar (Fig. 2C).
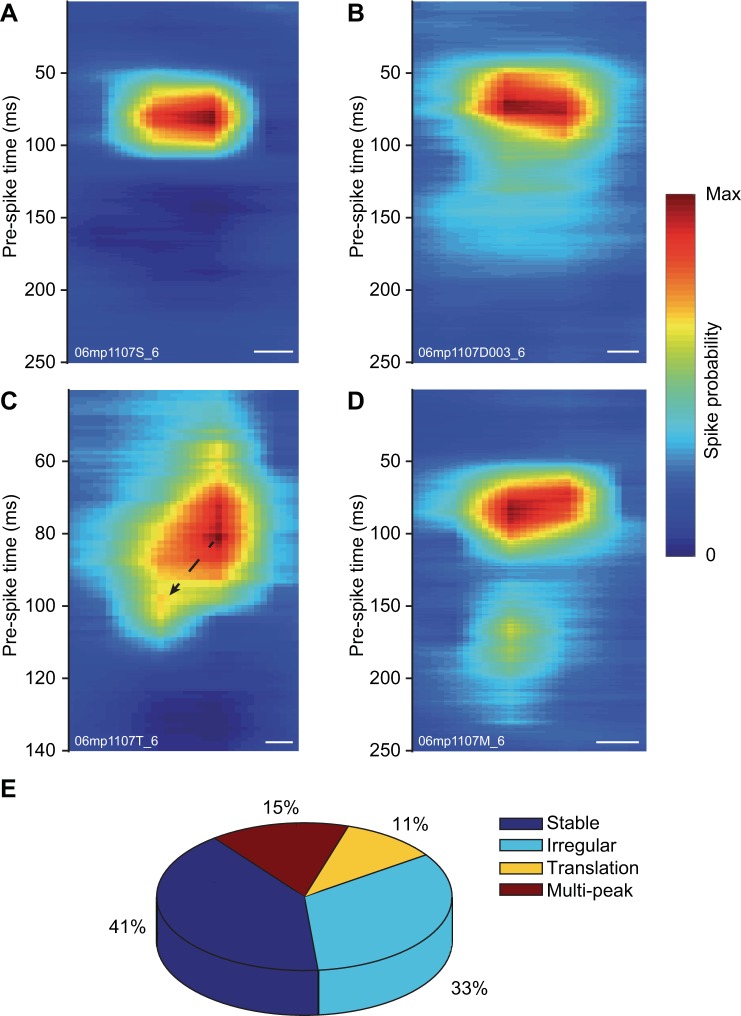
The RFs of visual neurons can be considered as dynamic filters processing stimuli in both space and time domains (Cai et al. 1997; DeAngelis et al. 1993a). To describe the interdependence between RF spatial and temporal profiles, we analyzed the RF positions across the reverse-correlation period (Fig. 3). For most subfields (n = 62, 41%), their spatial localization was stable in time, and their x–t probability maps showed a smooth and concentric probability profile (see Fig. 3A for an example). Alternatively, other subfields (n = 50, 33%), while maintaining their center position, exhibited irregular boundaries over time (see Fig. 3B). Interestingly, a subset of subfields (n = 16, 11%) exhibited x–t profiles where the optimal stimulus position would drift over time (Fig. 3C), indicating that their spatiotemporal profile was space-time inseparable. This profile was seen for nine bright and seven dark subfields. The translation of the peak ranged from 0.7 to 4.6°, which correspond to a difference of 3–19% (mean of 7%) compared with the size of the subfield. Finally, a subset of 23 subfields (15%, 21 neurons) was characterized by the presence of more than one activation period in the time domain (Fig. 3D). In all cases, the second activation in time was at the same spatial position as the first one and, except for one case, was associated with a lesser maximal probability amplitude. It is noteworthy to mention that the period between the responses was independent of the duration of the stimuli used, whether it was set to 16, 32, or 64 ms (data not shown).
Fig. 3.
LP neuron RF space and time domain interdependence. A–D: examples of heat color-coded spike probability x–t maps. From the peak probability y-axis value, the spike probability profile along the x-axis is consecutively drawn at the analysis temporal resolution (1 ms). Bar size, 10°. A: example from a neuron with a stable space- and time-circumscribed RF subfield. B: example from a neuron with irregular spatial boundaries that vary in time around its central position. C: example from a neuron exhibiting translation of its subfield position across time. D: example from a neuron with multiple peak activation periods. E: pie chart showing the proportion of the different spatiotemporal profiles found in the LP neuron population.
Neurons with polarity-opposed subfields.
Neurons with stimulus polarity-opposing subfields (n = 60) were further analyzed to study their RF spatial organization and to compare subfield spatial and temporal properties.
Spatial properties.
In the space domain, paired comparison between bright and dark subfield sizes indicated that dark-activated subfields are larger than their bright counterpart (mean bright: 318 ± 38 deg2, dark: 486 ± 31 deg2, P < 0.001 Wilcoxon signed-rank test, n = 60). This is clearly observed in the scatter plot presented in Fig. 4A where a large proportion of points lies above the line of unity. Subfield size asymmetry was further illustrated by SSI values (see methods). SSI mean value and distribution were clearly shifted to negative values (mean: −0.26 ± 0.05, P < 0.001 1-sample t-test, n = 60; Fig. 4B). A majority of neurons (55%, n = 33) exhibited SSI values below −0.2, indicative of significantly larger dark subfields. The bulk of the remaining cells (33%, n = 20) showed comparable subfield sizes (SSI between −0.2 and 0.2). Occasionally (12%, n = 7), a larger bright subfield was observed (SSI >0.2).
Fig. 4.
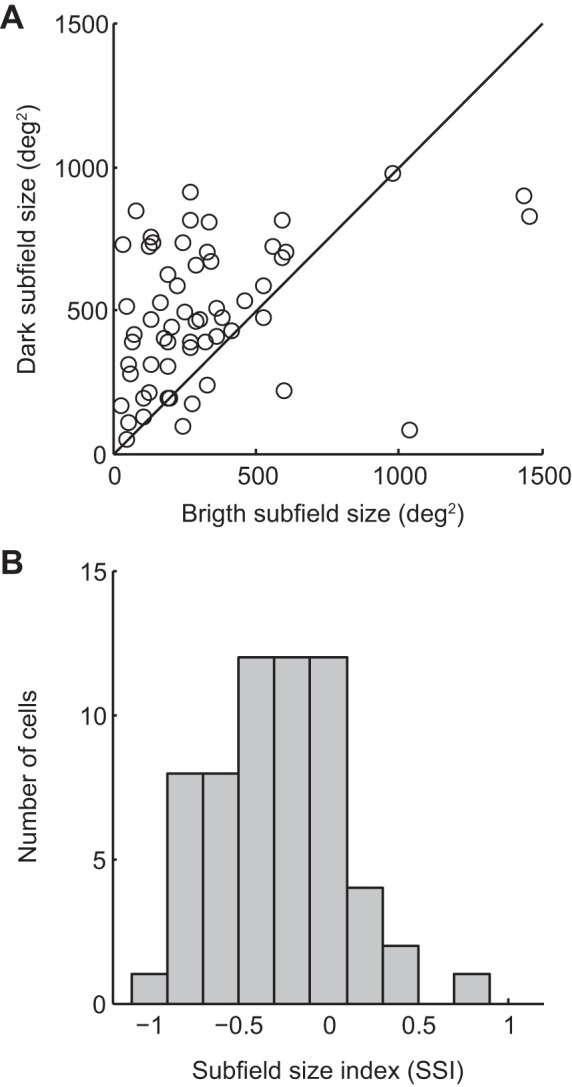
Differences in subfield size from neurons with polarity-opposed subfields. A: scatter plot of subfield size from paired bright and dark subfields. Note the higher proportion of points that lie above the line of unity, indicating a bias toward larger dark subfield sizes. B: distribution histogram of the subfield size index (see methods), a normalized index where negative values are associated with a larger dark subfield size. Distribution mean of −0.26 ± 0.05, P < 0.001 1-sample t-test, n = 60.
We next quantified RF homogeneity using a SOI (see methods). The distribution histogram of SOI values is shown in Fig. 5A. Besides the prominent group of neurons that shows little or no subfield spatial overlap, a very broad distribution of SOI values was found across the remaining cells. Further classification of RF organization was performed semiquantitatively (Fig. 5, B and C), with representative RF arrangements shown in Fig. 5B. A first class of RF organization found consisted on RF with subfields that did not overlap (“segregated,” SOI = 0, n = 21, 35% of cells). In two cases, subfields were adjacent, but otherwise the subfields were clearly separated in space (see Fig. 5B for an example). For cells that exhibited spatial subfield overlap, the most frequent subfield arrangement found (n = 25, 42%) had one of the subfields totally colocalized with the other (≥90% of 1 subfield in the overlap area). The remaining neurons were considered as “partially overlapped” (n = 14, 23%).
Fig. 5.
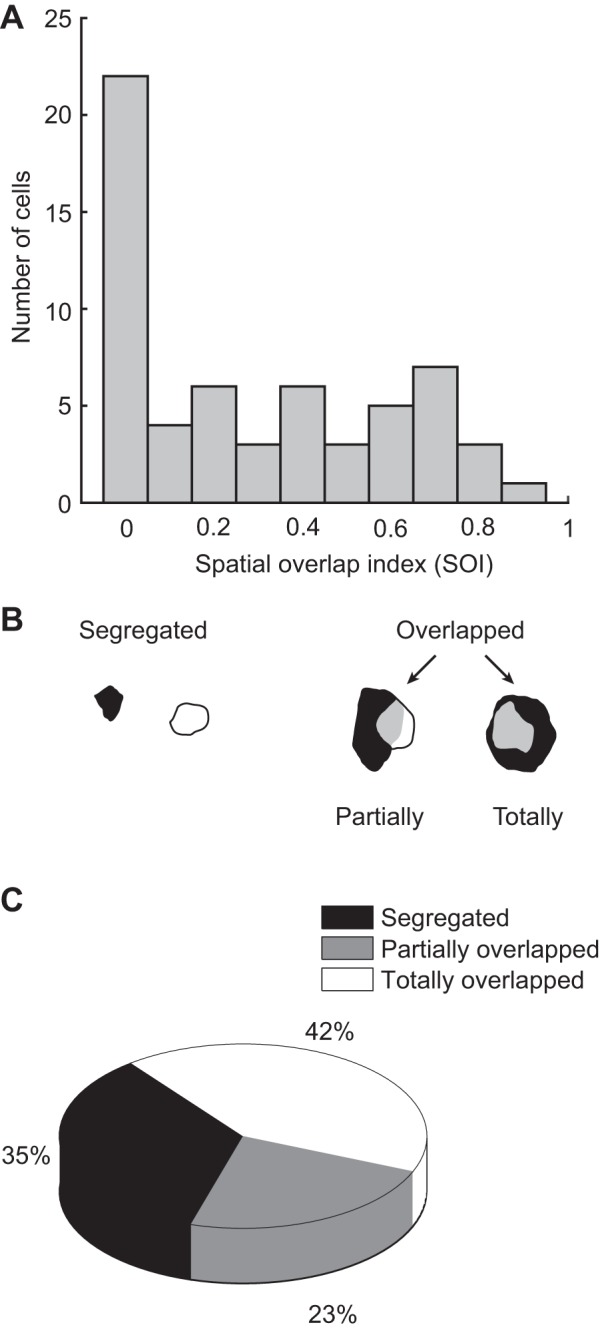
Spatial organization of LP neuron RFs with polarity-opposed subfields. A: distribution histogram of the spatial overlap index (see methods), a normalized index quantifying the degree of spatial overlap between bright and dark subfields. B and C: results from a semiquantitative classification of RF organization found in LP neurons. B: drawings of the different subfield organization types found in LP nucleus. C: pie chart showing the proportion of cells found in each spatial organization class.
In summary, based on the spatial arrangement of subfields, three different types of RF organization could be determined.
Temporal properties.
In the time domain, paired comparisons between bright and dark subfields' temporal profiles were performed. In support of the trend present in the entire dataset, onset latencies were found to be slightly shorter for dark subfields compared with their paired bright subfield (bright: 88 ± 8 ms, dark: 84 ± 9 ms, P < 0.05 Wilcoxon sign rank test, n = 60). No difference was found between bright and dark subfield peak latency distributions (bright: 113 ± 8 ms, dark: 120 ± 10 ms, P > 0.05 Wilcoxon sign rank test, n = 60). As shown in Fig. 6A, for the majority of neurons (66%, n = 40), the difference between dark and bright peak latencies was <50 ms as seen by the accumulation of datapoints along the unity line. Only a few neurons (n = 10) had large delays between subfield peak latencies (>100 ms). Finally, the difference between bright and dark subfield latency scatter was also examined. Cluster analysis (k-means method) identified three populations of cells based on their difference in latency scatter (Fig. 6B). While most cells had comparable latency scatter values between subfields (cluster 2: average bright-dark scatter difference: −19 ± 5 ms, n = 44), two groups of cells had the latency scatter of one of their subfields markedly outlasting that of the other (cluster 1: 280 ± 46 ms, n = 6; cluster 3: −174 ± 36 ms, n = 10).
Fig. 6.
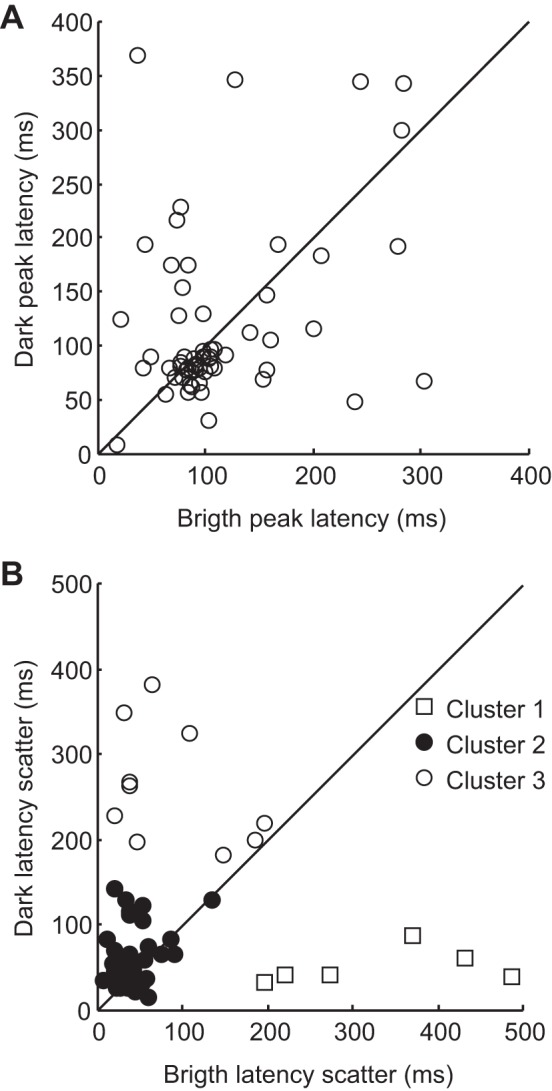
RF temporal profiles of LP neurons with polarity-opposed subfields. A: scatter plot of the prespike times associated with maximal spike probability (peak latency) of dark subfields as a function of their paired bright subfields. Most neurons had similar subfield peak latency values (40/60 cells with <50 ms difference between subfield peak latencies). B: results from cluster analysis of latency scatter differences between bright and dark subfields. K-means cluster analysis identified three groups of cells: one with similar subfield latency scatter values (cluster 2: Δ −19 ± 5 ms, n = 44) and two more groups with distinct subfield latency scatter values (cluster 1: Δ 280 ± 46 ms, n = 6, cluster 3: Δ −174 ± 36 ms n = 10).
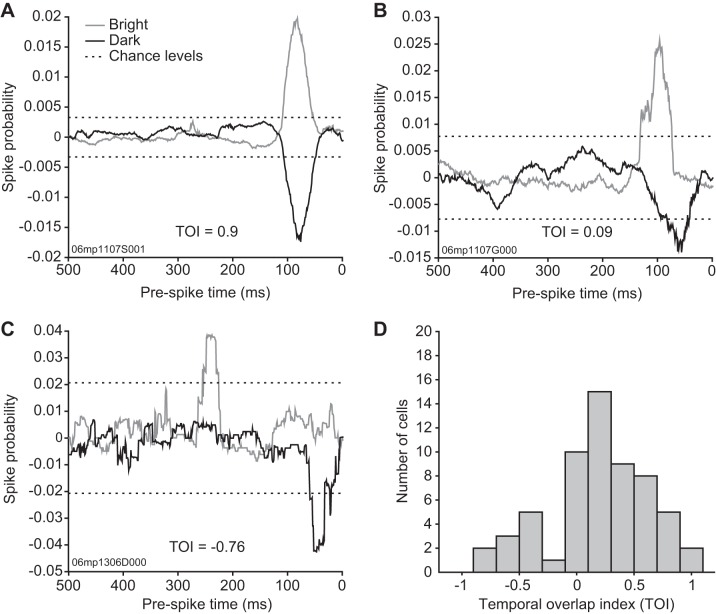
A TOI was calculated to quantitatively assess the level of congruence of the subfield response dynamics in the time domain. Three different temporal profiles were found, and representative cells are presented in Fig. 7. The first type consisted of RFs with extensive temporal overlap between their bright and dark subfields. Fifteen cells had their subfield activity profile overlap in time by >50% (TOI > 0.5). An example of such extensive temporal activity overlap is shown by the neuron presented in Fig. 7A. This cell had almost identical latency scatter (56 ms for bright and 58 ms for dark) and peak latencies (82 and 79 ms for bright and dark, respectively) and had a TOI value of 0.9. The second type of temporal profile observed consisted of cells with consecutive subfield temporal activity and was associated with low TOI values (0 < TOI < 0.5, n = 30). A representative cell is shown in Fig. 7B where only 10% of the entire temporal profile had both subfields activated (TOI = 0.09). The last group of cells had clear time-dissociated subfield activity and exhibited negative TOI values (n = 15). The cell shown in Fig. 7C, for example, had a TOI value of −0.76. The distribution of the TOI among double-subfield RFs is presented in Fig. 7D.
Fig. 7.
Subfield temporal profile concurrence of LP neurons with polarity-opposed subfields. To quantify the degree of synchronicity between bright and dark subfield spike probability latency profiles, a temporal overlap index (TOI, see methods) was computed. Negative values indicate time-segregated subfield spike latency profiles, whereas a value of 1 would indicate perfect synchrony between bright and dark subfield profiles. A–C: examples of temporal profiles obtained from LP neurons with polarity-opposed subfields where spike probability is plotted as a function of prespike time. Bright subfield spike probability is plotted in gray, whereas dark subfield is plotted in dark and, by convention, given negative values. Dotted lines indicate the spike probability levels expected by chance. Individual TOI values are indicated in the graphs. A: spike probability timecourse from a neuron with concurrent subfield spike latencies. B: spike probability timecourse from a neuron with subfield spike latencies that partially overlap. C: spike probability timecourse from a neuron with time-segregated subfield spike latencies. D: histogram of the TOI. Note the distinct distribution peak in negative TOI values (15/60 cells had negative TOI values).
Relation between spatial and temporal properties.
We investigated whether there was a relationship between the TOI and SOI RF features of double-subfield neurons (Fig. 8). A correlation with a determination coefficient of 0.29 (P < 0.001, F-test) was found between SOI and TOI, suggesting that subfield spatial and temporal overlaps are positively associated RF features. This correlation could be explained by known characteristics from putative cortical inputs to the LP nucleus such as area 17 complex cells (i.e., with substantial subfield spatial overlap) that were shown to possess concomitant subfield activity (Liu et al. 2007).
Fig. 8.
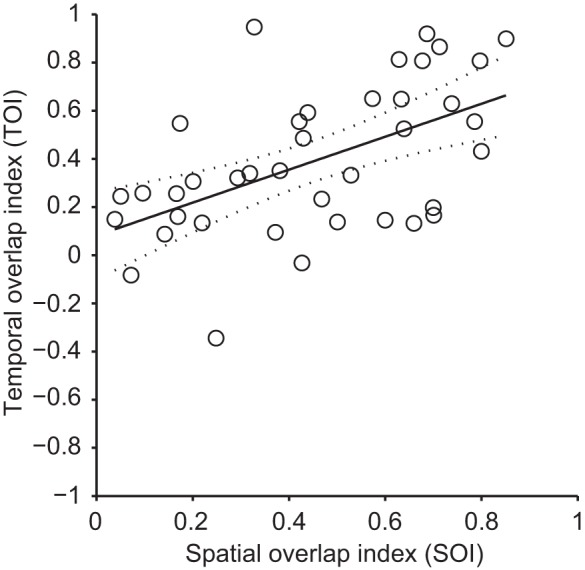
Correlation between spatial and temporal overlap indexes from neurons with polarity-opposed subfields. TOI values were plotted against spatial overlap index (SOI) values and subject to linear regression analysis. A correlation with a determination coefficient of 0.29 (P < 0.001, F-test) was found between SOI and TOI. Solid line represents the linear regression, and the dotted lines represent the 95% confidence interval of the regression.
RF properties comparison between LPl and LPm neurons.
As stated in the Introduction, in addition to characterize LP RFs, this study's goal was also to determine whether RF spatiotemporal structures differ between LP subdivisions. Of the 91 neurons recorded in this study, 47 were from the LPl and 29 from the LPm (Fig. 9). The remaining 15 cells were recorded in the LP nucleus (revealed by the Nissl coloration) but could not be linked with confidence to the LPl or LPm due to faulty acetylcholinesterase staining. The latter group will not be included in the following analyses.
Fig. 9.
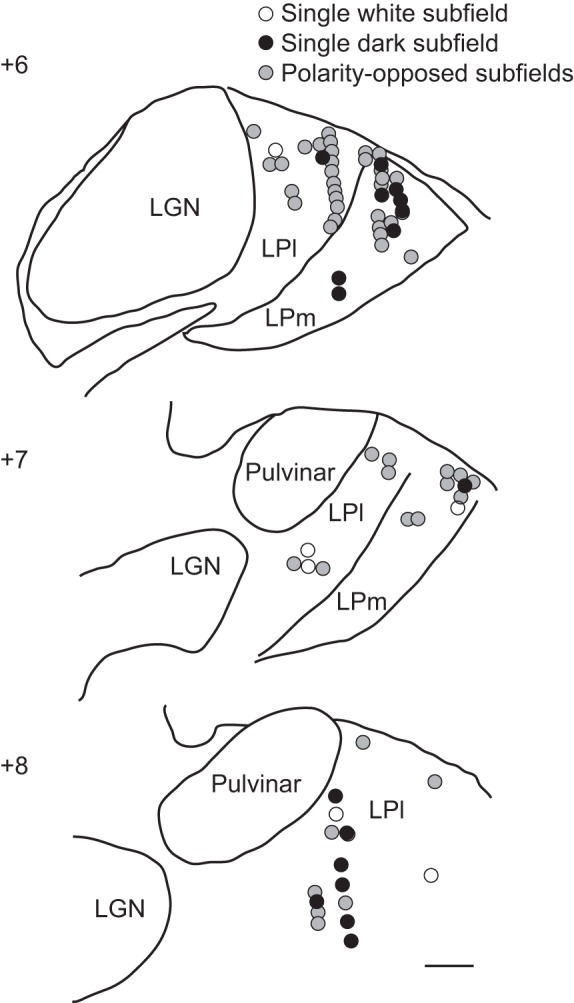
Anatomic distribution of recording sites. Schematic drawings of thalamic coronal sections at different antero-posterior coordinates indicating the anatomic position of the neurons studied. Neurons with polarity-opposed subfields are indicated by gray circles, whereas neurons with single bright or dark subfields are indicated by open and filled circles, respectively. LGN, lateral geniculate. Scale bar is 1 mm.
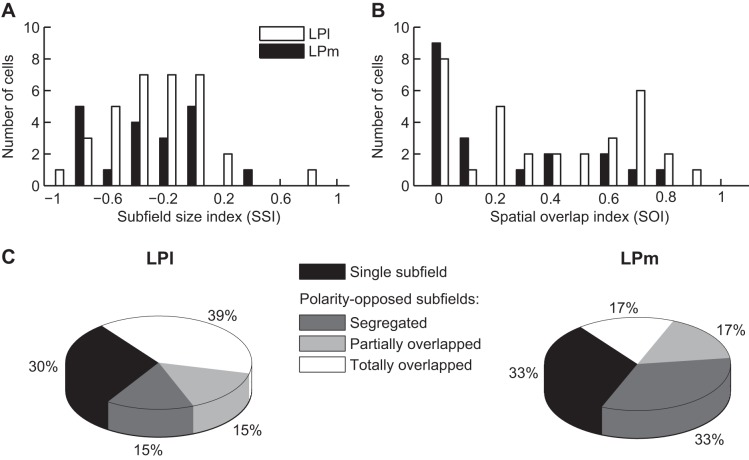
The RF sizes between LPm and LPl cells were first compared. LPm and LPl RF sizes were not different whether the whole RF (i.e., including all subfields) or polarity-specific subfields were considered (P > 0.05 in all cases, Wilcoxon rank sum tests, data not shown). In addition, the elongation of subfields was not found to differ between the two LP subdivisions (P = 0.78 Wilcoxon rank sum test). Furthermore, for neurons with polarity-opposed subfields, no difference was observed between LPm and LPl SSI distributions (P > 0.05 Student's t-test; Fig. 10A).
Fig. 10.
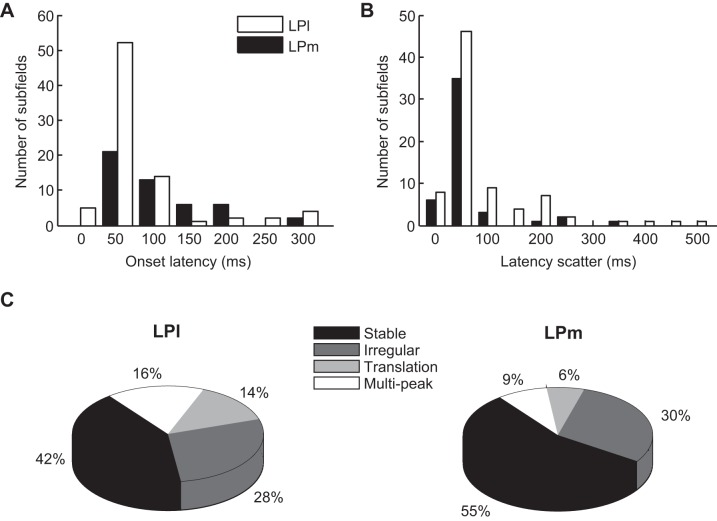
Comparison between LPl and LPm RF profiles in the space domain. A: distribution histogram of the subfield size index (SSI) for LPl (open bars) and LPm (filled bars). Distributions were not found to significantly differ (P > 0.05 Student's t-test). B: distribution histogram of the SOI for LPl (open bars) and LPm (filled bars). LPl nucleus data included more cells with high SOI values (P < 0.05 Wilcoxon rank sum test). C: pie charts showing the proportion of the different RF spatial organization types found in LPl (left) and LPm (right) nuclei. Note the higher proportion of neurons with totally overlapped subfields in LPl (P < 0.05 Chi square test with Bonferroni post hoc test).
However, some differences were found in the spatial organization of subfields between the two nuclei. The SOI distribution revealed that a higher fraction of LPl cells exhibited 50% or more of subfield overlap (P < 0.05 Wilcoxon rank sum test; Fig. 10B). This difference is reflected in the RF classification shown in Fig. 10C where totally overlapped RFs were more frequently found in the LPl than in the LPm (39 vs. 17%, P < 0.05 Chi square test with Bonferroni post hoc test). Despite a higher occurrence frequency of segregated subfields in the LPm vs. the LPl (33 vs. 15%), this difference was not statistically significant (P > 0.05 Chi square test), probably because of the small cell count.
In the time domain, peak and offset latencies did not differ between LPm and LPl cells (P > 0.05 Wilcoxon rank sum test). Onset latencies were statistically smaller for LPl cells than for LPm cells despite very similar distribution histograms (median of 60 ms for LPl and 86 ms for LPm, P < 0.05 Wilcoxon rank sum test; Fig. 11A). Accordingly, latency scatter was slightly larger for LPl cells compared with LPm cells (median LPl: 48 ms, LPm: 36 ms, P < 0.01 Wilcoxon rank sum test; Fig. 11B). Furthermore, in neurons with polarity-opposed subfields, subfield temporal overlap was on average larger in LPl neurons compared with LPm neurons (TOI median LPl: 0.26, LPm: 0.09, P < 0.05 Wilcoxon rank sum test). When performing cluster analysis of latency scatter (as shown in Fig. 4), no difference was found between LPm and LPl cell cluster values (P > 0.05, Student's t-test, data not shown).
Fig. 11.
Comparison between LPl and LPm RF profiles in the time domain. A: distribution histogram of subfield onset latency for LPl (open bars) and LPm (filled bars). LPl subfield onset latencies were on average smaller than for LPm subfields (P < 0.05 Wilcoxon rank sum test). B: distribution histogram of subfield latency scatter for LPl (open bars) and LPm (filled bars). LPl subfield latency scatters were on average larger than for LPm subfields (P < 0.01 Wilcoxon rank sum test). C: pie charts showing the proportion of the different spatiotemporal profile types found in LPl (left) and LPm (right) nuclei. No statistically significant difference was found in the occurrence rate of profile types between the two nuclei.
Finally, we also compared the incidence of spatiotemporal profile types between LPm and LPl nuclei, through space-time plots as seen in Fig. 2. All spatiotemporal profile types were present in both LPm and LPl nuclei (Fig. 11C). The apparent greater occurrence frequency of cells with dynamic subfield x–t profiles in the LPl over the LPm (subfield translation: 14 vs. 6%, multipeaks: 16 vs. 9%) was not statistically significant (P > 0.05 Chi square test).
In summary, LPm and LPl neuron RFs differ in a few features, with the LPl nucleus comprising a greater proportion of neurons with high spatial and temporal overlap.
Comparison between RF structure and responses to drifting gratings.
For a subset of cells, responses to drifting sinusoidal gratings were quantified once their RF spatiotemporal profiles were obtained. Because first-order spatiotemporal profiles have successfully predicted primary visual cortex RF properties such as their selectivity to velocity, spatial and temporal frequencies, and even their direction selectivity (DeAngelis et al. 1993a, 1993b), we sought to determine if that was the case for LP neurons. From the 91 cells included in this study, 46 cells were tested with gratings. A total of 31 neurons (LPl: 17, LPm: 14) responded selectively to gratings stimuli (i.e., were orientation or direction selective). We concentrated our analysis on the possible relations between temporal and spatial features of the profiles obtained with modulation and direction indexes. We hypothesized that subfield spatial overlap would correlate negatively with the modulation index (Mata and Ringach 2005) but also tested whether aspects of their temporal structure, such as temporal asynchrony, would correlate with this index, as seen in the posteromedial lateral suprasylvian (PMLS) cortex (Piché et al. 2013). Contrary to our hypotheses, no correlation was found between the modulation index and the SOI (r2 = 0.004, P = 0.773), the TOI (r2 = 0.05, P = 0.227), and the difference between subfield peak latencies (r2 = 0.009, P = 0.662). The relation between space or time separation of subfields and direction selectivity was also examined. No correlation was found between the direction index and subfield overlap (r2 = 0.002, P = 0.827), TOI (r2 = 0.035, P = 0.35), or the difference between subfield peak latencies (r2 = 0.148, P = 0.077). Finally, all correlations were unaffected by selecting subdivision-specific data (data not shown). Hence, our data indicate that first-order RF spatiotemporal profiles are poor predictors of response properties of LP neurons.
DISCUSSION
In this study, a statistical analysis procedure (reverse correlation) coupled with stochastic visual stimulation (white noise) was successfully used to characterize RF structures from the two main subdivisions of cat LP nucleus in the joint domains of space and time. Despite differences in afferent connectivity (in particular, the input from the striate cortex in LPl and from the superior colliculus in LPm), there were few differences between the spatiotemporal organization of LPl and LPm RFs.
Spatial organization of LP neuron RFs: Comparison with other studies.
In the LPl, the majority of cells that were recorded exhibited spatially overlapped subfields, in agreement with their previous RF description as a complex-like structure (Chalupa and Abramson 1989) and their unmodulated discharge to drifting sine wave gratings (Casanova et al. 1989). The LPl is the sole LP subdivision that receives a direct input from the primary visual cortex (Berson and Graybiel 1983; Graybiel and Berson 1980), originating mostly from layer V complex cells (Casanova 1993). The cryoblockade or lesion of area 17 strongly decreases visual responses in a subset of LPl neurons (Casanova et al. 1997). Similarly in primates, the removal of primary visual cortex (V1) eliminates visual responses for the vast majority of pulvinar neurons (Bender 1983). Thus, given the functional significance of striate input on the LPl neurons, one could expect that their RF spatial structure be mainly sculpted by signals from area 17 complex cells. In the literature, there are very few data on first-order spatiotemporal profiles of area 17 complex cells, often limited to a single example of their spatial structure (DeAngelis et al. 1995) or on the influence of neurotransmitters on their one-dimensional spatiotemporal profiles (Liu et al. 2007). Nonetheless, as reported by Liu et al. (2007), area 17 complex cell RFs are characterized by size-predominant dark subfields. Thus, some basic RF features of LPl neurons, such as subfield size asymmetry, could indeed be inherited from inputs of area 17 complex cells.
However, close to half of LPl cells recorded in this study exhibited RF spatial organization profiles that cannot be considered complex-like structures and are thus likely to stem from other input sources: RF with polarity-opposed segregated subfields (15% of cells) or with single subfields (30% of cells). Thus, extrastriate synaptic input may also be important in shaping RF properties in the LPl. Our group (Piché et al. 2013) has described the first-order RF spatial profile of neurons in the lateral suprasylvian (LS) cortex, which is reciprocally connected with the LPl (Berson and Graybiel 1983; Rauschecker et al. 1987). We found that LS neurons have larger dark subfields and displayed RF spatial organization types highly similar to those found in the LPl, with comparable occurrence rates (Piché et al. 2013).
Hence, our results promote the idea that, despite a prominent input from area 17 complex cells, the LPl RF properties are also built from inputs originating from extrastriate cortexes (Berson and Graybiel 1983).
In the LPm, the subdivision receiving a distinctive input from the superior colliculus (Caldwell and Mize 1981; Graybiel 1972), the vast majority of neurons recorded (two-third of cells) had RFs comprising polarity-opposed subfields. With the exception of one cell, those LPm neurons had nonhomogenous RF, consisting of spatially offset subfields. Such RF spatial organization had been previously found but only at anecdotic levels in both the LPm (Chalupa et al. 1983) and the superior colliculus (Dreher and Hoffmann 1973; Sterling and Wickelgren 1969). Thus, our data differ from previous ones reporting that two-thirds of LPm neuron RFs were composed of single subfields (Chalupa and Abramson 1988; Chalupa et al. 1983). The high proportion of nonhomogenous RF found in our data can result from differences in mapping technique. The method used in the present study is markedly different from those of earlier works, and it is not clear how results based on white noise stimulus and reverse correlation can relate with those obtained with simple flashing spots of light. Nevertheless, the variety of RF profiles in the LPm may reflect the complex connectivity of this subnucleus. Indeed, superior colliculus neurons that project to the LPm nucleus are found to vary extensively in their collicular laminar position, size, morphology, and synaptic connectivity (Caldwell and Mize 1981) as well as in their response properties (McIlwain 1978). Furthermore, the scope of profiles found in the LPm could also simply reflect the convergence of corticothalamic inputs from extrastriate areas (Abramson and Chalupa 1985; Graybiel 1972; Graybiel and Berson 1980; Scannell et al. 1999; Updyke 1977). In fact, the cortical input may be functionally more critical than that from the superior colliculus. Indeed, there is some indication that visual responses in the LPm depend on the integrity of the visual cortex (Hughes and Chalupa 1982; Merabet et al. 1998), whereas cooling of the superior colliculus causes only a minor enhancement of LPm visual responses, suggesting that the collicular signals are predominantly modulatory in nature (Chalupa et al. 1972).
Temporal profiles of LP neuron RFs.
In addition to the RF spatial structures highlighted above, our study uncovers the detailed temporal structure of LP RFs for the first time. Finding appropriate studies to compare LP RF temporal profile data is difficult for several reasons. First, the type of visual stimuli (e.g., gratings, plaids) can influence onset latencies in numerous visual structures, including the LP-pulvinar (Ouellette and Casanova 2006). Thus, the onset latencies obtained with suboptimal-sized white noise squares presented briefly is likely to differ from the ones obtained with stimuli that are more “standard.” For example, a difference of ∼15 ms exists between onset latencies obtained with gratings and the ones obtained through reverse correlation/white noise stimuli (Ouellette and Casanova 2006; Piché et al. 2013; this study). Furthermore, the temporal resolution of the reverse correlation analysis (Jones and Palmer 1987; Liu et al. 2007) and the setting of the significance threshold (Liu et al. 2007; Piché et al. 2013) are two factors that can also influence latency values. Nonetheless, the onset latencies reported in this paper (89 ± 6 ms) fall within the range of onset latencies obtained in the LP-pulvinar using gratings and random dot kinematogram stimuli (70 and 118 ms, respectively, in Ouellette and Casanova 2006).
Of interest is the fact that, with the use of both standard (Ouellette and Casanova 2006) or white noise/reverse correlation procedures (Piché et al. 2013; and this study), onset and peak latency values from the LP-pulvinar, area 17, LS, and anterior ectosylvian visual areas were not statistically different. Concurrent response profiles between cortical areas and the LP-pulvinar suggest that the latter is part of parallel processing streams rather than a “simple” relay station for transthalamic cortico-cortical visual information flow.
There was a trend in our data suggesting shorter onset latencies for LP dark subfields compared with bright subfields. A similar relationship was also found in the PMLS (Piché et al. 2013), further supporting the recent demonstration, in cats, that the cortical “off” pathway is faster than the “on” pathway (Komban et al. 2014).
The analysis technique used allowed the description of LP neurons with particular dynamic spatiotemporal profiles. First, a subset of neurons exhibited subfields subject to time-dependent translation. Subfields that undergo translation can be conceptualized as RF subunits moving in time but can be alternatively considered as fixed static entities, comprised of subdomains with different temporal profiles. Intra-RF regional changes in onset latencies have been reported in both collicular (Harutiunian-Kozak et al. 1973) and area 17 complex cells (Li and Nothdurft 1987). Therefore, translational spatiotemporal RF profiles of LP neurons may originate from such input sources. Although RF translation is likely to confer direction selectivity to striate cortex simple cells (DeAngelis et al. 1993b; De Valois et al. 2000), this may not hold true for LP neurons since, within the limited dataset of cells tested with gratings, the direction index and the occurrence of subfield translation were uncorrelated.
Another subset of LP neurons had spike probability timecourses with more than one probability peak. These temporal biphasic profiles may originate from the integration of multiple input sources. Similar profiles have been described in areas 17 and 18 and LS cortexes (Liu et al. 2007; Pernberg et al. 1998; Piché et al. 2013), and it was proposed that such temporal profiles play a key role in motion detection (De Valois et al. 2000). Thus, the presence of biphasic neurons in the LP nucleus is in agreement with the fact that cells in this area are highly sensitive to simple and complex motion stimuli (Casanova 2004; Dumbrava et al. 2001; Merabet et al. 1998).
First-order RF spatiotemporal profiles and LP neuron responses to gratings.
Whereas first-order RF spatiotemporal profiles were found to explain a number of decoding features of LGN, suprasylvian, and primary visual cortex simple cells in the cat (Cai et al. 1997; DeAngelis et al. 1993a, 1993b; Piché et al. 2013) and LGN and V1 neurons in primates (De Valois et al. 2000), our data indicate that such profiles have poor predictive value for LP neurons. This divergence suggests the existence of nonlinear properties in LP RFs that can result from imbalance in subfield sensitivity/response strength and/or in its temporal profiles. Thus, our work put forward the use of complementary techniques to study LP neuron RF spatiotemporal structures such as motion reverse correlation paradigms (Borghuis et al. 2003) or higher-order stimulation and analysis kernels (Emerson et al. 1987).
Comparison between the LPl and LPm.
As stated above, the pulvinar of higher-order mammals is comprised of several subnuclei that have distinctive connectivity patterns (Casanova 2004). In this regard, one could expect to see differences in RF structure between the two main subnuclei.
Previous studies indicated that LPl and LPm neurons differ in two important attributes (Chalupa and Abramson 1988, 1989; Chalupa et al. 1983; Mason 1981): their respective RF size and spatial organization. Chalupa and collaborators reported that LPm RF sizes are on average four times larger than for LPl neurons (Chalupa and Abramson 1988; Chalupa et al. 1983). Such a difference was not found in our dataset, and this discrepancy may come from several factors. As discussed above, it is likely due to differences in probing stimuli and mapping techniques. RF boundaries in the LP nucleus are often diffuse and consequently difficult to be precisely delineated through hand mapping, and are usually probed using high-energy stimuli (Chalupa and Abramson 1989). Reverse correlation technique uses a purposely set low-energy linear stimulus and, because of the automated nature of the stimulation protocol, could delineate RF contours with higher precision. Differences between previous studies may also come from the fact that some of our LPl recordings were located in the dorsolateral segment of LPl where RFs are larger in size (Chalupa and Abramson 1989).
As mentioned above when discussing the spatial organization of LP RFs, our data reveal an unexpectedly broad range of RF spatial organization types for both LPm and LPl subregions. When comparing the proportion of spatial organization types expressed in LP subregions, RFs with totally overlapped subfields were more frequently found in the LPl compared with the LPm, consistent with a putatively prominent input from complex cells in the LPl. However, despite this difference, our data clearly indicate that no singular spatial profile was exclusive to a single LP subdivision.
The main difference between LPl and LPm temporal profiles was a larger latency scatter in LPl neurons that was accompanied by a larger temporal activity overlap between bright and dark subfields. According to the coarse-to-fine processing model (Einevoll et al. 2011; Moore et al. 2014), early neuronal activity conveys coarse visual information, whereas late activity, through RF component interactions, carries more detailed information. Hence, following this model, LPm and LPl neurons would preferentially be associated to the processing taking place along the “what” and “where” pathways, respectively (Lomber 2001; Lomber et al. 1996).
Taken together, our results show that, based on their first-order spatiotemporal RF profiles, LPl and LPm neurons form a rather analogous population of cells. This suggest that RF structures of LP neurons do not simply reflect their specific inputs but are most likely to result from a high degree of synaptic integration of subcortical and cortical inputs. This further supports the important contribution of this extrageniculate nucleus in higher-order visual processing.
GRANTS
This work was supported by a Canadian Institute of Health Research (MOP_14825) grant to C. Casanova.
DISCLOSURES
No conflicts of interest, financial or otherwise, are declared by the authors.
AUTHOR CONTRIBUTIONS
Author contributions: M.P. performed experiments; M.P., S.T., and C.C. analyzed data; M.P., S.T., and C.C. interpreted results of experiments; M.P. and S.T. prepared figures; M.P. drafted manuscript; M.P., S.T., and C.C. edited and revised manuscript; M.P., S.T., and C.C. approved final version of manuscript; C.C. conception and design of research.
ACKNOWLEDGMENTS
We thank Geneviève Cyr for help during histological procedures.
REFERENCES
- Abramson BP, Chalupa LM. The laminar distribution of cortical connections with the tecto- and cortico-recipient zones in the cat's lateral posterior nucleus. Neuroscience 15: 81–95, 1985. [DOI] [PubMed] [Google Scholar]
- Bender DB. Receptive-field properties of neurons in the macaque inferior pulvinar. J Neurophysiol 48: 1–17, 1982. [DOI] [PubMed] [Google Scholar]
- Bender DB. Visual activation of neurons in the primate pulvinar depends on cortex but not colliculus. Brain Res 279: 258–261, 1983. [DOI] [PubMed] [Google Scholar]
- Berson DM, Graybiel AM. Organization of the striate-recipient zone of the cats lateralis posterior-pulvinar complex and its relations with the geniculostriate system. Neuroscience 9: 337–372, 1983. [DOI] [PubMed] [Google Scholar]
- Boire D, Matteau I, Casanova C, Ptito M. Retinal projections to the lateral posterior-pulvinar complex in intact and early visual cortex lesioned cats. Exp Brain Res 159: 185–196, 2004. [DOI] [PubMed] [Google Scholar]
- Borghuis BG, Perge JA, Vajda I, van Wezel RJ, van de Grind WA, Lankheet MJ. The motion reverse correlation (MRC) method: a linear systems approach in the motion domain. J Neurosci Methods 123: 153–166, 2003. [DOI] [PubMed] [Google Scholar]
- Cai D, DeAngelis GC, Freeman RD. Spatiotemporal receptive field organization in the lateral geniculate nucleus of cats and kittens. J Neurophysiol 78: 1045–1061, 1997. [DOI] [PubMed] [Google Scholar]
- Caldwell RB, Mize RR. Superior colliculus neurons which project to the cat lateral posterior nucleus have varying morphologies. J Comp Neurol 203: 53–66, 1981. [DOI] [PubMed] [Google Scholar]
- Casanova C. Functions of the pulvinar in vision. In: The Visual Neurosciences, edited by Chalupa LM and Werner JS. MIT Press, 2004. [Google Scholar]
- Casanova C. Response properties of neurons in area 17 projecting to the striate-recipient zone of the cat's lateralis posterior-pulvinar complex: comparison with cortico-tectal cells. Exp Brain Res 96: 247–259, 1993. [DOI] [PubMed] [Google Scholar]
- Casanova C, Freeman RD, Nordmann JP. Monocular and binocular response properties of cells in the striate-recipient zone of the cat's lateral posterior-pulvinar complex. J Neurophysiol 62: 544–557, 1989. [DOI] [PubMed] [Google Scholar]
- Casanova C, Savard T. Motion sensitivity and stimulus interactions in the striate-recipient zone of the cat's lateral posterior-pulvinar complex. Prog Brain Res 112: 277–287, 1996. [DOI] [PubMed] [Google Scholar]
- Casanova C, Savard T, Darveau S. Contribution of area 17 to cell responses in the striate-recipient zone of the cat's lateral posterior-pulvinar complex. Eur J Neurosci 9: 1026–1036, 1997. [DOI] [PubMed] [Google Scholar]
- Chalupa LM, Abramson BP. Receptive-field properties in the tecto- and striate-recipient zones of the cat's lateral posterior nucleus. Prog Brain Res 75: 85–94, 1988. [DOI] [PubMed] [Google Scholar]
- Chalupa LM, Abramson BP. Visual receptive fields in the striate-recipient zone of the lateral posterior-pulvinar complex. J Neurosci 9: 347–357, 1989. [DOI] [PMC free article] [PubMed] [Google Scholar]
- Chalupa LM, Anchel H, Lindsley DB. Visual input to the pulvinar via lateral geniculate, superior colliculus and visual cortex in the cat. Exp Neurol 36: 449–462, 1972. [DOI] [PubMed] [Google Scholar]
- Chalupa LM, Williams RW, Hughes MJ. Visual response properties in the tectorecipient zone of the cat's lateral posterior-pulvinar complex: a comparison with the superior colliculus. J Neurosci 3: 2587–2596, 1983. [DOI] [PMC free article] [PubMed] [Google Scholar]
- DeAngelis GC, Ohzawa I, Freeman RD. Receptive-field dynamics in the central visual pathways. Trends Neurosci 18: 451–458, 1995. [DOI] [PubMed] [Google Scholar]
- DeAngelis GC, Ohzawa I, Freeman RD. Spatiotemporal organization of simple-cell receptive fields in the cat's striate cortex. I. General characteristics and postnatal development. J Neurophysiol 69: 1091–1117, 1993a. [DOI] [PubMed] [Google Scholar]
- DeAngelis GC, Ohzawa I, Freeman RD. Spatiotemporal organization of simple-cell receptive fields in the cat's striate cortex. II. Linearity of temporal and spatial summation. J Neurophysiol 69: 1118–1135, 1993b. [DOI] [PubMed] [Google Scholar]
- De Valois RL, Cottaris NP, Mahon LE, Elfar SD, Wilson JA. Spatial and temporal receptive fields of geniculate and cortical cells and directional selectivity. Vision Res 40: 3685–3702, 2000. [DOI] [PubMed] [Google Scholar]
- Dreher B, Hoffmann KP. Properties of excitatory and inhibitory regions in the receptive fields of single units in the cat's superior colliculus. Exp Brain Res 16: 333–353, 1973. [DOI] [PubMed] [Google Scholar]
- Dreher B, Wang C, Turlejski KJ, Djavadian RL, Burke W. Areas PMLS and 21 a of cat visual cortex: two functionally distinct areas. Cerebral Cortex 6: 585–599, 1996. [DOI] [PubMed] [Google Scholar]
- Dumbrava D, Faubert J, Casanova C. Global motion integration in the cat's lateral posterior-pulvinar complex. Eur J Neurosci 13: 2218–2226, 2001. [DOI] [PubMed] [Google Scholar]
- Einevoll GT, Jurkus P, Heggelund P. Coarse-to-fine changes of receptive fields in lateral geniculate nucleus have a transient and a sustained component that depend on distinct mechanisms. PloS one 6: e24523, 2011. [DOI] [PMC free article] [PubMed] [Google Scholar]
- Emerson RC, Citron MC, Vaughn WJ, Klein SA. Nonlinear directionally selective subunits in complex cells of cat striate cortex. J Neurophysiol 58: 33–65, 1987. [DOI] [PubMed] [Google Scholar]
- Emerson RC, Gerstein GL. Simple striate neurons in the cat. II. Mechanisms underlying directional asymmetry and directional selectivity. J Neurophysiol 40: 136–155, 1977. [DOI] [PubMed] [Google Scholar]
- Frazor RA, Albrecht DG, Geisler WS, Crane AM. Visual cortex neurons of monkeys and cats: temporal dynamics of the spatial frequency response function. J Neurophysiol 91: 2607–2627, 2004. [DOI] [PubMed] [Google Scholar]
- Gattass R, Oswaldo-Cruz E, Sousa AP. Visual receptive fields of units in the pulvinar of cebus monkey. Brain Res 160: 413–430, 1979. [DOI] [PubMed] [Google Scholar]
- Graybiel AM. Some extrageniculate visual pathways in the cat. Invest Ophthalmol 11: 322–332, 1972. [PubMed] [Google Scholar]
- Graybiel AM, Berson DM. Histochemical identification and afferent connections of subdivisions in the lateralis posterior-pulvinar complex and related thalamic nuclei in the cat. Neuroscience 5: 1175–1238, 1980. [DOI] [PubMed] [Google Scholar]
- Harutiunian-Kozak B, Dec K, Wrobel A. The organization of visual receptive fields or neurons in the cat colliculus superior. Acta Neurobiol Exp 33: 563–573, 1973. [PubMed] [Google Scholar]
- Hegde J, Van Essen DC. Temporal dynamics of shape analysis in macaque visual area V2. J Neurophysiol 92: 3030–3042, 2004. [DOI] [PubMed] [Google Scholar]
- Hughes MJ, Chalupa LM. Cortical cooling depressed visual neuronal responses in the tectorecipient zone of the cat's lateral posterior nucleus. Soc Neurosci Abstr 8: 673, 1982. [Google Scholar]
- Jones JP, Palmer LA. The two-dimensional spatial structure of simple receptive fields in cat striate cortex. J Neurophysiol 58: 1187–1211, 1987. [DOI] [PubMed] [Google Scholar]
- Komban SJ, Kremkow J, Jin J, Wang Y, Lashgari R, Li X, Zaidi Q, Alonso JM. Neuronal and perceptual differences in the temporal processing of darks and lights. Neuron 82: 224–234, 2014. [DOI] [PMC free article] [PubMed] [Google Scholar]
- Li CY, Nothdurft HC. Some observations on dynamic properties of receptive field organization of complex cells in cat visual cortex. Sci Sin Ser B Chem Biol Agricul Medical Earth Sci 30: 44–54, 1987. [PubMed] [Google Scholar]
- Liu S, Liu YJ, Li B. Spatiotemporal structure of complex cell receptive fields and influence of GABAergic inhibition. NeuroReport 18: 1577–1581, 2007. [DOI] [PubMed] [Google Scholar]
- Lomber SG. Behavioral cartography of visual functions in cat parietal cortex: areal and laminar dissociations. Prog Brain Res 134: 265–284, 2001. [DOI] [PubMed] [Google Scholar]
- Lomber SG, Payne BR, Cornwell P, Long KD. Perceptual and cognitive visual functions of parietal and temporal cortices in the cat. Cereb Cortex 6: 673–695, 1996. [DOI] [PubMed] [Google Scholar]
- Mason R. Differential responsiveness of cells in the visual zones of the cat's LP-pulvinar complex to visual stimuli. Exp Brain Res 43: 25–33, 1981. [DOI] [PubMed] [Google Scholar]
- Mata ML, Ringach DL. Spatial overlap of ON and OFF subregions and its relation to response modulation ratio in macaque primary visual cortex. J Neurophysiol 93: 919–928, 2005. [DOI] [PubMed] [Google Scholar]
- Mathers LH, Rapisardi SC. Visual and somatosensory receptive fields of neurons in the squirrel monkey pulvinar. Brain Res 64: 65–83, 1973. [DOI] [PubMed] [Google Scholar]
- McIlwain JT. Properties of cells projecting rostrally from the superficial layers of the cats superior colliculus. Brain Res 143: 445–457, 1978. [DOI] [PubMed] [Google Scholar]
- Menz MD, Freeman RD. Temporal dynamics of binocular disparity processing in the central visual pathway. J Neurophysiol 91: 1782–1793, 2004. [DOI] [PubMed] [Google Scholar]
- Merabet L, Desautels A, Minville K, Casanova C. Motion integration in a thalamic visual nucleus. Nature 396: 265–268, 1998. [DOI] [PubMed] [Google Scholar]
- Minville K, Casanova C. Spatial frequency processing in posteromedial lateral suprasylvian cortex does not depend on the projections from the striate-recipient zone of the cat's lateral posterior-pulvinar complex. Neuroscience 84: 699–711, 1998. [DOI] [PubMed] [Google Scholar]
- Moore BD 4th, Rathbun DL, Usrey WM, Freeman RD. Spatiotemporal flow of information in the early visual pathway. Eur J Neurosci 39: 593–601, 2014. [DOI] [PMC free article] [PubMed] [Google Scholar]
- Nguyen MN, Hori E, Matsumoto J, Tran AH, Ono T, Nishijo H. Neuronal responses to face-like stimuli in the monkey pulvinar. Eur J Neurosci 37: 35–51, 2013. [DOI] [PubMed] [Google Scholar]
- Ouellette BG, Casanova C. Overlapping visual response latency distributions in visual cortices and LP-pulvinar complex of the cat. Exp Brain Res 175: 332–341, 2006. [DOI] [PubMed] [Google Scholar]
- Pernberg J, Jirmann KU, Eysel UT. Structure and dynamics of receptive fields in the visual cortex of the cat (area 18) and the influence of GABAergic inhibition. Eur J Neurosci 10: 3596–3606, 1998. [DOI] [PubMed] [Google Scholar]
- Petersen SE, Robinson DL, Keys W. Pulvinar nuclei of the behaving rhesus monkey: visual responses and their modulation. J Neurophysiol 54: 867–886, 1985. [DOI] [PubMed] [Google Scholar]
- Piché M, Thomas S, Casanova C. Spatiotemporal profiles of neurons receptive fields in the cat posteromedial lateral suprasylvian cortex. Neuroscience 248: 319–332, 2013. [DOI] [PubMed] [Google Scholar]
- Rauschecker JP, von Grunau MW, Poulin C. Thalamo-cortical connections and their correlation with receptive field properties in the cat's lateral suprasylvian visual cortex. Exp Brain Res 67: 100–112, 1987. [DOI] [PubMed] [Google Scholar]
- Ringach DL, Hawken MJ, Shapley R. Dynamics of orientation tuning in macaque primary visual cortex. Nature 387: 281–284, 1997. [DOI] [PubMed] [Google Scholar]
- Sanchez CS, Vaingankar V, Wang X, Sommer FT, Hirsch JA. Visual responses of cells in the perigeniculate nucleus of the thalamus in the cat. San Diego, CA: Society for Neuroscience, 2007. [Google Scholar]
- Scannell JW, Burns GA, Hilgetag CC, O'Neil MA, Young MP. The connectional organization of the cortico-thalamic system of the cat. Cereb Cortex 9: 277–299, 1999. [DOI] [PubMed] [Google Scholar]
- Sherman SM. The thalamus is more than just a relay. Curr Opin Neurobiol 17: 417–422, 2007. [DOI] [PMC free article] [PubMed] [Google Scholar]
- Sherman SM, Guillery RW. The role of the thalamus in the flow of information to the cortex. Phil Trans R Soc Lond Ser B Biol Sci 357: 1695–1708, 2002. [DOI] [PMC free article] [PubMed] [Google Scholar]
- Skottun BC, De Valois RL, Grosof DH, Movshon JA, Albrecht DG, Bonds AB. Classifying simple and complex cells on the basis of response modulation. Vision Res 31: 1079–1086, 1991. [DOI] [PubMed] [Google Scholar]
- Sterling P, Wickelgren BG. Visual receptive fields in the superior colliculus of the cat. J Neurophysiol 32: 1–15, 1969. [DOI] [PubMed] [Google Scholar]
- Updyke BV. Topographic organization of the projections from cortical areas 17, 18 and 19 onto the thalamus, pretectum and superior colliculus in the cat. J Comp Neurol 173: 81–122, 1977. [DOI] [PubMed] [Google Scholar]
- Villeneuve MY, Casanova C. On the use of isoflurane versus halothane in the study of visual response properties of single cells in the primary visual cortex. J Neurosci Methods 129: 19–31, 2003. [DOI] [PubMed] [Google Scholar]
- Worgotter F, Suder K, Zhao Y, Kerscher N, Eysel UT, Funke K. State-dependent receptive-field restructuring in the visual cortex. Nature 396: 165–168, 1998. [DOI] [PubMed] [Google Scholar]
- Zabouri N, Ptito M, Casanova C. Complex motion sensitivity of neurons, in the visual part of the anterior ectosylvian cortex in cats. Neuroscience 152: 106–118, 2008. [DOI] [PubMed] [Google Scholar]


