

Abstract
PET/MRI represents a promising hybrid imaging modality with several potential clinical applications. Although PET/MRI seems highly attractive in the diagnostic approach of multiple myeloma (MM), its role has not yet been evaluated. The aims of this prospective study are to evaluate the feasibility of 18F-FDG PET/MRI in detection of MM lesions, and to investigate the reproducibility of bone marrow lesions detection and quantitative data of 18F-FDG uptake between the functional (PET) component of PET/CT and PET/MRI in MM patients. The study includes 30 MM patients. All patients initially underwent 18F-FDG PET/CT (60 min p.i.), followed by PET/MRI (120 min p.i.). PET/CT and PET/MRI data were assessed and compared based on qualitative (lesion detection) and quantitative (SUV) evaluation. The hybrid PET/MRI system provided good image quality in all cases without artefacts. PET/MRI identified 65 of the 69 lesions, which were detectable with PET/CT (94.2%). Quantitative PET evaluations showed the following mean values in MM lesions: SUVaverage=5.5 and SUVmax=7.9 for PET/CT; SUVaverage=3.9 and SUVmax=5.8 for PET/MRI. Both SUVaverage and SUVmax were significantly higher on PET/CT than on PET/MRI. Spearman correlation analysis demonstrated a strong correlation between both lesional SUVaverage (r=0.744) and lesional SUVmax (r=0.855) values derived from PET/CT and PET/MRI. Regarding detection of myeloma skeletal lesions, PET/MRI exhibited equivalent performance to PET/CT. In terms of tracer uptake quantitation, a significant correlation between the two techniques was demonstrated, despite the statistically significant differences in lesional SUVs between PET/CT and PET/MRI.
Keywords: Multiple myeloma, PET/CT, PET/MRI, SUV
Introduction
Multiple myeloma (MM) is a malignant hematologic disorder characterized by the clonal proliferation of plasma cells and infiltration of bone marrow. Bone involvement, mainly osteolytic disease or osteopenia, is the most common feature of MM. At initial diagnosis it is present in 80% of the patients [1-4]. In the recently published International Myeloma Working Group updated criteria for the diagnosis of MM one or more osteolytic lesions on skeletal radiography, CT, or PET/CT is accepted evidence for end organ damage [5]. However, given that the detection of lytic bone lesions requires a trabecular bone resorption by at least 30-50%, the application of other imaging modalities, detecting tumor burden before irreversible osseous changes take place, is needed [6].
18F-FDG PET/CT is a modality that is sensitive in detecting osseous lesions and can differentiate between active and inactive MM lesions, serving therefore as a powerful treatment response evaluation tool [3,7-11]. Moreover, focal lesions detected by PET/CT or MRI are of prognostic significance in all stages of monoclonal plasma cell disease [5,11,12]. However, to date, no routine use of 18F-FDG PET in MM outside of clinical trials is recommended [13,14].
PET/MRI represents a newly emerging hybrid technique, providing metabolic and anatomic information simultaneously. It is expected that the indications of this modality will be defined by the soft tissue contrast of MRI [15,16]. In a recent study, PET/MRI demonstrated high potential in the assessment of bone lesions and it offered higher lesion detectability and diagnostic confidence in comparison to PET/CT [17]. In this context, PET/MRI seems highly attractive in the diagnostic approach of MM.
The present study aims to evaluate the feasibility of 18F-FDG PET/MRI in detection of myeloma, and to investigate the reproducibility of lesion detection and quantitative data of 18F-FDG uptake between the functional (PET) component of PET/CT and PET/MRI in MM patients. The comparison between 18F-FDG PET with CT and MRI was not topic of this paper and will be evaluated separately.
Materials and methods
Patients
30 patients (19 male, 11 female; mean age 57.5 years) with MM based on the International Myeloma Working Group criteria were included in the study [2]. According to the Durie/Salmon staging system, eight patients were suffering from stage I, two patients from stage II and 20 patients from stage III MM. 17 patients were newly diagnosed and had received no previous treatment, while 13 patients had already undergone therapy. However, none of them had received chemotherapy within three months prior to the date of examination. The characteristics of the included patients are presented in Table 1. All patients gave written informed consent. The study was conducted in accordance to the declaration of Helsinki with institutional approval by the local ethics committee and the Federal Agency for Radiation Protection (Bundesamt für Strahlenschutz). Diabetics as well as patients presenting general contraindications for MRI (e.g. pacemaker) were excluded from the study.
Table 1.
Characteristics of the included MM patients
| Primary/Pre-treated | Durie/Salmon stage | Sex (M/F) | Age | 18F-FDG PET uptake pattern |
|---|---|---|---|---|
| Primary | I | M | 44 | focal |
| Primary | I | M | 64 | diffuse |
| Primary | I | F | 64 | diffuse |
| Primary | I | F | 53 | diffuse |
| Primary | I | M | 65 | diffuse |
| Primary | I | F | 47 | mixed |
| Primary | I | M | 60 | mixed |
| Primary | II | M | 55 | mixed |
| Primary | II | M | 66 | mixed |
| Primary | III | F | 72 | negative |
| Primary | III | M | 49 | focal |
| Primary | III | F | 53 | focal |
| Primary | III | M | 78 | mixed |
| Primary | III | F | 59 | mixed |
| Primary | III | M | 50 | mixed |
| Primary | III | F | 46 | mixed |
| Primary | III | M | 57 | mixed |
| Pre-treated | I | M | 58 | negative |
| Pre-treated | III | M | 38 | negative |
| Pre-treated | III | M | 65 | negative |
| Pre-treated | III | M | 72 | negative |
| Pre-treated | III | M | 54 | negative |
| Pre-treated | III | M | 55 | negative |
| Pre-treated | III | F | 60 | negative |
| Pre-treated | III | F | 47 | negative |
| Pre-treated | III | F | 42 | negative |
| Pre-treated | III | M | 70 | focal |
| Pre-treated | III | M | 73 | focal |
| Pre-treated | III | M | 45 | focal |
| Pre-treated | III | F | 68 | diffuse |
Data acquisition
PET/CT
PET/CT studies were performed 60 minutes post injection (p.i.) from the skull base to the knees with an image duration of two minutes per bed position for the emission scans. A dedicated PET/CT system (Biograph mCT, S128, Siemens Co., Erlangen, Germany) with an axial field of view of 21.6 cm with TruePoint and TrueV, operated in a three-dimensional mode was used. A low-dose attenuation CT (120 kV, 30 mA) was utilised for attenuation correction of the PET data and for image fusion. An image matrix of 400×400 pixels was used for iterative image reconstruction, which was based on the ordered subset expectation maximization algorithm (OSEM) with six iterations and twelve subsets. The reconstructed images were converted to SUV images based on the formula: SUV=tissue concentration (Bq/g)/(injected dose (Bq)/body weight (g)) [18].
PET/MRI
PET/MRI examinations were performed after the PET/CT studies (120 minutes p.i.). A hybrid PET/MRI system (Biograph mMR, Siemens Co., Erlangen, Germany) was used, consisting of a 3.0-T whole-body imager (length, 163 cm; bore size, 60 cm), an actively shielded whole-body gradient coil system (length, 159 cm; amplitude, 45 mT/M; slew rate, 200 T/m/s) and a radiofrequency body coil (peak power, 35 kW; transmitter bandwidth, 800 kHz) [19]. The PET detector contained eight rings of 56 detector blocks, while each detector block consisted of 64 lutetium oxyorthosilicate crystals (4×4×20 mm). The PET system has a transaxial field of view (FOV) of 59.4 cm and an axial FOV of 25.8 cm.
PET and MR data were acquired simultaneously. Static whole-body PET/MRI studies were performed without contrast agent from the skull to the mid thigh including coronal T1-weighted turbo-spin-echo, coronal T2-weighted turbo-inversion-recovery-magnitude, sagittal T1-weighted turbo-spin-echo plus T2-weighted turbo-spin-echo- sequences, as well as axial DWI.
PET data were reconstructed with an iterative 3-D OSEM algorithm with two iterations, 21 subsets and an image matrix of 172 pixels. During the PET acquisition a Dixon volume interpolated breath-hold examination (VIBE) sequence was performed and used for attenuation correction of the PET images. Both PET systems (from PET/CT and PET/MRI) are cross-calibrated by an activimeter.
Data analysis
Visual analysis was performed by evaluating the transaxial, coronal, and sagittal images of the patients by two nuclear medicine physicians.
Regarding PET/CT studies, skeletal foci presenting with significantly enhanced 18F-FDG uptake, for which another benign aetiology (trauma, inflammation, degenerative changes, arthritic disease etc.) was unlikely, were considered indicative for MM. Quantitative evaluation was performed through SUV calculations based on volumes of interest (VOIs), drawn with a 50% isocontour, placed over foci of increased tracer uptake. A reference SUV for each patient was acquired from the bone marrow of the os ilium that demonstrated no lesions.
Lesion characterization in PET/MRI was based only on functional (PET-part) and not morphological (MRI-part) criteria, since purpose of the present study was to compare the PET component of the PET/MRI exams to the PET component of the PET/CT exams. Similarly to PET/CT evaluation, sites of increased focal 18F-FDG accumulation, for which another benign aetiology was excluded, were considered MM-positive. The comparison with PET/CT included only the body areas examined by both imaging modalities (skull to mid-thigh). Furthermore, the SUVs of the myeloma indicative lesions depicted in PET/MRI (120 min p.i.) were compared to the SUVs derived from PET/CT (60 min p.i.). The same comparison was performed for the reference areas (os ilium).
Concerning the whole-body 18F-FDG distribution, four patterns of bone marrow tracer uptake were identified in PET/CT and PET/MRI scans: a) negative pattern with no pathological 18F-FDG bone marrow accumulation indicative for myeloma involvement, b) focal pattern, in which bone marrow foci of increased 18F-FDG uptake were detected and considered MM lesions, c) diffuse pattern, in which an intense, diffuse bone marrow tracer uptake was depicted (without focal lesions) and d) a mixed pattern, in which a diffuse bone marrow uptake was detected in addition to focal bone marrow lesions.
In particular, for the assessment of a diffuse pattern of bone marrow uptake, which was indicative for diffuse bone marrow infiltration, we used the maximum intensity projection (MIP) images.
Data were statistically evaluated using the STATA/SE 12.1 (StataCorp) software on an Intel Core (2 · 3.06 GHz, 4 GB RAM) running with Mac OS X 10.8.4 (Apple Inc., Cupertino, CA, USA). The statistical evaluation was performed using descriptive statistics, Wilcoxon matched-pairs signed rank test for non-normally distributed samples, and Spearman’s rank correlation analysis. The results were considered significant for p<0.01.
Results
PET/MRI images were of good diagnostic quality and without apparent image artefacts. Regarding 18F-FDG bone marrow uptake pattern, ten patients had a negative pattern, six patients demonstrated a focal pattern, five patients a diffuse pattern and nine patients a mixed pattern of tracer uptake in both modalities (Table 1). Figure 1 depicts one patient suffering from stage III MM, demonstrating a mixed pattern of 18F-FDG uptake in both PET/CT and PET/MRI.
Figure 1.

Multiple intensity projection (MIP) images of a 78-year old patient with newly diagnosed stage III MM, derived from PET/CT 60 min p.i. (left) and PET/MRI 120 min p.i. (right). The patient demonstrates intense diffuse 18F-FDG bone marrow uptake along the spinal column demonstrated with both PET/CT and PET/MRI. Moreover, a big focal lesion in the right os ilium that infiltrates the soft tissues is depicted with both techniques (arrow). Mixed pattern of 18F-FDG uptake. The values of the scale bar refer to g/ml. (Lt: lower threshold; Ut: upper threshold).
Table 2 demonstrates the results of visual analysis in terms of focal lesions detection with both techniques. In 15 of the 30 included patients suspected focal lesions were detected with both PET/CT and PET/MRI. All patients rated as PET-positive or PET-negative on PET/CT were also characterized as PET-positive or PET-negative on PET/MRI. A total of 69 myeloma indicative lesions were demonstrated with PET/CT. The PET part of PET/MRI revealed 65 of the 69 lesions, which were detectable with PET/CT (94.2%) (Figures 2, 3 and 4). Three of the focal lesions that were seen on PET/CT but not on PET/MRI were located in the ribs of two patients that were rated as PET-positive with both techniques (Figures 5, 6). One focal lesion was located in the os ilium of a patient, who demonstrated a mixed pattern of tracer uptake.
Table 2.
Results of visual analysis in terms of myeloma-indicative focal lesions detection
| Parameter | PET/CT | PET/MRI |
|---|---|---|
| No. of patients with focal lesions | 15 | 15 |
| Total no. of focal lesions | 69 | 65 |
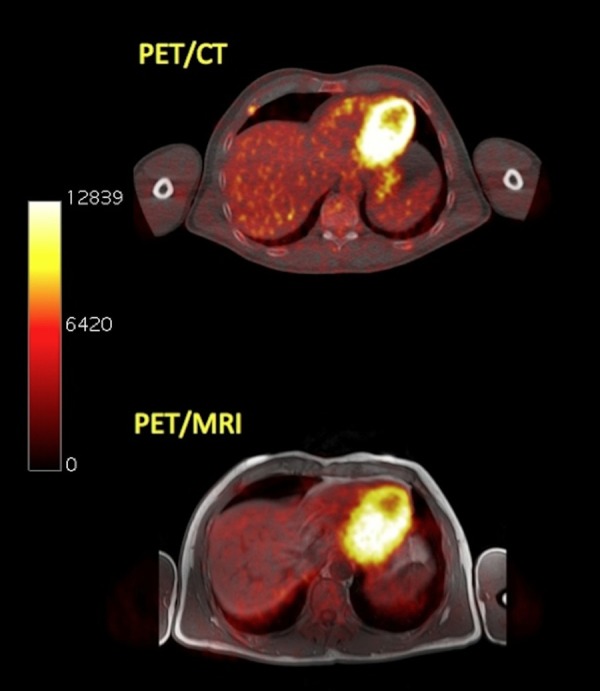
Figure 2.

Transaxial PET/CT (upper row) and PET/MRI (lower row) images of a MM patient referred to our department for initial evaluation of extent of bone involvement. A MM-suspicious lesion is depicted in the right iliac bone in both systems. The lesion has the following values in PET/CT: SUVaverage=5.5 and SUVmax=7.1. The respective SUVs in PET/MRI are: SUVaverage=4.2 and SUVmax=6.5. The values of the scale bar refer to Bq/ml.
Figure 3.

Transaxial PET/CT (upper row) and PET/MRI (lower row) images of the same patient as in Figure 2. The patient has a myeloma-indicative site of enhanced 18F-FDG uptake in the 7th thoracic vertebrae seen with both hybrid imaging systems. The lesion has the following values in PET/CT: SUVaverage=4.1 and SUVmax=6.7. The respective SUVs in PET/MRI are: SUVaverage=3.6 and SUVmax=5.9. The values of the scale bar refer to Bq/ml.
Figure 4.

Transaxial PET/CT (upper row) and PET/MRI (lower row) images of the same patient as in Figure 2. A MM-suspicious lesion is delineated in the 10th left rib dorsally involving the costovertebral joint (arrow). The lesion has the following values in PET/CT: SUVaverage=4.4 and SUVmax=6.9. The respective SUVs in PET/MRI are: SUVaverage=4.3 and SUVmax=7.1. The values of the scale bar refer to Bq/ml.
Figure 5.

Transaxial PET/CT (upper row) and PET/MRI (lower row) images of a pre-treated stage III MM patient. PET/CT reveals a myeloma-suspicious lesion in the 11th rib right dorsolaterally, while PET/MRI shows no pathological tracer uptake in the respective anatomical site. The values of the scale bar refer to Bq/ml.
Figure 6.
Transaxial PET/CT (upper row) and PET/MRI (lower row) images of a pre-treated stage III MM patient. On PET/CT a myeloma-suspicious lesion in the right 5th rib ventrally is depicted. PET/MRI shows no pathologically enhanced 18F-FDG uptake. Same patient as in Figure 5.
Quantitative evaluations through SUV calculations derived from VOIs drawn over MM lesions and reference bone marrow from the os ilium were performed. Tables 3, 4 demonstrate the results of SUV analysis for PET/CT and PET/MRI studies. According to Wilcoxon matched-pairs signed rank test, both SUVaverage (p<0.0001) and SUVmax (p<0.0001) derived from MM lesions were significantly higher on PET/CT than on PET/MRI. Similarly, statistically significant differences between PET/CT and PET/MRI regarding SUVaverage (p=0.0016) as well as SUVmax (p=0.0002) derived from reference bone marrow in os ilium were demonstrated.
Table 3.
Average and maximum SUVs of 18F-FDG in MM lesions and reference bone marrow, as derived from PET/CT studies (60 min p.i.)
| PET/CT (60 min p.i) | |||
|
| |||
| SUVaverage±SD | Median | Range | |
|
| |||
| MM lesions | 5.5±2.2 | 5.0 | 2.3-14.6 |
| Reference | 1.7±0.8 | 1.4 | 0.8-3.9 |
|
| |||
| SUVmax± SD | Median | Range | |
|
| |||
| MM lesions | 7.9±4.7 | 7.1 | 3.6-35.3 |
| Reference | 2.8±1.3 | 2.5 | 1.3-5.9 |
Table 4.
Average and maximum SUVs of 18F-FDG in MM lesions and reference bone marrow, as derived from PET/MRI studies (120 min p.i.)
| PET/MRI (120 min p.i) | |||
|
| |||
| SUVaverage±SD | Median | Range | |
|
| |||
| MM lesions | 3.9±2.1 | 3.6 | 0.9-11.8 |
| Reference | 1.4±0.7 | 1.4 | 0.5-3.4 |
|
| |||
| SUVmax±SD | Median | Range | |
|
| |||
| MM lesions | 5.8±3.9 | 5.3 | 1.0-24.8 |
| Reference | 2.2±1.0 | 2.1 | 0.8-4.7 |
Spearman correlation analysis demonstrated a statistically significant correlation (r=0.744, p<0.0001) between lesional SUVaverage values derived from PET/CT and PET/MRI (Figure 7). Respectively, a statistically significant correlation was exhibited between lesional SUVmax from PET/CT and PET/MRI (r=0.855, p<0.0001) (Figure 8). Regarding reference bone marrow, a very strong correlation for both SUVaverage (r=0.862, p<0.0001) and SUVmax (r=0.883, p<0.0001) derived from PET/CT and PET/MRI was also demonstrated.
Figure 7.

Scatter plot of the results of correlation analysis between lesional SUVaverage derived from PET/CT and PET/MRI (r=0.744, p<0.0001).
Figure 8.

Scatter plot of the results of correlation analysis between lesional SUVmax derived from PET/CT and PET/MRI (r=0.855, p<0.0001).
Discussion
In the last years the significance of 18F-FDG PET and PET/CT in evaluation of MM has increased. PET/CT is considered a modality of high sensitivity in detecting both medullary and extramedullary disease, while its ability in treatment response assessment and its prognostic value have been documented [3,7,11,20-22].
PET/MRI is a novel and promising imaging technique that has received a lot of interest. The first results from the application of PET/MRI in oncology are encouraging and comparable to those of PET/CT [23]. The modality may play a role in the diagnostics of MM, since it combines two modalities with a high potential in myeloma evaluation (PET and MRI) in a single exam. PET/MRI could be particularly useful in residual disease detection and consequently in treatment guidance in MM patients that have reached a complete remission [24].
We present the first results of an ongoing study aiming to assess the feasibility and image quality of 18F-FDG PET/MRI, as well as the reproducibility of detection of myeloma-suspicious lesion detection and quantification between the PET-component of PET/CT and PET/MRI in MM.
The hybrid PET/MRI system provided good image quality in all cases without artefacts. The results of our study demonstrated that 94.2% of all focal lesions depicted in the PET part of PET/CT were also seen in the PET part of PET/MRI, reflecting thus equivalent performance regarding qualitative lesions evaluation. In total, four lesions were not depicted on PET/MRI. This discrepancy, however, did not lead to a change in patient management. Three lesions that were not seen on PET/CT were located in the ribs of two patients and one lesion in the os ilium. One explanation for the non-depiction of the rib lesions might be the fact that in conventional MR sequences cortical bone offers only low signal intensity, rendering thus the separation of bone from air difficult [25]. Moreover, an underestimation of lesion radioactivity concentration by PET/MRI in comparison to PET/CT may have contributed to this mismatch, given that these lesions demonstrated a moderate 18F-FDG uptake in PET/CT. Regarding the focal pelvic lesion, which was not depicted in PET/MRI, it was surrounded by intense diffuse bone marrow infiltration in the os ilium. Subsequently, the initially enhanced FDG uptake in the lesion exhibited on PET/CT was masked 120 min p.i. by a generalized increased 18F-FDG activity in the surrounding bone marrow, rendering its clear delineation from surrounding bone marrow unfeasible. It could be presumed that obtaining PET/MRI images earlier (60 min p.i.) could further raise the detection rate of myeloma lesions with this novel hybrid technique.
Our results are in accordance with the findings of a similar study by Wiesmüller et al., in which the PET components of PET/CT and PET/MRI demonstrated equivalent performance in terms of lesion detection in a heterogeneous group of oncological patients, with 99.2% of all lesions found by PET/CT also found on PET/MRI [26].
Regarding quantitative evaluations, SUVaverage and SUVmax of myeloma lesions depicted on PET/MRI were significantly lower (p<0.0001) than the respective values on PET/CT. Similarly, the SUVs derived from reference bone marrow (os ilium) on PET/MRI were statistically significant lower than the respective PET/CT values.
These discrepancies, regarding quantitative estimations with PET/CT and PET/MRI, may be attributed to different factors, since SUV is affected by several parameters [27]. One reason for the SUV underestimation by PET/MRI, except from the different uptake due to the two different imaging time points [28] (60 min p.i. for PET/CT vs 120 min p.i. for PET/MRI), may be related to the different approaches used for attenuation correction (MR-based in PET/MRI and CT-based in PET/CT), since the standard methods used for MR-based attenuation correction do not account for the presence of bone tissue in the attenuation map [29]. Martinez-Möller et al. have shown in a group of 35 oncological patients that this absence of bone in the attenuation map resulted in an average SUVmax underestimation for osseous lesions of 8.0% [30]. Aznar et al. studied 20 oncological patients with PET/CT and PET/MRI and found that the application of standard MR-based attenuation correction in PET/MRI imaging led to an underestimation of PET uptake values in soft tissue and bone lesions by about 10% [31]. In an attempt to minimize the effect of bone neglecting in the attenuation map of MRI, Marshall et al. described an alternative combined technique for MR-based attenuation correction, which included the in MRI routinely applied four-tissue (air, lungs, soft tissue and fat) segmentation approach and a database of CT scans [32]. This approach led to an improvement of the relative error in VOIs adjacent to bone from a mean of -7.5% to 2% and reduced the magnitude of relative error in bone tissue from -14.6% to 1.3%.
Despite the differences in lesional SUVs between the two techniques, correlation analysis revealed a statistically significant correlation between lesional SUVaverage derived from PET/CT and PET/MRI (r=0.744, p<0.0001), as well as between lesional SUVmax derived from PET/CT and PET/MRI (r=0.855, p<0.0001). Moreover, the SUVs derived from reference bone marrow over the os ilium demonstrated a statistically significant correlation for both SUVaverage (r=0.862, p<0.001) and SUVmax (r=0.883, p<0.0001) for the two techniques. This correlation regarding SUVs from both lesions and reference tissue is in line with the results of a study by Drzezga et al., who also found a significant correlation between SUVs measured with PET/CT and PET/MRI for suspicious tumor lesions and background [33]. The authors implied that, despite the different technologies and attenuation correction approaches applied, this high correlation reflects the preservation of relative proportions of radiotracer in PET/MR, in comparison to PET/CT.
Our study carries some limitations. Since the number of patients studied was limited, these results should be considered as the preliminary results of an ongoing study. Another limitation of the study was the lack of histological confirmation of the 18F-FDG positive focal lesions. However, this remains impractical in clinical routine.
Conclusion
In the present study PET/MRI exhibited equivalent performance to PET/CT, in terms of detection of MM lesions. PET/CT detected four focal lesions not detected by PET/MRI. The differences in SUVs between PET/CT and PET/MRI were statistically significant, while a statistically significant correlation between the two techniques for SUVs derived from both MM lesions and reference bone marrow was demonstrated.
Disclosure of conflict of interest
None.
References
- 1.Kyle RA, Gertz MA, Witzig TE, Lust JA, Lacy MQ, Dispenzieri A, Fonseca R, Rajkumar SV, Offord JR, Larson DR, Plevak ME, Therneau TM, Greipp PR. Review of 1027 patients with newly diagnosed multiple myeloma. Mayo Clin Proc. 2003;78:21–33. doi: 10.4065/78.1.21. [DOI] [PubMed] [Google Scholar]
- 2.International Myeloma Working Group. Criteria for the classification of monoclonal gammopathies, multiple myeloma and related disorders: a report of the International Myeloma Working Group. Br J Haematol. 2003;121:749–757. [PubMed] [Google Scholar]
- 3.Zamagni E, Cavo M. The role of imaging techniques in the management of multiple myeloma. Br J Haematol. 2012;159:499–513. doi: 10.1111/bjh.12007. [DOI] [PubMed] [Google Scholar]
- 4.Palumbo A, Anderson K. Multiple myeloma. N Engl J Med. 2011;364:1046–1060. doi: 10.1056/NEJMra1011442. [DOI] [PubMed] [Google Scholar]
- 5.Rajkumar SV, Dimopoulos MA, Palumbo A, Blade J, Merlini G, Mateos MV, Kumar S, Hillengass J, Kastritis E, Richardson P, Landgren O, Paiva B, Dispenzieri A, Weiss B, LeLeu X, Zweegman S, Lonial S, Rosinol L, Zamagni E, Jagannath S, Sezer O, Kristinsson SY, Caers J, Usmani SZ, Lahuerta JJ, Johnsen HE, Beksac M, Cavo M, Goldschmidt H, Terpos E, Kyle RA, Anderson KC, Durie BG, Miguel JF. International Myeloma Working Group updated criteria for the diagnosis of multiple myeloma. Lancet Oncol. 2014;15:e538–e548. doi: 10.1016/S1470-2045(14)70442-5. [DOI] [PubMed] [Google Scholar]
- 6.Durie BG, Salmon SE. A clinical staging system for multiple myeloma. Correlation of measured myeloma cell mass with presenting clinical features, response to treatment, and survival. Cancer. 1975;36:842–854. doi: 10.1002/1097-0142(197509)36:3<842::aid-cncr2820360303>3.0.co;2-u. [DOI] [PubMed] [Google Scholar]
- 7.Bartel TB, Haessler J, Brown TL, Shaughnessy JD Jr, van Rhee F, Anaissie E, Alpe T, Angtuaco E, Walker R, Epstein J, Crowley J, Barlogie B. F18-fluorodeoxyglucose positron emission tomography in the context of other imaging techniques and prognostic factors in multiple myeloma. Blood. 2009;114:2068–2076. doi: 10.1182/blood-2009-03-213280. [DOI] [PMC free article] [PubMed] [Google Scholar]
- 8.Durie BG, Waxman AD, D’Agnolo A, Williams CM. Whole-body (18)F-FDG PET identifies highrisk myeloma. J Nucl Med. 2002;43:1457–1463. [PubMed] [Google Scholar]
- 9.Bredella MA, Steinbach L, Caputo G, Segall G, Hawkins R. Value of FDG PET in the assessment of patients with multiple myeloma. AJR Am J Roentgenol. 2005;184:1199–1204. doi: 10.2214/ajr.184.4.01841199. [DOI] [PubMed] [Google Scholar]
- 10.Durie BG. The role of anatomic and functional staging in myeloma: description of Durie/Salmon plus staging system. Eur J Cancer. 2006;42:1539–1543. doi: 10.1016/j.ejca.2005.11.037. [DOI] [PubMed] [Google Scholar]
- 11.Zamagni E, Patriarca F, Nanni C, Zannetti B, Englaro E, Pezzi A, Tacchetti P, Buttignol S, Perrone G, Brioli A, Pantani L, Terragna C, Carobolante F, Baccarani M, Fanin R, Fanti S, Cavo M. Prognostic relevance of 18-F FDG PET/CT in newly diagnosed multiple myeloma patients treated with up-front autologous transplantation. Blood. 2011;118:5989–5995. doi: 10.1182/blood-2011-06-361386. [DOI] [PubMed] [Google Scholar]
- 12.Hillengass J, Fechtner K, Weber MA, Bäuerle T, Ayyaz S, Heiss C, Hielscher T, Moehler TM, Egerer G, Neben K, Ho AD, Kauczor HU, Delorme S, Goldschmidt H. Prognostic significance of focal lesions in whole-body magnetic resonance imaging in patients with asymptomatic multiple myeloma. J. Clin. Oncol. 2010;28:1606–1610. doi: 10.1200/JCO.2009.25.5356. [DOI] [PubMed] [Google Scholar]
- 13.Bird JM, Owen RG, D’Sa S, Snowden JA, Pratt G, Ashcroft J, Yong K, Cook G, Feyler S, Davies F, Morgan G, Cavenagh J, Low E, Behrens J Haemato-oncology Task Force of British Committee for Standards in Haematology (BCSH) and UK Myeloma Forum. Guidelines for the diagnosis and management of multiple myeloma. Br J Haematol. 2011;154:32–75. doi: 10.1111/j.1365-2141.2011.08573.x. [DOI] [PubMed] [Google Scholar]
- 14.Dimopoulos M, Kyle R, Fermand JP, Rajkumar SV, San Miguel J, Chanan-Khan A, Ludwig H, Joshua D, Mehta J, Gertz M, Avet-Loiseau H, Beksaç M, Anderson KC, Moreau P, Singhal S, Goldschmidt H, Boccadoro M, Kumar S, Giralt S, Munshi NC, Jagannath S International Myeloma Workshop Consensus Panel. Consensus recommendations for standard investigative workup: report of the International Myeloma Workshop Consensus Panel 3. Blood. 2011;117:4701–4705. doi: 10.1182/blood-2010-10-299529. [DOI] [PubMed] [Google Scholar]
- 15.Buchbender C, Heusner TA, Lauenstein TC, Bockisch A, Antoch G. Oncologic PET/MRI, part 1: tumors of the brain, head and neck, chest, abdomen, and pelvis. J Nucl Med. 2012;53:928–938. doi: 10.2967/jnumed.112.105338. [DOI] [PubMed] [Google Scholar]
- 16.Buchbender C, Heusner TA, Lauenstein TC, Bockisch A, Antoch G. Oncologic PET/MRI, part 2:bone tumors, soft-tissue tumors, melanoma, and lymphoma. J Nucl Med. 2012;53:1244–1252. doi: 10.2967/jnumed.112.109306. [DOI] [PubMed] [Google Scholar]
- 17.Beiderwellen K, Huebner M, Heusch P, Grueneisen J, Ruhlmann V, Nensa F, Kuehl H, Umutlu L, Rosenbaum-Krumme S, Lauenstein TC. Whole-body [¹⁸F] FDG PET/MRI vs. PET/CT in the assessment of bone lesions in oncological patients: initial results. Eur Radiol. 2014;24:2023–2030. doi: 10.1007/s00330-014-3229-3. [DOI] [PubMed] [Google Scholar]
- 18.Strauss LG, Conti PS. The applications of PET in clinical oncology. J Nucl Med. 1991;32:623–648. [PubMed] [Google Scholar]
- 19.Delso G, Fürst S, Jakoby B, Ladebeck R, Ganter C, Nekolla SG, Schwaiger M, Ziegler SI. Performance measurements of the Siemens mMR integrated whole-body PET/MR scanner. J Nucl Med. 2011;52:1914–1922. doi: 10.2967/jnumed.111.092726. [DOI] [PubMed] [Google Scholar]
- 20.Derlin T, Bannas P. Imaging of multiple myeloma: Current concepts. World J Orthop. 2014;5:272–282. doi: 10.5312/wjo.v5.i3.272. [DOI] [PMC free article] [PubMed] [Google Scholar]
- 21.Fonti R, Larobina M, Del Vecchio S, De Luca S, Fabbricini R, Catalano L, Pane F, Salvatore M, Pace L. Metabolic tumor volume assessed by 18F-FDG PET/CT for the prediction of outcome in patients with multiple myeloma. J Nucl Med. 2012;53:1829–1835. doi: 10.2967/jnumed.112.106500. [DOI] [PubMed] [Google Scholar]
- 22.Dimitrakopoulou-Strauss A, Hoffmann M, Bergner R, Uppenkamp M, Haberkorn U, Strauss LG. Prediction of progression-free survival in patients with multiple myeloma following anthracycline-based chemotherapy based on dynamic FDG-PET. Clin Nucl Med. 2009;34:576–584. doi: 10.1097/RLU.0b013e3181b06bc5. [DOI] [PubMed] [Google Scholar]
- 23.Fraioli F, Punwani S. Clinical and research applications of simultaneous positron emission tomography and MRI. Br J Radiol. 2014;87:20130464. doi: 10.1259/bjr.20130464. [DOI] [PMC free article] [PubMed] [Google Scholar]
- 24.Dimopoulos MA, Hillengass J, Usmani S, Zamagni E, Lentzsch S, Davies FE, Raje N, Sezer O, Zweegman S, Shah J, Badros A, Shimizu K, Moreau P, Chim CS, Lahuerta JJ, Hou J, Jurczyszyn A, Goldschmidt H, Sonneveld P, Palumbo A, Ludwig H, Cavo M, Barlogie B, Anderson K, Roodman GD, Rajkumar SV, Durie BG, Terpos E. Role of Magnetic Resonance Imaging in the Management of Patients With Multiple Myeloma: A Consensus Statement. J. Clin. Oncol. 2015;33:657–64. doi: 10.1200/JCO.2014.57.9961. [DOI] [PubMed] [Google Scholar]
- 25.Schwenzer NF, Schmidt H, Claussen CD. Workflow and practical logistics. In: Carrio I, Ros P, editors. PET/MRI. Berlin Heidelberg: Springer-Verlag; 2014. pp. 43–53. [Google Scholar]
- 26.Wiesmüller M, Quick HH, Navalpakkam B, Lell MM, Uder M, Ritt P, Schmidt D, Beck M, Kuwert T, von Gall CC. Comparison of lesion detection and quantitation of tracer uptake between PET from a simultaneously acquiring whole-body PET/MR hybrid scanner and PET from PET/CT. Eur J Nucl Med Mol Imaging. 2013;40:12–21. doi: 10.1007/s00259-012-2249-y. [DOI] [PubMed] [Google Scholar]
- 27.Vriens D, Visser EP, de Geus-Oei LF, Oyen WJ. Methodological considerations in quantification of oncological FDG PET studies. Eur J Nucl Med Mol Imaging. 2010;37:1408–1425. doi: 10.1007/s00259-009-1306-7. [DOI] [PMC free article] [PubMed] [Google Scholar]
- 28.Bailey DL, Antoch G, Bartenstein P, Barthel H, Beer AJ, Bisdas S, Bluemke DA, Boellaard R, Claussen CD, Franzius C, Hacker M, Hricak H, la Fougère C, Gückel B, Nekolla SG, Pichler BJ, Purz S, Quick HH, Sabri O, Sattler B, Schäfer J, Schmidt H, van den Hoff J, Voss S, Weber W, Wehrl HF, Beyer T. Combined PET/MR: The Real Work Has Just Started. Summary Report of the Third International Workshop on PET/MR Imaging; February 17-21, 2014, Tübingen, Germany. Mol Imaging Biol. 2015;17:297–312. doi: 10.1007/s11307-014-0818-0. [DOI] [PMC free article] [PubMed] [Google Scholar]
- 29.Keller SH, Hansen AE, Holm S, Beyer T. Image distortions in clinical PET/MR imaging. In: Carrio I, Ros P, editors. PET/MRI. Berlin Heidelberg: Springer-Verlag; 2014. pp. 21–43. [Google Scholar]
- 30.Martinez-Möller A, Souvatzoglou M, Delso G, Bundschuh RA, Chefd’hotel C, Ziegler SI, Navab N, Schwaiger M, Nekolla SG. Tissue classification as a potential approach for attenuation correction in whole-body PET/MRI: evaluation with PET/CT data. J Nucl Med. 2009;50:520–526. doi: 10.2967/jnumed.108.054726. [DOI] [PubMed] [Google Scholar]
- 31.Aznar MC, Sersar R, Saabye J, Ladefoged CN, Andersen FL, Rasmussen JH, Löfgren J, Beyer T. Whole-body PET/MRI: the effect of bone attenuation during MR-based attenuation correction in oncology imaging. Eur J Radiol. 2014;83:1177–1183. doi: 10.1016/j.ejrad.2014.03.022. [DOI] [PubMed] [Google Scholar]
- 32.Marshall HR, Patrick J, Laidley D, Prato FS, Butler J, Théberge J, Thompson RT, Stodilka RZ. Description and assessment of a registrationbased approach to include bones for attenuation correction of whole-body PET/MRI. Med Phys. 2013;40:082509. doi: 10.1118/1.4816301. [DOI] [PubMed] [Google Scholar]
- 33.Drzezga A, Souvatzoglou M, Eiber M, Beer AJ, Fürst S, Martinez-Möller A, Nekolla SG, Ziegler S, Ganter C, Rummeny EJ, Schwaiger M. First clinical experience with integrated whole-body PET/MR: comparison to PET/CT in patients with oncologic diagnoses. J Nucl Med. 2012;53:845–855. doi: 10.2967/jnumed.111.098608. [DOI] [PubMed] [Google Scholar]