

Abstract
Treatment with ionizing irradiation (IR) may lead to accumulation of tumor-infiltrating T regulatory (Treg) cells and subsequent tumor resistance to radiotherapy. Here we focused on the contribution of the epidermal mononuclear phagocytes, Langerhans cells (LCs), to this phenomenon because of their ability to resist depletion by high-dose IR. We found that LCs resisted apoptosis and rapidly repaired DNA damage post-IR. Particularly, we found that CDKN1A (cyclin-dependent kinase inhibitor 1A, also known as p21) was overexpressed in LCs, and that Cdkn1a−/− LCs underwent apoptosis and accumulated DNA damage following IR treatment. Wild-type, but not Cdkn1a−/−, LCs up-regulated major histocompatibility complex class II molecules, migrated to the draining lymph nodes and increased Treg cell numbers upon exposure to IR. These findings suggest a means for manipulating LC IR-resistance to increase cutaneous tumor response to radiotherapy.
INTRODUCTION
Ionizing radiation (IR) is a powerful therapeutic arm used to eliminate tumor mass and many efforts have been devoted to understanding the molecular events leading to IR-resistance in cancer cells1. DNA double-strand breaks (DSBs) are the most cytotoxic type of DNA lesion induced upon cell exposure to IR. DSB formation triggers a global DNA damage response that culminates in the phosphorylation of numerous substrates in the surrounding chromatin including that of the histone variant H2AX (γ-H2AX). These DNA modifications facilitate the recruitment of DNA damage response (DDR) proteins that include: a) cell cycle checkpoint inhibitors to halt further accumulation of damage; b) nucleases and polymerases to directly excise and repair damaged DNA; and c) an array of anti-apoptotic molecules to allow adequate time for repair and survival post-IR1. Several mechanisms have been shown to promote tumor resistance to IR-induced cell death that include enrichment of genes involved in the neutralization of molecular free oxygen by the transcription factor NFE2L2, increased TRP53 checkpoint activation, enhanced DNA damage repair genes and non-homologous DNA repair, and increased anti-apoptotic molecules such as BID, BAK, and BCL-xL1.
Although radiotherapy is classically predicated upon direct anti-tumor toxicity2, an emerging body of evidence suggests that IR can promote anti-tumor immune responses by the release of tumor antigens, activation of antigen-presenting cells (APCs) and T cell polarization3–6. Such findings are consistent with the recent success of checkpoint blockade inhibitors in improving adaptive immune responses induced by the IR-mediated increased of tumor antigens4,7,8. Contrasting these observations, several studies have reported that IR also leads to accumulation of tumor-infiltrating T regulatory (Treg) cells that can dampen anti-tumor immunity2,9. Thus, the potential use of radiotherapy as part of a tumor immunotherapy regimen needs to take into account the effect of IR-induced tumor-protective Treg cells10.
Langerhans cells (LCs) are a largely quiescent subset of mononuclear phagocyte (MP) that populates the epidermis. LCs share features of dendritic cells (DC) and macrophages11 and, similar to macrophages, they are recruited to the skin during embryogenesis and self renew locally, independently of circulating precursors, throughout life12. Although macrophages are amongst the most resistant hematopoietic cells to ionizing radiation, LCs are on the extreme of the spectrum as they can resist very high dose IR13. A clinically relevant consequence of LC IR-resistance is graft-versus-host disease that occurs following hematopoietic stem cell transplantation14, whereby recipient LCs surviving irradiation continue to present host antigens to allogeneic T cells and thereby exacerbate allogeneic rejection by donor T cells. These observations suggest that LCs are able to present host antigens, prime and expand allogeneic effector T cells in vivo despite prior exposure to lethal IR doses. The mechanisms responsible for LC IR-resistance, however, have not yet been elucidated.
The ability of LCs to resist high-dose IR suggests their potential contribution to the modulation of T cell responses in IR-treated cutaneous tumors. However, a correlation between LC radio-resistance and the outcome in tumor growth has not been shown. Importantly, a comprehensive study of the molecular and cellular mechanisms conferring IR-resistance to LCs has never been undertaken15. It is possible that the unique ontogeny and homeostasis of the LC compartment may contribute to their underlying IR-resistance mechanisms and may even suggest mechanisms utilized by other lineages13,15. Hence, understanding the mechanisms promoting LC IR-resistance may have diverse implications on the identification of unique molecular events modulating IR-induced immune responses in macrophages and other systems.
In this study, we sought to examine the phenomenon of LC IR-resistance at the cellular and molecular level. By utilizing a combination of DNA damage and proliferation assays, radiation chimeras, antigen targeting, and adoptive transfer strategies, we show that LCs resisted depletion and damage by IR based on LC-intrinsic expression of cyclin-dependent kinase inhibitor 1A (CDKN1A) also known as p21. We also demonstrate that IR potentiated LC-mediated generation of Treg cells, and that Treg cell accumulation was directly correlated with skin tumor growth.
RESULTS
LCs resist apoptosis after IR exposure
To examine mechanisms of IR resistance, we generated bone marrow (BM) chimeric animals by reconstituting IR animals with donor-derived BM cell isolated from congenic mice and confirmed that epidermal LCs remain exclusively of host origin for prolonged periods of time after IR13 (Fig. 1a). We then analyzed the single-cell dynamics of LCs following exposure to IR. In contrast to dermal dendritic cells (DC), LC numbers, although reduced, were never fully depleted from the skin and started to repopulate the epidermal niche around 10 d after IR (Fig. 1b,c). Moreover, these changes were accompanied by a robust migration of both LCs and dermal DCs to the skin-draining lymph nodes (sdLNs) at 1–3 d after IR (Fig. 1d). We have observed that DC kinetics after IR were dose-independent in the range of 6–12 Gy (Supplementary Fig. 1a), in line with previous reports16,17.
Figure 1. LCs resisted apoptosis after IR exposure.
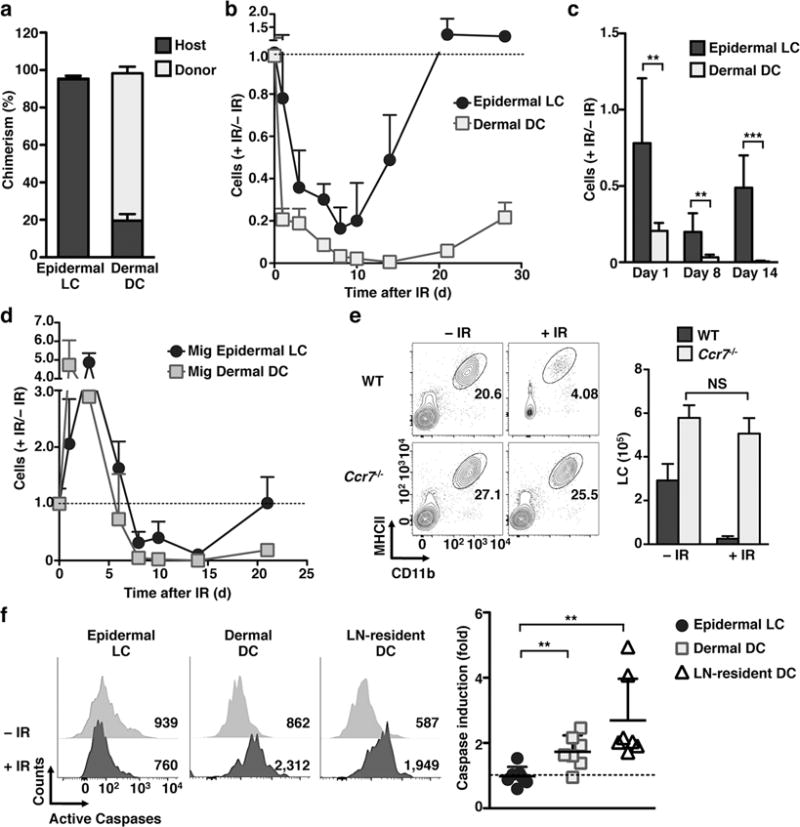
(a–d) Lethally irradiated (12Gy) CD45.1 mice were injected with BM from CD45.2 mice. (a) 2 months after IR the frequency of CD45.1 (host) or CD45.2 (donor) markers was analyzed in ear skin epidermal LCs and dermal DCs by flow cytometry. (b) Kinetic of the absolute number of CD45.1 epidermal LCs and dermal DCs in ear skin is shown relative to the absolute number of cells before irradiation. (c) As in b, but graph compared the relative numbers of cells at the representative time points after IR-treatment. (d) As in b, but the absolute numbers of CD45.1 migratory (mig) LCs and mig dermal DCs were calculated in the inguinal sdLN. (e) WT and Ccr7−/− mice were exposed to 6 Gy IR. The absolute number of epidermal LCs 96 h later (shown as the mean +/− SD in the right panel) was calculated based on the total number of cells in the ear skin and LC frequencies obtained by flow cytometry (left). (f) WT mice were treated with 6 Gy, and the activation of caspases was evaluated 24 h later by Z-VAD-FMK FACS staining. Left panels show the median fluorescence intensity (MFI) of ear skin epidermal LCs and dermal DCs, and inguinal LN-resident DCs. Right graph shows the fold induction of caspases calculated as the MFI of IR-treated mice versus non-treated controls. For (a) n=3 mice/group in 2 independent experiments. For other data sets n≥3 mice/group/time point in 2–3 independent experiments. Data are shown as mean +/− SD. p values of ≤0.01 are labeled as ** and p≤0.001 as ***.
Changes in epidermal LC density may be attributed to IR-induced apoptosis, migration to the sdLNs, or to a combination of both. To distinguish between these mechanisms we utilized mice deficient in the chemokine receptor CCR7, a molecule required for LC migration to the sdLNs18. We found that, whereas wild-type (WT) LCs showed the predicted decrease in absolute numbers in the epidermis, the number of epidermal Ccr7−/− LCs were unaffected by 6 Gy IR (Fig. 1e). The persistence of Ccr7−/− LCs in the epidermis suggests that diminished numbers of epidermal LCs observed upon exposure to IR might be due to migration rather than cell death. Flow cytometric analysis revealed a two-fold increase of activated caspases in dermal DCs compared to LCs, suggesting that dermal DCs, but not LCs, undergo apoptosis following IR (Fig. 1f). The activation of caspases after IR was also true for LN-resident DCs (Fig. 1f). Altogether these results suggest that LCs resisted apoptosis following IR exposure and that changes in LC absolute numbers observed upon IR exposure can be attributed to LC migration to the sdLNs.
LCs rapidly repair IR-induced double strand breaks
Among the many types of IR-induced damage, DNA DSBs are the most researched. DSBs are sensed and subsequently phosphorylated at the histone variant H2AX leading to the formation of γ-H2AX foci spanning the DSBs19. We hypothesized that LCs exhibit enhanced handling of genotoxic stress-induced DSBs. We therefore quantified by flow cytometry the accumulation of γ-H2AX foci in LCs and IR-sensitive DCs 24 h after IR. We found that LCs resisted the accumulation of DSBs as indicated by a near absence of γ-H2AX foci in their nuclei 24 h after 6 Gy (Fig. 2a) or 12 Gy (Supplementary Fig. 1b) IR-treatment. This result does not preclude, however, that the failure to accumulate γ-H2AX in LCs was due to an impaired ability to sense DSBs20,21. We therefore incorporated the COMET assay into our analysis, an unbiased single-cell electrophoresis-based method of measuring DNA damage20. In response to escalating doses of IR treatment, LCs exhibited the least amount of DNA damage in the COMET assay versus both dermal DCs and LN-resident DCs, indicating that LCs alone are resistant to IR-induced genotoxic stress and DSBs (Fig. 2b,c). Importantly, and as previously suggested16, different doses of IR treatment did not increase DNA damage measured by the COMET assay or the presence of γ-H2AX foci (Fig. 2c and Supplementary Fig. 1c).
Figure 2. LCs rapidly repaired IR-induced double strand breaks.

(a) Representative histograms and scatter plot of γ-H2AX in epidermal LCs, dermal DCs, and LN resident DCs as assessed by flow cytometry 24 h following 6 Gy IR. (b–c) Representative COMET (b) and compiled graph (c) of DNA damage induced by different doses of IR in skin epidermal LCs, dermal DCs, and sdLN resident DCs, 24 h after IR. (d–e) Epidermal cell suspensions were generated by enzymatic digestion and put into culture +/− 6 Gy IR for the indicated times and analyzed for the expression of γ-H2AX by flow cytometry (d) and for induction of DNA damage using the COMET assay (e). Data are representative of at least two independent experiments, n=3 mice per group/time point. Data are shown as Mean +/− SD. COMET data are displayed as Mean +/− SEM of one representative experiment of n=2 mice. p values of ≤0.05 are labeled as * and p≤0.001 as ***.
Due to the absence of detectable DSBs in LCs after IR, we asked whether the repair kinetics of induced DSBs were too rapid to be detected following whole-mouse irradiation and subsequent prolonged skin enzymatic digestion for flow cytometry analysis. We therefore adopted an ex vivo system in which epidermal cell suspensions were generated first, treated with 6 Gy IR, and kept in culture for the indicated times before fixation and staining for γ-H2AX expression or assessed for DNA integrity via COMET. Under these conditions we were able to detect the rapid induction and subsequent repair of DSBs by epidermal LCs (Fig. 2d,e).
We further expanded this analysis to demonstrate that Ccr7−/− LCs were phenotypically identical to WT LCs, in that they rapidly repaired γ-H2AX foci within 2 h in cell culture, and that γ-H2AX foci were virtually absent by 24 h following whole-animal irradiation (Supplementary Fig. 2a). Further, no significant difference between WT and Ccr7−/− LCs was detected by analysis of DNA damage by COMET assay (Supplementary Fig. 2b).
Finally, we evaluated if epidermal LCs were also able to resist DNA damage induced either by ultraviolet light (UV) or by the DNA-damaging agent cisplatin. In accordance with previous reports22, UV exposure failed to induce γ-H2AX up-regulation at any time point (Supplementary Fig. 2c). Conversely, cisplatin, a widely used anti-neoplastic agent for solid tumors, induced rapid DNA damage in epidermal LCs that could not be repaired by 24 h (Supplementary Fig. 2c). Altogether these data establish that LCs have a robust ability to rapidly repair DNA DSBs, a property that may contribute to their enhanced survival post-IR treatment.
LCs overexpress Cdkn1a and pro-survival genes
To identify potential molecular mediators that enable LCs to withstand IR, we performed gene expression profiling of epidermal LCs, LN migratory (mig) LCs and LN-resident DCs (Fig. 3a). We found that LCs expressed a pro-survival gene signature in both the steady state and after IR. In particular, we noticed that the expression of the gene Cdkn1a was highest in LCs as compared to all other hematopoietic and precursor cell populations (Fig. 3b) and that this expression was further increased following IR exposure at the RNA and protein level (Fig. 3a,c). Given the known roles of CDKN1A in the cellular stress response, DNA DSB repair, and IR-resistance, we chose to further analyze the role of this molecule in LC IR-resistance23–26. Consequently, we repeated our initial experiments comparing Cdkn1a−/− to WT mice (Fig. 3d). Consistent with our hypothesis, LCs were significantly reduced from Cdkn1a−/− mice 3 d after IR. Moreover, unlike WT LC, Cdkn1a−/− LCs showed a significant increase in caspase activation 24 h after IR, indicating that Cdkn1a−/− LCs were sensitive to IR-induced apoptosis (Fig. 3e).
Figure 3. LCs overexpressed Cdkn1a and pro-survival genes.
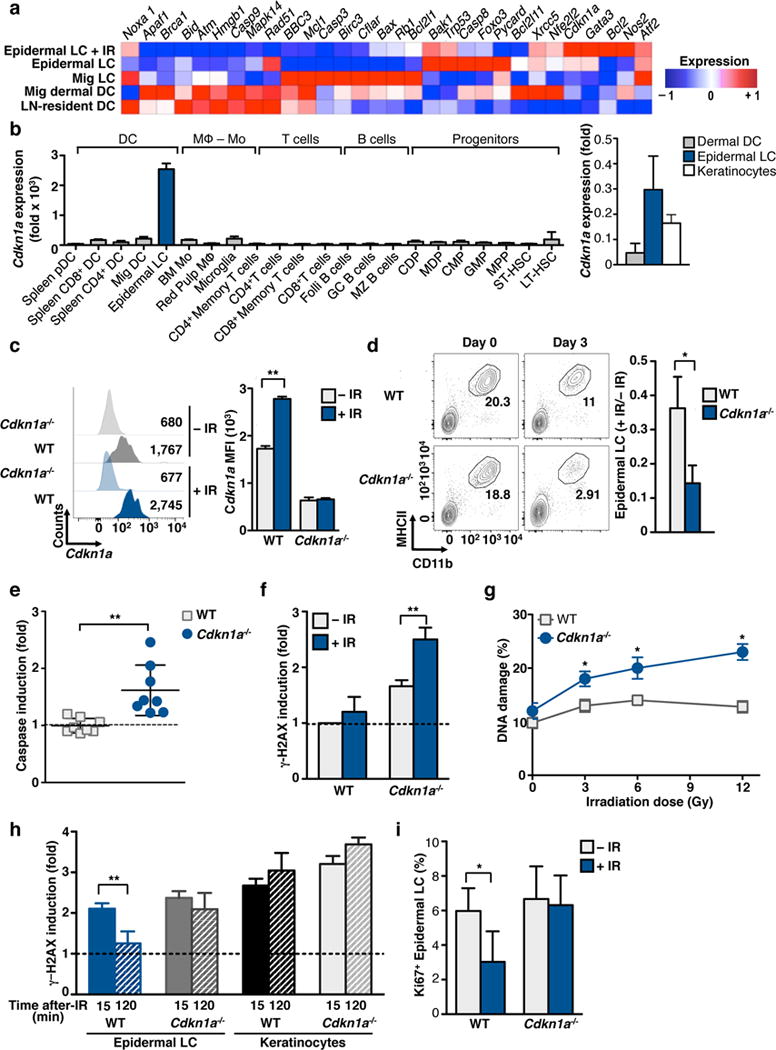
(a) Mice were exposed to 12 Gy and epidermal LCs were flow-sorted 24 h later. RNA was processed following ImmGen SOP. The heat map was generated using GenePattern. (b) Analysis of ImmGen mRNA expression data for the Cdkn1a gene across myeloid cells and precursors without IR-treatment. Right graph shows QPCR validation of flow-purified epidermal LCs, dermal DCs and keratinocytes. (c–e) WT or Cdkn1a−/− mice were exposed to 6 Gy IR. (c) CDKN1A protein levels were evaluated 48 h after IR by flow cytometry (left) and is shown as the mean MFI +/− SD (right). (d) Absolute numbers of LCs 3 d after IR were calculated based on the number of cells in ear skin and LC frequencies obtained by flow cytometry (left). Right panel shows the number of LCs 3 d after IR relative to the number of non-irradiated cells. (e–f) Induction of caspases (e) and γ-H2AX (f) was assessed 24 h after IR by flow cytometry. (g) Epidermal LCs were flow-purified from WT or Cdkn1a−/− mice 24 h after IR at the indicated doses. Cells were subjected to the COMET assay and % DNA damage analyzed. (h) Epidermis was digested, 6 Gy IR-treated, cultured for the indicated time points and analyzed by flow cytometry for γ-H2AX. (i) Frequency of Ki67+ LC was assessed in WT and Cdkn1a−/− mice at 24 h after IR. Data are representative of at least two independent experiments, n≥3 mice per group, and is shown as Mean +/− SD or SEM (for COMET). p values of ≤0.05 are labeled * and p≤0.01 as **.
We further evaluated whether Cdkn1a−/− LCs accumulated DSBs in response to IR. We therefore IR-treated both WT and Cdkn1a−/− mice and analyzed 24 h later the accumulation of DSBs by both γ-H2AX and COMET assays. Cdkn1a−/− LCs showed an enhanced sensitivity to IR and a significant accumulation of DSBs as demonstrated by both assays (Fig. 3f,g). Furthermore, in contrast to WT LC, DSBs in Cdkn1a−/− LC suspensions were not repaired shortly after irradiation (Fig. 3h). The increased amount of DNA DSBs in Cdkn1a−/− LCs strongly suggests the contribution of this protein to the greater viability of LCs after IR.
CDKN1A is a known cell cycle regulator and exercises strict control over the G1S checkpoint23. Moreover, as LCs renew locally in the steady state it is possible that the heightened sensitivity of Cdkn1a−/− LCs to IR is due to a significantly higher fraction of cycling cells. To test this hypothesis we assessed LC cycling after IR by the proportion of LCs expressing Ki67 following IR exposure (Fig. 3i). Analysis revealed that both WT and Cdkn1a−/− LCs share approximately the same basal level of proliferation, with approximately 5% of LCs in cycle. Yet, Cdkn1a−/− LCs failed to undergo transient cell cycle arrest 1 d after IR whereas WT LCs reduced cycling by ~50%. These data not only suggest that the differences in IR-sensitivity between WT and Cdkn1a−/− LCs are independent of quiescent status, but also that Cdkn1a−/− LCs fail to engage proper cell cycle checkpoints following DSBs accumulation.
Ontogenically distinct LC differ in IR-sensitivity
LCs derive from embryonic precursors that take up residence in the skin prior to birth, whereas dermal DCs derive from DC-restricted precursors that arise in the BM during adult life13. In addition, recent results have identified a small population of BM-derived LC-like cells in the epidermis, thought to derive from circulating monocytes27. Since monocyte- and embryonic- derived LCs populate the same tissue and are exposed to the same tissue environment, comparing their radio-sensitivity should elucidate the contribution of epidermal versus cell-intrinsic cues to LC IR-resistance. We observed that monocyte-derived LCs (monocytic LCs) characterized as MHCII+CD11b+EpCAM−27, expressed lower amounts of CDKN1A compared to embryonic-derived LCs (embryonic LCs)(Fig. 4a) and accumulated high frequencies of DSBs upon exposure to IR (Fig. 4b,c). These findings show that monocytic LCs exhibit higher radio-sensitivity compared to embryonic LCs.
Figure 4. Ontogenically distinct LCs differed in IR-sensitivity.
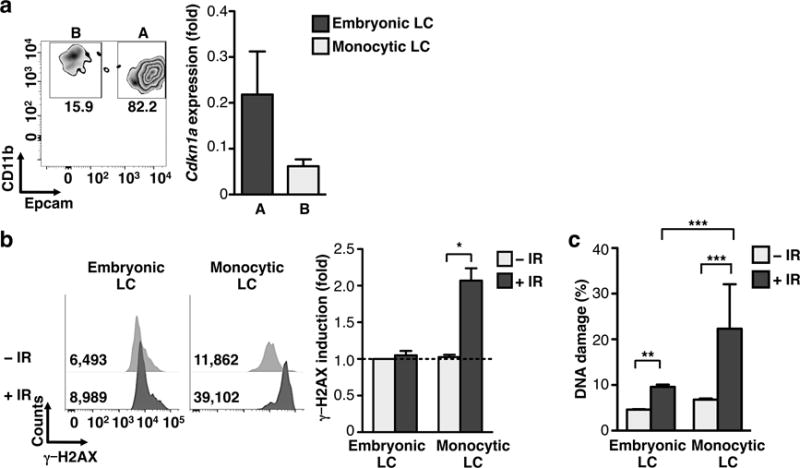
(a) Gating strategy for differentiating EpCAMhi (embryonic derived) vs. EpCAMlo (monocyte) LC subsets (left) and representative QPCR validation of relative expression Cdkn1a gene in LC subsets (right). (b) Bar graph for flow cytometry analysis of γ-H2AX 24 h post 6 Gy IR in embryonic and monocyte LCs. (c) COMET assay of LC subsets +/− IR as in (b). Data are representative of two–three independent experiments, n=3–4 mice per group. Data are shown as Mean +/− SD or SEM (for COMET). p values of ≤0.05 are labeled *, p≤0.01 as **, and p≤0.001 as ***.
Up- and down- stream Cdkn1a mediators affect LC IR sensitivity
In addition to CDKN1A, members of the CDKN1A signaling pathway also have a role in IR-resistance28. We first focused on two candidates that were expressed in steady state LCs at the RNA level: TRP53 (transformation related protein 53, also known as p53), which functions up-stream of CDKN1A, and NFE2L2 (nuclear factor (erythroid-derived 2)-like 2, also known as NRF2), which functions down-stream of CDKN1A (Fig. 3a). Trp53 transcripts decreased whereas Nfe2l2 transcripts increased after IR when compared to their steady state expression values. In accordance with the microarray data, Trp53−/− LCs were able to significantly repair DNA measured by the frequency of γ-H2AX foci (Fig. 5a,b) and the COMET assay (Fig. 5c,d). DNA repair, however, did not seem to be complete and failed to resolve to the same level as that seen in WT LCs (Fig. 5d). Thus, these findings suggest a partial role for TRP53 in mediating LC IR-resistance. Indeed, we did not detect significant differences in the Cdkn1a mRNA level and CDKN1A protein between Trp53−/− and WT mice (Supplementary Fig. 3a,b), suggesting that a different pathway, independent of TRP53, modulates Cdkn1a expression and consequently mediates LC IR-resistance.
Figure 5. Up- and down- stream p21 mediators affected LC IR sensitivity.
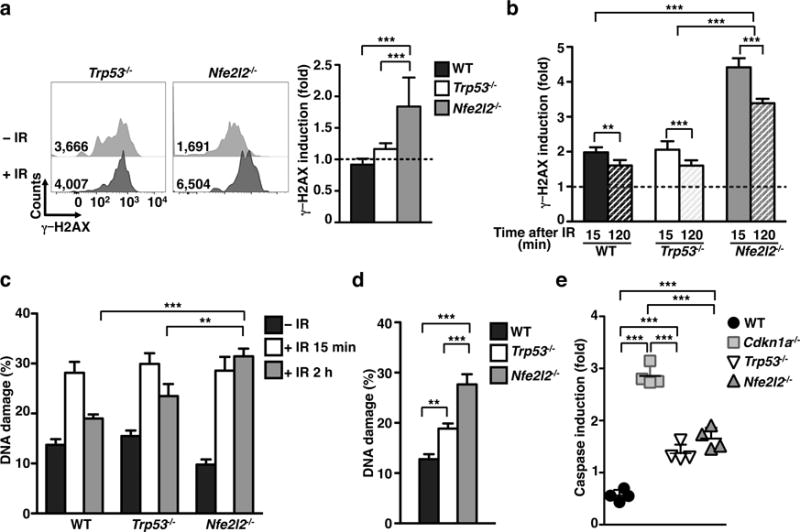
(a) Representative flow plots (right) and bar graph (left) displaying fold-induction of γ-H2AX in Trp53−/− and Nfe2l2−/− LCs at 24 h after 6 Gy IR-treatment. (b) Representative bar graph of γ-H2AX fold induction in LCs irradiated with 6 Gy in cell suspension and analyzed at the indicated time points. (c–d) DNA damage in WT, Trp53−/− and Nfe2l2−/− LCs at 0.5 h, 2 h (c), and 24 h (d) after 6 Gy IR-treatment. Time points 0.5 and 2 h were performed by irradiating LCs in suspension. The 24 h time point was acquired through irradiation of mice and subsequent enzymatic LC isolation 1 d later. (e) Bar graph comparing caspase fold induction in LCs at 24 h after 6 Gy IR-treatment in WT, Cdkn1a−/−, Trp53−/−, and Nfe2l2−/− LCs. All data are pooled from 2 independent experiments n=4 mice/group. Data are shown as mean +/− SD (γ-H2AX and caspase) or SEM (for COMET). p values of ≤0.01 are labeled as ** and p≤0.001 as ***.
Nfe2l2−/− LCs accumulated significantly greater amount of DNA DSBs than Trp53−/− LCs as measured by γ-H2AX (Fig. 5b) and COMET assays (Fig. 5c,d), while retaining the ability to repair some DNA DSBs by 2 h after IR (Fig. 5b). Interestingly, both Trp53−/− and Nfe2l2−/− LCs have a significant increased activation of caspases (Fig. 5e), although it was significantly lower than those observed in Cdkn1a−/− LCs. In accordance with its role downstream of the CDKN1A pathway, we did not detect differences in Cdkn1a expression between Nfe2l2−/− and WT mice (Supplementary Fig. 3a,b). The disparity between Nfe2l2−/− and Cdkn1a−/− LCs in DSBs and apoptosis sensitivity suggests contributions of multiple downstream mediators of CDKN1A contributing to LC IR-resistance.
We also explored the potential roles in LC IR-resistance of candidate molecules outside the CDKN1A pathway including ATM and Foxo3. Each molecule has been implicated in both IR resistance and myeloid response to IR29,30. Neither Atm−/− nor Foxo3−/− LCs had a defect in the DNA repair pathway (Supplementary Fig. 3c). Though these data do not preclude a role for alternative candidates, it does reinforce the critical role that the CDKN1A pathways occupies in mediating short term DNA repair and survival in LCs.
Tumor growth is increase in IR-treated mice
The ability of tumors to trigger immunogenic responses has been called into question in recent literature analyzing the use of cancer immunotherapies in potentially immunosuppressive environments2, 9. Our finding that LCs represent the predominant antigen-presenting cell in the skin and sdLNs after IR exposure prompted us to analyze LC contribution to skin tumor immunity in vivo. We devised a model system to specifically assess the impact of IR on DCs, independent of IR effects on local tumors. To achieve this, mice were pretreated with 6 Gy IR and then challenged with a subcutaneous injection of live B16 melanoma 12−24 h later. We found that mice pretreated with IR had significantly larger tumors as compared to non-treated mice (Fig. 6a), which was associated with increased Treg cell frequencies within the tumor and in tumor draining LN (tdLN) (Fig. 6b). Interestingly, we found similar effects when the lymphoma cell-line EL-4 was injected (Supplementary Fig. 4a,b), suggesting that this effect was not mediated by the induction of melanocyte-specific Treg cells. Furthermore, this effect was only observed when B16 melanoma was injected shortly after IR-treatment (12–24 h), and lost if tumor cells were inoculated 5 weeks after IR-treatment (Supplementary Fig. 4c,d).
Figure 6. Tumor growth is increased in IR-treated mice.
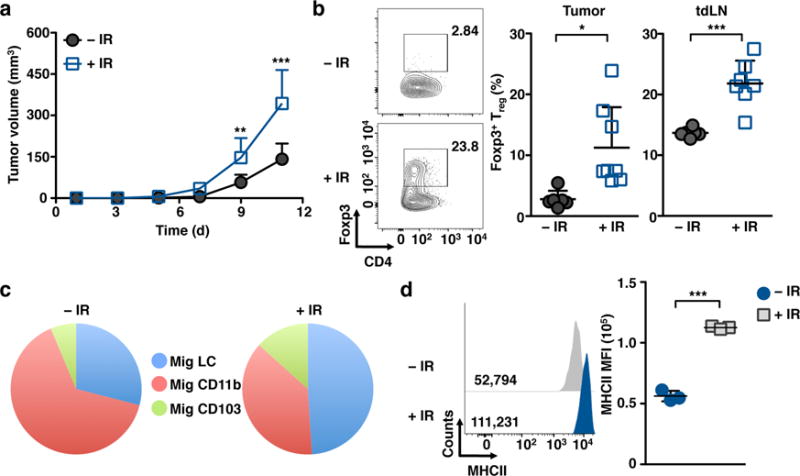
(a) Mice were irradiated with 6 Gy followed 2 h later by injection of 5×10⁵ B16 melanoma cells subcutaneously and tumor volume was assessed at the indicated time points. (b) Representative flow plots (left) and bar graph (right) of tumor infiltrating and tdLN FoxP3+ Treg cells as assessed 12 d after tumor challenge. (c) Representative pie chart illustrating relative frequency of mig DC subsets in the sdLNs at 12 d post 6 Gy-IR. Data are representative of two-three independent experiments, n≥3 mice per group. Data are shown as Mean +/− SD. (d) Expression of MHCII in migrating LCs isolated from the sdLNs as measured by flow cytometry 24 h post 6 Gy IR-treatment. Data from (a–c) are pooled from two independent experiments. Data in (d) are representative of two independent experiments. p values of ≤0.05 are labeled *, p≤0.01 as **, and p≤0.001 as ***.
Analysis of the various APC populations in the sdLNs revealed a shift in the proportion of migratory APCs, with LCs representing more than 50% of all migratory DCs 12 days after IR (Fig. 6c). Importantly, upon exposure to IR migratory LCs up-regulated MHCII further supporting a possible contribution of these cells to the generation of Treg cells (Fig. 6d). These data suggest that the increased density of LCs in the epidermis alter the anti-tumor immune response, tilting the balance in favor of tumor-protective Treg cell generation post-IR.
Acute IR exposure trigger LC-mediated Treg cell generation
To establish if increased Treg cell frequencies after IR is a result of the shift in the proportion of LCs within sdLN, we utilized a BM chimera antibody-targeting model. We employed a BM chimera system in which Ly75−/− BM, which is deficient for the endocytic cell-surface receptor DEC205 (expressed broadly by all DCs and LCs), were transplanted into WT recipient mice. The resulting Ly75−/− into WT chimeras (Ly75−/− WT) were permitted to recover for two months, at which point the only cells expressing the surface receptor DEC205 were IR-resistant, host-derived LCs (Supplementary Fig. 5a). Next, BM chimeras were treated with 6 Gy IR 1 d before the adoptive transfer of myelin oligodendrocyte glycoprotein (MOG)-specific T cells and inoculation of DEC205-MOG conjugated antibodies31. These antibodies act as carriers of MOG only to DEC205 expressing cells, which are radio-resistant LCs in this case. Fifteen days later, Treg cell generation in irradiated and non-irradiated BM chimeras was analyzed. Remarkably, we observed up to a threefold increase in the frequency of MOG-specific Foxp3+ Treg cells in irradiated chimeras as compared to non-irradiated controls, suggesting that IR increased the capacity of IR-resistant LCs to generate Treg cells in sdLNs in vivo (Fig. 7a). In the context of our previous data, we asked whether Cdkn1a−/− LCs will help modulate Treg cell induction upon IR. Thus, we generated chimeras in which Ly75−/− BM was adoptively transferred into irradiated Cdkn1a−/− mice so that LCs lacking the cell cycle inhibitor CDKN1A were the only APCs that expressed the surface receptor DEC205 (Supplementary Fig. 5b,c). We found that Cdkn1a−/− LCs were much less potent at driving Treg cell generation upon exposure to IR (Fig. 7a).
Figure 7. Acute IR exposure triggers LC-mediated Treg cell generation.
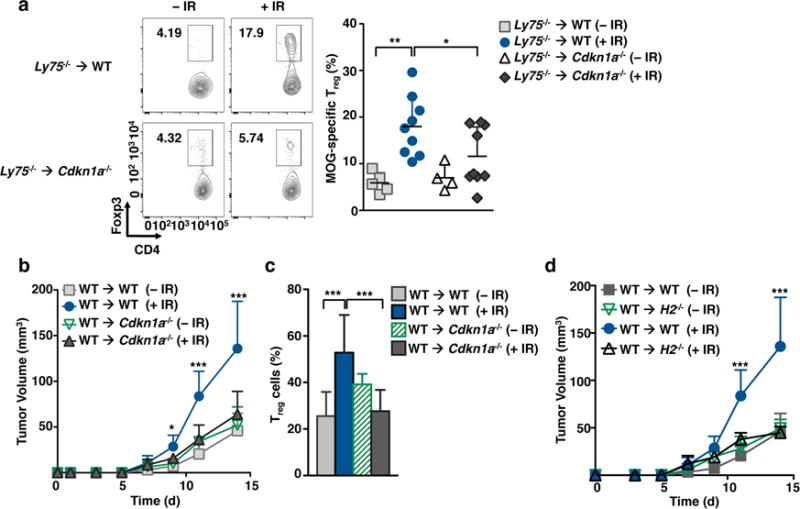
(a) Wild-type or Cdkn1a−/− mice were lethally irradiated and transplanted with Ly75−/− bone marrow. Two months after transplantation, mice were IR-treated (6 Gy) 24 h before the adoptive transfer of MOG-specific CD4+ T cells and inoculation of DEC205-MOG antibodies. Representative dot plots (left) and graph (right) assessing Treg cell frequency in adoptively transferred MOG-specific CD4+ T cells in sdLNs is shown 7 d after antigen inoculation. (b–c) Wild-type or Cdkn1a−/− mice were lethally irradiated and transplanted with WT bone marrow. Two months after transplantation, mice were IR-treated (6 Gy) 24 h before the subcutaneous inoculation of B16 tumor cells. (b) Tumor volume was assessed at the indicated times. (c) Graph showing Treg cell frequency in tumors at day 14 after tumor transplantation. (d) WT and H2−/− recipient chimera mice were generated, treated with 6 Gy IR, and subsequently injected with B16 tumor cells. Tumor volume was assessed at the indicated times. Data are pooled from at least two independent experiments, n≥2 mice per group/experiment. Data are shown as Mean +/− SD. p values of ≤0.05 are labeled *, p≤0.01 as **, and p≤0.001 as ***.
This ability of IR-treated LCs to promote Treg cells raises the possibility that persistent LCs can alter the effect of local radiotherapy on tumor survival, consistent with larger B16 tumors in mice pretreated with IR. To evaluate the role of radio-resistant LCs in tumor survival, WT BM was transferred into Cdkn1a−/− mice. After reconstitution, these chimeras were exposed to 6 Gy IR and ultimately challenged with B16 melanoma tumor cells (Fig. 7b–c). Strikingly, IR-treated WT → Cdkn1a−/− chimeras, in which LCs are susceptible to IR-induced apoptosis, had tumors equivalent in size to those of non-irradiated chimeras. Further, we found that tumor size in BM chimeras correlated with a decreased frequency of Treg cells in tumor grafts (Fig. 7b). This finding suggests that Treg cell accumulation following IR is dependent upon IR-resistant LCs that in turn promote tumor growth. In agreement with this hypothesis, depletion of Treg cells upon IR-treatment significantly reduced tumor volume as compared to non-irradiated controls (Supplementary Fig. 6a,b).
In agreement with a role of IR-treated LCs to promote Treg cells, we found increased expression of MHCII by IR-treated LCs (Fig. 6d). Thus, to more explicitly link the APC function of LCs to the observed phenotype, and not an effect of other APC or tissue stroma, we utilized a chimera system in which WT and Cdkn1a−/− BM was transplanted into H2−/− recipients deficient for MHCII molecules. In these mice, all hematopoietic cells expressed MHCII except for IR-resistant LCs. This model therefore allows us to assess the LC-specific contribution to Treg cell generation. Consistent with a role for LCs promoting Treg cell post-IR, we did not observe any discernible differences in tumor size between irradiated and non-irradiated mice (Fig. 7d, Supplementary Fig. 6c). Moreover, H2−/− chimeric LCs failed to accumulate Treg cells after IR when compared to WT chimeric LCs (Supplementary Fig. 6d). These data therefore strongly suggest that IR-resistant LCs mediate Treg cell generation or accumulation following IR in the tumor setting and that this phenomenon is dependent upon LC expression of high amounts of CDKN1A.
DISCUSSION
Although macrophages are amongst the most resistant hematopoietic cells to ionizing radiation, LCs are on the extreme of the spectrum as they can resist very high dose IR13. Here, we were able to identify one key modulator of LC IR-resistance, CDKN1A. We demonstrate, consistent with prior reports16, that skin DCs migrate to the sdLNs in a CCR7-dependent manner following IR and that LCs singularly fail to undergo apoptosis in response to lethal IR doses. This property is intimately connected to their unique ability to rapidly, as soon as 30 minutes, repair DNA DSBs owing to a pro-survival and repair gene repertoire that is enriched both in the steady state and after IR. We also show that upon exposure to IR, LCs upregulate MHCII expression, migrate to the sdLNs and expand Treg cells that in turn modulate tumor size.
Our analyses have identified the CDKN1A pathway as a critical regulator of LC IR-resistance. Cdkn1a mediates cellular stress responses, apoptosis, G1→S cell cycle arrest, and has been recognized as a key modulator of chemo-radiation resistance in diverse stem cells and cancers23. Activation of CDKN1A has been shown to affect DNA repair, a pro-survival balance of caspase molecules, ROS neutralization, and the release of key cytokines and growth factors23. Further, CDKN1A is also able to promote survival through the phosphorylation by AKT and subsequent direct binding to effector caspases and MAP3K532,33. Here we found that CDKN1A contributed to the ability of LCs to resist IR via the rapid repair of DSBs, apoptosis prevention, and induction of cell-cycle arrest. Due to the myriad functions affected by CDKN1A and to technical limitations, we are unable to determine whether LC IR-resistance hinges upon just one of these mechanisms.
Though Cdkn1a was the most greatly induced gene following IR, our analyses identified several potential regulators of LC IR-resistance. The downstream effector of CDKN1A, NFE2L2 is essential to DNA DSB repair and survival. On the other hand, our data is inconclusive regarding the role of Trp53, the main reported upstream regulator of CDKN1A pathway23. We found that TRP53-deficient LCs are able to partially repair DNA damage, supporting the notion that CDKN1A may be regulated not only by TRP53, but also by other unidentified regulators34,35. Given the extensive literature on the relationship between TRP53 and CDKN1A35,36, this is an area of ongoing inquiry in our laboratory. Similarly, in preliminary analyses the molecules ATM and FOXO3 were dispensable for short-term DNA repair post-IR, but we cannot preclude a role for their longer-term immune modulation29,30. Likewise, analysis of BCL molecules, which have a well-described effect on myeloid cell survival and homeostasis37 are currently underway in our laboratory. Thus, while CDKN1A is critical to our observed effect, we believe it likely represents one critical aspect of a multifaceted DNA damage repair mechanism in LCs.
Compared to adult blood-derived LC that reside transiently in the epidermis, we found that embryonic-derived LCs are much more resistant to IR-induced genotoxic stress, suggesting that IR-resistance may be a characteristic obtained during fetal development of these cells. In light of this property, we suggest that LCs may have evolved a unique ability to tolerate diverse genotoxic threats by virtue of their development and localization in an interface tissue regularly exposed to UV light, environmental toxins, and pathogens. In agreement with this, LCs resist apoptosis in response to various genotoxic stressors such as DNA mutagen DMBA38 and UV22,39. Similar to what we observed after exposure to IR, UV-treated LCs promote the known phenomenon of UV-induced immunosuppression22,39. Further, following DMBA, LCs resist DSB and promote squamous cell cancers38. A notable exception that we observed, however, was LC inability to fully resolve DSBs induced by cisplatin adducts. This provides an immunological justification for the expanded use of platinum agents as IR-sensitizing chemotherapeutics against IR-resistant tumors40.
We speculated that part of the LC genotoxic stress response involves an immune-inhibitory program that is permissive to skin malignancies. In fact, varying reports demonstrate that IR efficacy may be limited by Treg cell generation. We directly tackled the issue of IR-mediated immune-modulation and identified IR-treated LC as effective promoters of Treg cells. While it has been demonstrated that Treg cells are preferentially resistant to IR41, it was still unclear whether Treg cells are expanded post-IR. Our data demonstrated that LCs are instrumental in facilitating an increased in Treg cells in an MHC II-dependent manner. We showed that LCs up-regulate expression of MHC II following IR treatment and that tumor volume is similar to non-irradiated control in MHC II-deficient LCs. In future experiments we will address whether radio-resistant LCs are inducing de novo tumor-specific Treg cells, expanding, or recruiting a pre-existing Treg cell pool. Yet, using a targeting strategy we observed that irradiated LCs were superior to non-irradiated LCs in their ability to induce MOG-specific Treg cells, suggesting that IR may alter significantly the intrinsic capacity of LCs to induce tolerance. Notably, given that our aim was to elucidate the immune-modulatory effects of IR, we did not address the direct effects of IR on tumors, which have already been reported broadly42.
It is critical to understand the apparently opposing effects of IR due to its clinical pervasiveness: approximately half of all cancer patients will undergo radiation therapy at some point in the course of their disease43. Here we showed that tumor might resist IR treatment by a mechanism involving LC-mediated Treg cell accumulation. Treg cells may negatively impact anti-tumor immune responses via blockade of tumor-specific effector cells or, independently of antigen-specificity, via expression of regulatory cytokines such as IL-1044. Conversely, depletion of Treg cell, for example in Foxp3-DTR mice, obviated this effect and promoted slower tumor growth9. We may speculate that IR-induced immunity is not skin antigen specific, but rather tumor-specific, as we recapitulate our findings in an EL4 lymphoma model. This is consistent with a model in which the direct activation of LCs by IR promotes antigen presentation of tumor antigens and the induction of tumor specific effector Treg cells. The temporal coincidence of IR and LC migration seems critical to this phenomenon, as there was no apparent Treg cell memory response in mice pretreated with IR 5 weeks prior to tumor inoculation.
The ability of IR to effectively promote LC tolerogenic function may be associated with the generalized induction of apoptosis induced by IR1, though other uncategorized mechanisms of APC modulation may exist3,5,45. An important factor to consider was our technical restriction to total body irradiation, in lieu of stereotactic treatment. It is possible that local treatment may result in decreased LC-driven Treg cell generation, and highlights the importance of dose constraints to spare healthy tissues.
Our study contributes to an expanding literature linking cellular checkpoint and stress related molecules to immune function of APCs such as DCs and macrophages. For example, recent work has identified the role of low dose irradiation on macrophage polarization in the context of a murine melanoma model, in which IR-conditioned macrophages exhibited anti-tumor effects via angiogenesis inhibition and enhanced ROS generation46. Others have also shown that DNA repair molecules such as ATM can modulate the ability of APC to polarize TH17 T cells by releasing IL-2330. Here, we demonstrate that LCs are programmed to resist depletion by IR, and rapidly mitigate DNA DSBs in a p21-dependent manner. Further, LCs potently generate Treg cells in response to IR that promote tumor growth. Induction of tumor promoting Treg cells upon exposure to IR is likely dependent on tissue-specific signals and the type of APC that inhabit the IR tissues. Thus, understanding tissue-specific response to IR may help design novel rationale strategies to avoid tumor IR resistance. Importantly, our work suggests a critical means by which Treg cell generation could be potentially blocked through the IR-sensitization of local radio-resistant LCs, thereby promoting enhanced tumor response to radiotherapy.
METHODS
Animals
6–10-wk-old C57BL/6 CD45.2 and CD45.1 mice were purchased from the US National Cancer Institute. Cdkn1a−/−, Nfe2l2−/−, Atm−/−, Ccr7−/−, Foxp3-DTR, MOG-specific 2D2 transgenic, and H2–/–mice were purchased from the Jackson Laboratory. Foxo3−/− and Trp53−/− mice were obtained from S. Ghaffari. Ly75−/− mice were obtained from M.C. Nussenzweig. All animal protocols were approved by the Icahn School of Medicine IACUC.
Preparation of Epidermal and Dermal Cell Suspension and Cultures
Mouse ears were split in dorsal and ventral halves, and incubated for 90 min in Hank’s Balanced Salt Solution (HBSS) containing 2.5 mg/ml Dispase (Gibco) at 37 °C degrees to permit separation of epidermis from dermis. Forceps were used to divide the two tissues and each was then transferred to HBSS containing 0.4 mg/ml Collagenase IV (Sigma) and 100 U/ml DNAse, minced, and incubated for 2 h at 37 °C degrees. Single-cell suspension was accomplished by utilizing 3 ml syringe and 17.5-gauge needle to disaggregate all cells. Once in suspension, cell homogenates were resuspended in RPMI (CellGro), supplemented with 5% FBS (Sigma), 100 U/ml penicillin, and 100 mg/ml streptomycin (CellGro). Staining of cell suspensions was done in PBS with 0.5% bovine serum albumin (BSA) and 2 mM EDTA.
Cell counts
Two ears per mouse or two inguinal LN were used to estimate the number of cells in the skin and sdLN, respectively. Absolute cell numbers of epidermis, dermis and sdLN was assessed with a hemacytometer using Trypan Blue to exclude dead cells. Absolute DC subpopulation numbers were calculated on the basis of the total cell numbers (by hematocytometer) and the frequencies of each cell type in each organ (by flow cytometry). Epidermal LC frequencies were obtained from the epidermis by gating on DAPI− CD45+ MHCII+ CD11b+ cells; dermal LC frequencies were obtained from the dermis by gating on DAPI− CD45+ MHCII+ and CD11c+. LN resident DC frequencies were obtained from the sdLN by gating on DAPI− MHCIIlo CD11chi cells.
Genotoxic treatment
Mice were exposed to 6 or 12 Gy using a cesium-137 source, or to UV-C for 25 min using a 115 W lamp at a distance of twelve inches or injected with cisplatin (Sigma) at a dose of 1 mg/kg body weight suspended in PBS. DC subpopulations were analyzed 12–24 h after IR treatments. Since isolation of LCs from IR mice takes several hours, to analyze LC DNA damage at shorter time points (15–120 min post-IR treatment), skin was first enzymatically digested and then cell suspensions were exposed in complete medium to 6 Gy IR-treatment, 1 mM cisplatin or 15 min with 115 W UV-C lamp at a distance of twelve inches (UV treatment).
Flow Cytometry
A full listing of antibodies used for flow cytometry are included in Supplemental Table 1. For caspase activation, cell suspensions were stained with FAM-VAD-FMK, which enters into the cells and irreversible binds to activate caspases, following the manufacture’s recommendations (Vybrant FAM Poly Caspases Assay Kit; Life Technologies). Cells were washed to remove unbound FAM-VAD-FMK and subjected to flow cytometry. Intracellular markers such as γ-H2AX and Foxp3 were stained after fixation and permeabilization (Foxp3 Permeabilization and Fixation Kit; eBioscences). Multi-parameter analyses of stained cell suspensions were performed on LSRII or Fortessa (BD) and analyzed with FlowJo (Tree Star). In some cases, protein expression was quantified using the geometrical mean fluorescent intensity (MFI) value. Different DC populations were distinguished using previously described gating strategies27,47. Briefly, epidermal LCs were gated from the epidermis as DAPI−CD45+MHCII+CD11b+; dermal DCs were gated from the dermis as DAPI−CD45+MHCII+CD11c+; migratory DCs were gated from sdLN as DAPI− MHCIIhiCD11cint-low; LN-resident DCs were gated from sdLN as DAPI−MHCIIint-lowCD11chi; embryonically-derived LCs were gated from the epidermis as DAPI−CD45+MHCII+CD11b+EpCAMhi and monocyte-derived LCs were gated from the epidermis as DAPI−CD45+MHCII+CD11b+EpCAMlo from the epidermis. Flow cytometry was used to isolate individual cells using InFlux or Aria (BD).
BM Chimeras and Adoptive Transfer
BM chimeras were generated by exposing recipient mice to 12 Gy IR in 2 doses separated by 3 h, following by the i.v. injection of at least 5 × 10⁶ BM cells, and subsequent housing mice for 8 weeks before analysis. To address the role of LCs in the presentation of antigen to T cells in naïve and IR conditions, Ly75−/− BM was transplanted to CD45.1 and Cdkn1a−/− adult recipients. Following complete chimerism and repopulation from donor marrow (at least 2 months after BM transplantation), MOG specific CD4+ T cells (3–5 × 10⁶) were transferred to either naïve or IR-pretreated chimeras approximately 6–8 h after 6 Gy IR-treatment. DEC205-MOG antibodies were administered 1 d after T cell transfer, and Treg cell generation was assessed as previously described31.
Comet Assay
DC populations isolated by flow cytometry were assessed following the supplier’s protocol for the assay (Trevigen). In short, cells were resuspended in low-molecular weight agarose, lysed and subjected to 1 V/cm current in an electrophoresis chamber filled with neutral comet buffer. Following electrophoresis samples were doused in DNA precipitation solution, rinsed in ethanol and dried overnight. Samples were then stained with DAPI/SYBR green and images taken with an Axioplan 2IE (Leica). For each sample, 50–60 comet images were randomly captured and scored using ImageJ (plugin CometScore). DNA damage graphs (generated by GraphPad) are shown as the percentage of tail DNA and are expressed with a whisker plots or the mean +/− SEM of one representative of two independent experiments.
Injection of Tumor Cell Lines, TIL Analysis and Treg depletion
The mouse melanoma cell line B16 was utilized to model cutaneous neoplasia in mice48. As control, we also used the lymphoma cell line EL-4. Flank skin was shaved on non-irradiated or 6 Gy IR-treated recipient mice and 5 × 10⁵ B16 cells or 1 × 10⁶ EL-4 cells were injected subcutaneously 24 h or 5 weeks after IR-treatment. Tumor volume was assessed every two days (height × length × width) by electronic caliper (BD) and mice were kept for 12–28 days following injection. Upon sacrifice, tumor-draining LN (tdLN), non-draining LNs, and tumors were collected. Tumors were minced and digested with collagenase as described above for isolation of skin single cell suspensions. Following homogenization cells were resuspended in 40% Percoll (GE Healthcare), underlaid with 90% Percoll, and centrifuged for 30 min at 1000g at 20°C. Following isolation of the cellular interphase the described protocol for flow cytometry was performed. Foxp3-DTR mice were inoculated i.v. with 500 ng DT (Sigma-Aldrich) on day 5 post tumor cell inoculation, followed by 250 ng i.p. every 2 d thereafter until sacrifice to maintain Treg cell ablation.
Microarray analysis
Epidermal LCs were purified by cell sorting (Aria II, BD) 24 h after 12 Gy IR-treatment using the ImmGen Standardized Sorting protocol (http://www.ImmGen.org). This protocol required at least 3 independent samples for the analysis involving no fewer than 1 × 10⁴ cells per sample (we pooled 3 mice to obtain ~1 × 10⁴ LCs). These flow cytometry-purified cells were sorted directly into TRIzol (Life Technologies). RNA was amplified and hybridized on the Affymetrix Mouse Gene 1.0 ST array according to the manufacturer’s procedures and standardized protocols of ImmGen. Data pre-processing, normalization and quality control were as described previously, which allowed direct comparison with samples previously processed, including control epidermal LCs (non-irradiated), dermal LCs, mig LCs, mig dermal DCs and LN-resident DCs49. Heat map was generated using GenePattern and depicts normalized values of at least 3 replicates/subpopulation. All datasets were deposited in the National Center for Biotechnology Information/GEO database (accession numbers GSE 71330 & GSE15907).
Quantitative PCR
For analysis of Cdkn1a mRNA expression, subpopulations were sorted by flow cytometry directly into TRIZol from WT or KO mice. These subpopulations included epidermal LCs identified as DAPI− CD45+ MHCII+ CD11b+ cells,; DAPI− CD45+ MHCII+ CD11c+ dermal DCs, and epidermal DAPI+ CD45− keratinocytes. RNA isolation was performed following manufacture’s procedure (TRIZol; Life Technologies), and cDNA was synthesized from total RNA using “RNA to cDNA EcoDry” (Clontech). cDNA was subjected to real-time PCR using SYBR green (Bio-Rad Laboratories, USA) and the following primers: Cdkn1a forward, 5′-ttccgcacaggagcaagt-3′, and reverse, 5′-cggcgcaactgctcact-3′. Data was normalized to GAPDH primers: forward 5′-gccttctccatggtggtgaa-3′, reverse 5′-gcacagtcaaggccgagaat-3′, and expression calculated using the Δ/Δ ct method.
Statistical Analysis
Data reported in the figures were analyzed and charts were generated using Prism 5 (GraphPad Software). Fold induction of γ-H2AX and caspase was calculated as the ratio between geometrical mean intensity in irradiated mice and non-irradiated control mice. Data are presented as means +/− SD, except for the analysis of the COMET assay that is presented as the mean +/− SEM as described50. Statistical significance between two groups was determined by a Student’s t-test. Statistical significance between more than two groups was determined by ANOVA followed by Tukey’s post hoc analysis. Tumor volumes were evaluated by 2-way ANOVA and Bonferroni’s post hoc analysis.
Supplementary Material
Acknowledgments
The authors thank J. Manfredi, P. Heeger, S. Aronson and M. Nussenzweig (The Rockefeller University) for providing mice. We are greatly appreciative of C. Rivera for her help maintaining our mouse colonies and to R. Bagnell (University of North Carolina) for the Image-J CometScore module. We thank A. Nussenzweig (National Cancer Institute) for critical input to the paper. We are grateful to the contributions by the Icahn School of Medicine at Mount Sinai’s Flow Cytometry, Microscopy, and Irradiator Shared Resource Facilities. We are also grateful to the ImmGen Consortium (Immgen.org) for providing key resources for this investigation. J.P. is supported by NIH T32 CA078207-14, T32 GM007280, and an AMA Seed Grant. J.I. is supported by NIH/NIAMS grant R00 AR062595. This work was supported by NIH/NCI R01 CA173861 and R01 CA154947 awarded to M.M.
Footnotes
Accession codes
All microarray data presented has been archived under GSE 71330 & GSE15907
Author Contributions
M.M, J.G.P. and J.I. contributed to the design and discussion of the work. J.G.P and J.I performed experiments, analyzed data and prepare the figures; H.S. contributed to in vivo tumor experiments; B.H. contributed to RT-PCR experiments; M.L. contributed to the maintenance of animal colonies and generation of bone marrow chimeras; C.L.B. and S.G. developed protocols for COMET assay and provided Foxo3−/− mice; M.M., J.G.P. and J.I. wrote the manuscript. All the authors edited the manuscript.
Competing financial interests
The authors declare no competing financial interests.
References
- 1.Blanpain C, Mohrin M, Sotiropoulou PA, Passegue E. DNA-Damage Response in Tissue-Specific and Cancer Stem Cells. Cell Stem Cell. 2011;8(1):16–29. doi: 10.1016/j.stem.2010.12.012. [DOI] [PubMed] [Google Scholar]
- 2.Liauw SL, Connell PP, Weichselbaum RR. New paradigms and future challenges in radiation oncology: an update of biological targets and technology. Sci Transl Med. 2013;5(173):173sr172. doi: 10.1126/scitranslmed.3005148. [DOI] [PMC free article] [PubMed] [Google Scholar]
- 3.Apetoh L, Ghiringhelli F, Tesniere A, Obeid M, Ortiz C, Criollo A, et al. Toll-like receptor 4-dependent contribution of the immune system to anticancer chemotherapy and radiotherapy. Nat Med. 2007;13(9):1050–1059. doi: 10.1038/nm1622. [DOI] [PubMed] [Google Scholar]
- 4.Liang H, Deng L, Chmura S, Burnette B, Liadis N, Darga T, et al. Radiation-induced equilibrium is a balance between tumor cell proliferation and T cell-mediated killing. J Immunol. 2013;190(11):5874–5881. doi: 10.4049/jimmunol.1202612. [DOI] [PMC free article] [PubMed] [Google Scholar]
- 5.Deng L, Liang H, Xu M, Yang X, Burnette B, Arina A, et al. STING-Dependent Cytosolic DNA Sensing Promotes Radiation-Induced Type I Interferon-Dependent Antitumor Immunity in Immunogenic Tumors. Immunity. 41(5):843–852. doi: 10.1016/j.immuni.2014.10.019. [DOI] [PMC free article] [PubMed] [Google Scholar]
- 6.Lee Y, Auh SL, Wang Y, Burnette B, Wang Y, Meng Y, et al. Therapeutic effects of ablative radiation on local tumor require CD8+ T cells: changing strategies for cancer treatment. Blood. 2009;114(3):589–595. doi: 10.1182/blood-2009-02-206870. [DOI] [PMC free article] [PubMed] [Google Scholar]
- 7.Pardoll DM. Spinning molecular immunology into successful immunotherapy. Nat Rev Immunol. 2002;2(4):227–238. doi: 10.1038/nri774. [DOI] [PubMed] [Google Scholar]
- 8.Topalian SL, Hodi FS, Brahmer JR, Gettinger SN, Smith DC, McDermott DF, et al. Safety, activity, and immune correlates of anti-PD-1 antibody in cancer. N Engl J Med. 2012;366(26):2443–2454. doi: 10.1056/NEJMoa1200690. [DOI] [PMC free article] [PubMed] [Google Scholar]
- 9.Bos PD, Plitas G, Rudra D, Lee SY, Rudensky AY. Transient regulatory T cell ablation deters oncogene-driven breast cancer and enhances radiotherapy. J Exp Med. 2013;210(11):2435–2466. doi: 10.1084/jem.20130762. [DOI] [PMC free article] [PubMed] [Google Scholar]
- 10.Chen DS, Mellman I. Oncology meets immunology: the cancer-immunity cycle. Immunity. 2013;39(1):1–10. doi: 10.1016/j.immuni.2013.07.012. [DOI] [PubMed] [Google Scholar]
- 11.Guilliams M, Ginhoux F, Jakubzick C, Naik SH, Onai N, Schraml BU, et al. Dendritic cells, monocytes and macrophages: a unified nomenclature based on ontogeny. Nat Rev Immunol. 2014;14(8):571–578. doi: 10.1038/nri3712. [DOI] [PMC free article] [PubMed] [Google Scholar]
- 12.Merad M, Ginhoux F, Collin M. Origin, homeostasis and function of Langerhans cells and other langerin-expressing dendritic cells. Nature Reviews Immunology. 2008;8(12):935–947. doi: 10.1038/nri2455. [DOI] [PubMed] [Google Scholar]
- 13.Merad M, Manz MG, Karsunky H, Wagers A, Peters W, Charo I, et al. Langerhans cells renew in the skin throughout life under steady-state conditions. Nat Immunol. 2002;3(12):1135–1141. doi: 10.1038/ni852. [DOI] [PMC free article] [PubMed] [Google Scholar]
- 14.Chakraverty R, Sykes M. The role of antigen-presenting cells in triggering graft-versus-host disease and graft-versus-leukemia. Blood. 2007;110(1):9–17. doi: 10.1182/blood-2006-12-022038. [DOI] [PMC free article] [PubMed] [Google Scholar]
- 15.Hashimoto D, Miller J, Merad M. Dendritic cell and macrophage heterogeneity in vivo. Immunity. 2011;35(3):323–335. doi: 10.1016/j.immuni.2011.09.007. [DOI] [PMC free article] [PubMed] [Google Scholar]
- 16.Cummings RJ, Gerber SA, Judge JL, Ryan JL, Pentland AP, Lord EM. Exposure to Ionizing Radiation Induces the Migration of Cutaneous Dendritic Cells by a CCR7-Dependent Mechanism. J Immunol. 2012;189(9):4247–4257. doi: 10.4049/jimmunol.1201371. [DOI] [PMC free article] [PubMed] [Google Scholar]
- 17.Cummings RJ, Mitra S, Foster TH, Lord EM. Migration of skin dendritic cells in response to ionizing radiation exposure. Radiat Res. 2009;171(6):687–697. doi: 10.1667/RR1600.1. [DOI] [PMC free article] [PubMed] [Google Scholar]
- 18.Ohl L, Mohaupt M, Czeloth N, Hintzen G, Kiafard Z, Zwirner J, et al. CCR7 Governs Skin Dendritic Cell Migration under Inflammatory and Steady-State Conditions. Immunity. 21(2):279–288. doi: 10.1016/j.immuni.2004.06.014. [DOI] [PubMed] [Google Scholar]
- 19.Kuo LJ, Yang L-X. γ-H2AX – A Novel Biomarker for DNA Double-strand Breaks. In Vivo. 2008;22(3):305–309. [PubMed] [Google Scholar]
- 20.Olive PL, Banath JP. The comet assay: a method to measure DNA damage in individual cells. Nat Protoc. 2006;1(1):23–29. doi: 10.1038/nprot.2006.5. [DOI] [PubMed] [Google Scholar]
- 21.Muslimovic A, Ismail IH, Gao Y, Hammarsten O. An optimized method for measurement of gamma-H2AX in blood mononuclear and cultured cells. Nat Protoc. 2008;3(7):1187–1193. doi: 10.1038/nprot.2008.93. [DOI] [PubMed] [Google Scholar]
- 22.Schwarz A, Maeda A, Kernebeck K, van Steeg H, Beissert S, Schwarz T. Prevention of UV radiation-induced immunosuppression by IL-12 is dependent on DNA repair. J Exp Med. 2005;201(2):173–179. doi: 10.1084/jem.20041212. [DOI] [PMC free article] [PubMed] [Google Scholar]
- 23.Abbas T, Dutta A. p21 in cancer: intricate networks and multiple activities. Nat Rev Cancer. 2009;9(6):400–414. doi: 10.1038/nrc2657. [DOI] [PMC free article] [PubMed] [Google Scholar]
- 24.Ahrendt SA, Brown HM, Komorowski RA, Zhu YR, Wilson SD, Erickson BA, et al. p21WAF1 expression is associated with improved survival after adjuvant chemoradiation for pancreatic cancer. Surgery. 2000;128(4):520–530. doi: 10.1067/msy.2000.108052. [DOI] [PubMed] [Google Scholar]
- 25.Balomenos D, Martin-Caballero J, Garcia MI, Prieto I, Flores JM, Serrano M, et al. The cell cycle inhibitor p21 controls T-cell proliferation and sex-linked lupus development. Nat Med. 2000;6(2):171–176. doi: 10.1038/72272. [DOI] [PubMed] [Google Scholar]
- 26.Perucca P, Cazzalini O, Madine M, Savio M, Laskey RA, Vannini V, et al. Loss of p21 CDKN1A impairs entry to quiescence and activates a DNA damage response in normal fibroblasts induced to quiescence. Cell Cycle. 2009;8(1):105–114. doi: 10.4161/cc.8.1.7507. [DOI] [PubMed] [Google Scholar]
- 27.Sere K, Baek JH, Ober-Blobaum J, Muller-Newen G, Tacke F, Yokota Y, et al. Two Distinct Types of Langerhans Cells Populate the Skin during Steady State and Inflammation. Immunity. 2012;37(5):905–916. doi: 10.1016/j.immuni.2012.07.019. [DOI] [PubMed] [Google Scholar]
- 28.Fei P, El-Deiry WS. P53 and radiation responses. Oncogene. 22(37):5774–5783. doi: 10.1038/sj.onc.1206677. 0000. [DOI] [PubMed] [Google Scholar]
- 29.Dejean AS, Beisner DR, Ch’en IL, Kerdiles YM, Babour A, Arden KC, et al. Transcription factor Foxo3 controls the magnitude of T cell immune responses by modulating the function of dendritic cells. Nat Immunol. 2009;10(5):504–513. doi: 10.1038/ni.1729. [DOI] [PMC free article] [PubMed] [Google Scholar]
- 30.Wang Q, Franks HA, Lax SJ, El Refaee M, Malecka A, Shah S, et al. The ataxia telangiectasia mutated kinase pathway regulates IL-23 expression by human dendritic cells. J Immunol. 2013;190(7):3246–3255. doi: 10.4049/jimmunol.1201484. [DOI] [PMC free article] [PubMed] [Google Scholar]
- 31.Idoyaga J, Fiorese C, Zbytnuik L, Lubkin A, Miller J, Malissen B, et al. Specialized role of migratory dendritic cells in peripheral tolerance induction. J Clin Invest. 2013;123(2):844–854. doi: 10.1172/JCI65260. [DOI] [PMC free article] [PubMed] [Google Scholar]
- 32.Dotto GP. p21(WAF1/Cip1): more than a break to the cell cycle? Bba-Rev Cancer. 2000;1471(1):M43–M56. doi: 10.1016/s0304-419x(00)00019-6. [DOI] [PubMed] [Google Scholar]
- 33.Gartel AL, Tyner AL. The role of the cyclin-dependent kinase inhibitor p21 in apoptosis. Molecular cancer therapeutics. 2002;1(8):639–649. [PubMed] [Google Scholar]
- 34.Wouters BG, Giaccia AJ, Denko NC, Brown JM. Loss of p21Waf1/Cip1 sensitizes tumors to radiation by an apoptosis-independent mechanism. Cancer Res. 1997;57(21):4703–4706. [PubMed] [Google Scholar]
- 35.Allan LA, Fried M. p53-dependent apoptosis or growth arrest induced by different forms of radiation in U2OS cells: p21WAF1/CIP1 repression in UV induced apoptosis. Oncogene. 1999;18(39):5403–5412. doi: 10.1038/sj.onc.1202931. [DOI] [PubMed] [Google Scholar]
- 36.Wouters BG, Denko NC, Giaccia AJ, Brown JM. A p53 and apoptotic independent role for p21waf1 in tumour response to radiation therapy. Oncogene. 1999;18(47):6540–6545. doi: 10.1038/sj.onc.1203053. [DOI] [PubMed] [Google Scholar]
- 37.Hon H, Rucker EB, 3rd, Hennighausen L, Jacob J. bcl-xL is critical for dendritic cell survival in vivo. J Immunol. 2004;173(7):4425–4432. doi: 10.4049/jimmunol.173.7.4425. [DOI] [PubMed] [Google Scholar]
- 38.Modi BG, Neustadter J, Binda E, Lewis J, Filler RB, Roberts SJ, et al. Langerhans cells facilitate epithelial DNA damage and squamous cell carcinoma. Science. 2012;335(6064):104–108. doi: 10.1126/science.1211600. [DOI] [PMC free article] [PubMed] [Google Scholar]
- 39.Schwarz A, Noordegraaf M, Maeda A, Torii K, Clausen BE, Schwarz T. Langerhans cells are required for UVR-induced immunosuppression. J Invest Dermatol. 2010;130(5):1419–1427. doi: 10.1038/jid.2009.429. [DOI] [PubMed] [Google Scholar]
- 40.Lawrence TS, Blackstock AW, McGinn C. The mechanism of action of radiosensitization of conventional chemotherapeutic agents. Seminars in radiation oncology. 2003;13(1):13–21. doi: 10.1053/srao.2003.50002. [DOI] [PubMed] [Google Scholar]
- 41.Kachikwu EL, Iwamoto KS, Liao YP, DeMarco JJ, Agazaryan N, Economou JS, et al. Radiation enhances regulatory T cell representation. Int J Radiat Oncol Biol Phys. 2011;81(4):1128–1135. doi: 10.1016/j.ijrobp.2010.09.034. [DOI] [PMC free article] [PubMed] [Google Scholar]
- 42.Formenti SC, Demaria S. Combining radiotherapy and cancer immunotherapy: a paradigm shift. Journal of the National Cancer Institute. 2013;105(4):256–265. doi: 10.1093/jnci/djs629. [DOI] [PMC free article] [PubMed] [Google Scholar]
- 43.Begg AC, Stewart FA, Vens C. Strategies to improve radiotherapy with targeted drugs. Nat Rev Cancer. 2011;11(4):239–253. doi: 10.1038/nrc3007. [DOI] [PubMed] [Google Scholar]
- 44.von Boehmer H. Mechanisms of suppression by suppressor T cells. Nat Immunol. 2005;6(4):338–344. doi: 10.1038/ni1180. [DOI] [PubMed] [Google Scholar]
- 45.Burnette BC, Liang H, Lee Y, Chlewicki L, Khodarev NN, Weichselbaum RR, et al. The efficacy of radiotherapy relies upon induction of type i interferon-dependent innate and adaptive immunity. Cancer Res. 2011;71(7):2488–2496. doi: 10.1158/0008-5472.CAN-10-2820. [DOI] [PMC free article] [PubMed] [Google Scholar]
- 46.Klug F, Prakash H, Huber PE, Seibel T, Bender N, Halama N, et al. Low-Dose Irradiation Programs Macrophage Differentiation to an iNOS(+)/M1 Phenotype that Orchestrates Effective T Cell Immunotherapy. Cancer Cell. 2013;24(5):589–602. doi: 10.1016/j.ccr.2013.09.014. [DOI] [PubMed] [Google Scholar]
- 47.Ginhoux F, Liu K, Helft J, Bogunovic M, Greter M, Hashimoto D, et al. The origin and development of nonlymphoid tissue CD103(+) DCs. J Exp Med. 2009;206(13):3115–3130. doi: 10.1084/jem.20091756. [DOI] [PMC free article] [PubMed] [Google Scholar]
- 48.Overwijk WWRN. B16 as a mouse model for human melanoma. Current Protocols in Immunology. 2001 doi: 10.1002/0471142735.im2001s39. May, Chapter 20, Unit 20. [DOI] [PMC free article] [PubMed] [Google Scholar]
- 49.Miller JC, Brown BD, Shay T, Gautier EL, Jojic V, Cohain A, et al. Deciphering the transcriptional network of the dendritic cell lineage. Nat Immunol. 2012;13(9):888–899. doi: 10.1038/ni.2370. [DOI] [PMC free article] [PubMed] [Google Scholar]
- 50.Duez P, Dehon G, Kumps A, Dubois J. Statistics of the Comet assay: a key to discriminate between genotoxic effects. Mutagenesis. 2003;18(2):159–166. doi: 10.1093/mutage/18.2.159. [DOI] [PubMed] [Google Scholar]
Associated Data
This section collects any data citations, data availability statements, or supplementary materials included in this article.