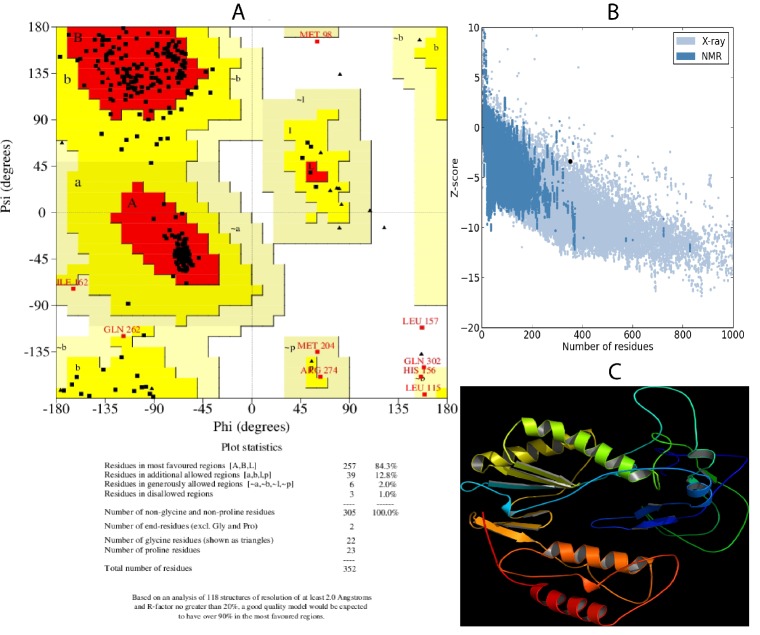
Figure 1.
Homology modeling and validation of model: A) Validation using Ramachandran plot. Summary of the plot is as follows: Residues in favored regions- 257 (84.3%), Residues in additionally allowed regions- 39 (12.5%), Residues in generously allowed regions-6 (2.0%) and Residues in disallowed regions- 3 (1.0%); B) PROSA Z score for model. The Z score for the model was -3.39; C) Homology model of HBV-DP created using Pymol software.

