

Abstract
There have been contradictory results about the association of fruits and vegetables intake with colorectal adenoma (CRA) risk, the precursor lesion of colorectal cancer. Herein, we have conducted a meta-analysis of the published observational studies to have a clear understanding about this association.
Eligible studies up to November 30, 2014, were identified and retrieved by searching MEDLINE and EMBASE databases along with the manual review of the reference list of the retrieved studies. The quality of the included studies was evaluated using Newcastle-Ottawa Quality Assessment Scale, and random-effects model was used to calculate summary relative risk (SRR) and corresponding 95% confidence interval (CI).
A total of 22 studies involving 11,696 CRA subjects were part of this meta-analysis. The SRR for the highest versus the lowest intake of vegetables alone was 0.91 (95% CI: 0.80–1.02, Pheterogeneity = 0.025), whereas for vegetables and fruits combined, it was 0.82 (95% CI: 0.75–0.91, Pheterogeneity = 0.369), and for fruits alone, it was 0.79 (95% CI: 0.71–0.88, Pheterogeneity = 0.111). In addition, linear dose–response analysis also showed similar results, for example, for per 100 g/d increment of fruits, the SRR was 0.94 (95% CI: 0.92–0.97) and for vegetables it was 0.98 (95% CI: 0.96–1.01). Nonlinear association was only observed for vegetables (Pnonlinearity = 0.024), but not for fruits (Pnonlinearity = 0.583).
Thus, this meta-analysis suggested that fruits consumption have a significant protective effect on CRA risk, but not vegetables. Moreover, we recommend additional studies with prospective designs that use validated questionnaires and control for important confounders to further validate the overall results.
INTRODUCTION
Colorectal cancer (CRC) is the fourth most commonly diagnosed cancer and the second leading cause of cancer deaths in the United States.1 Several environmental risk factors, such as smoking, obesity, physical inactivity, and some dietary factors, have been identified to contribute to the etiology of the CRC. The 40% of the population by the age of 60 years develop colorectal adenomas (CRAs), which are precursor lesions of CRC. CRA is an informative and important endpoint for colon carcinogenesis because it shares common etiopathogenesis with CRC. However, other than the age factor, smoking,2 obesity,3 and physical inactivity,4 very little is known about additional factors that contribute in the development of CRA.
Consumption of vegetables and fruits has generated interest for a long time because of their beneficial role in the prevention of cancers, including CRC. The different mechanisms that have been suggested for prevention of cancer includes modulation of DNA methylation, protection from DNA damage, promotion of apoptosis, and induction of detoxifying phase-II enzymes.5 Previous report of 2007 has provided some evidence for the associations between nonstarchy vegetables and fruits consumption with CRC development.6 However, these evidences were not very convincing and were more of suggestive nature only. Moreover, the Continuous Update Project Report in 2011 from the World Cancer Research Fund/American Institute for Cancer Research also did not alter these conclusions.7
In addition, epidemiological studies8–29 have also reported inconsistent results regarding the association between intake of vegetables and fruits with CRA risk. For example, data from the Nurse's Health Study22 and the Prostate, Lung, Colorectal and Ovarian Cancer Screening Trial24 concluded that the prevalence of CRA is decreased by intake of fruit only but not vegetables. In contrast, the Adventist Health Study linked the decreased risk of CRAs with only consumption of vegetables and not fruits.28 In addition, number of other studies have shown a nonsignificant risk associations.8–10,12,14,20,21 To our knowledge, there has been no comprehensive quantitative assessment of the risk association of vegetables and fruits consumption with CRA, and therefore we undertook this study to shed some more light on the role of fruits and vegetables consumption on CRA.
METHODS
We preformed the meta-analysis to assess the association between consumption of vegetables and fruits with CRA following the criteria set out by the Preferred Reporting Items for Systematic Reviews and Meta-Analysis (PRISMA) guidelines.30 There is no institutional review board that approved our study as all the data analyzed were from previously published studies.
Data Sources and Study Identification
Two investigators (QB and JZ) screened the published English language literature by performing computerized searches of the MEDLINE and EMBASE databases until November 30, 2014. The medical subject heading terms or keywords that were used for searching relevant articles were “adenoma” OR “polyp” OR “neoplasm” OR “neoplasia”; “colorectal” OR “colon” OR “rectal” OR “large bowel”; “nutrition” OR “diet” OR “lifestyle” OR “fruit” OR “vegetable”; and “risk” OR “incidence” OR “prevalence.” In addition, the reference lists of the identified articles were further searched for any potential relevant articles. However, we did not include abstracts or unpublished reports.
Study Selection
In the present meta-analysis, we included the studies evaluating fruit or vegetable groups classified as “all” or “total.” Two authors (QB and JZ) independently reviewed all the retrieved studies to determine if they meet the inclusion criteria and any disagreements were settled through consensus with a third investigator (YY). Studies were included in the meta-analysis, if they used a case-control, nested case-control, or cohort design; presented data for ≥3 categories of total vegetables or total fruits and incident cases of CRA; provided the data of odds ratios (ORs) or relative risks (RRs) with corresponding 95% confidence intervals (CIs) or at least present data to calculate them; and adjusted or matched the risk estimations with age at least. Non-peer-reviewed articles, animal and mechanistic studies, ecologic assessments, and correlation studies were not included for analysis. In case of several publications describing the same study, only the most recent or informative publication was included. Studies that lacked CRA-specific data or data about adenoma recurrence or growth were also excluded. We also excluded studies which described intake of only 2 categories of vegetables and/or fruit.
Data Extraction
The following information was extracted from each study independently by 2 researchers (QB and JZ), first author's last name, study design, publication year, geographic locations, the number of cases and controls or participants, definition of controls, methods of dietary data ascertainment (types of food item and whether the assessment method had been validated), exposure classification, follow-up duration in cohort study, the RR estimates with their 95% CI for the highest versus the lowest level and adjustments for confounders. From each study, the risk estimates were extracted that have been adjusted for the greatest number of potential confounders. Studies that reported both hospital- and population-based controls, only the risk estimations from the hospital-based controls were considered since they had an endoscopy.
Quality Assessment
The Newcastle-Ottawa Quality Assessment Scale (NOS)31 was used to assess the quality of each selected study. Based on the NOS, a study can be assigned a score of total 9 points (9 representing the highest quality) following these criteria: 4 points for selection, 2 points for comparability, and 3 points for exposure/outcome assessment. A total score ≥7 indicated high quality study. To avoid selection bias, no study was rejected because of these quality criteria.
Statistical Methods
All statistical analyses were performed using STATA, version 11.0 (STATA, College Station, TX) and R-package (Version 2.11.0 beta, R Development Core Team, NJ) statistical software. A 2-tailed P value of <0.05 represented significance. Random-effects model that accounts for variation between studies was used to calculate summary relative risk (SRR) (95% CI) for the highest versus lowest level, linear and nonlinear dose–responses.32 When estimates were available specifically for males and females,11,18,20 nonadvanced/advanced adenoma (NAA/AA),25 and small and large adenomas,19 they were considered as if obtained from different studies.
Heterogeneity was assessed by Cochran Q and I2 statistics. P value of <0.10 represented statistically significant heterogeneity. I2 values explained the amount of total variation among studies and a value of >50% signified severe heterogeneity while a value of <25% represented no significant heterogeneity.33 Sources of heterogeneity were explored using subgroup analyses and meta-regression analysis according to study design, sex, geographic location, type of food frequency questionnaire (FFQ), number of cases, study quality score, and confounders (adjusted for smoking, body mass index [BMI], physical activity, and dietary energy intake). Sensitivity analysis that investigated the influences of each individual study on the summary results was performed by omitting one study at a time.
Generalized least-squares trend estimation analysis34,35 was used for dose–response meta-analysis. It required the distribution of cases and person-years or noncases and RRs with known variance for at least 3 quantitative categories. Lack of this information led us to estimate the dose–response slopes using variance-weighted least squares regression analysis.34,35 For each category of intake level, the medians were assigned to corresponding RR. In the absence of such data, we assigned the median in each category by calculating the average of the lower and upper boundaries. When the lowest category was open-ended, zero was considered the lowest boundary. If the highest category was open-ended, it was assumed that the open-ended interval length had the same amplitude as the adjacent interval. The dose–response results were presented per 100 g/d increment in consumption of fruits or vegetables. When studies used different measurement units (eg, grams per day or portions per week or servings per day), we standardized fruits and vegetables intake into grams per day using a standard portion size of 106 g. A potential nonlinear dose–response relationship was calculated using the best-fitting second-order fractional polynomial model,36 defined as the one with the lowest deviance. A likelihood ratio test was used to assess the difference between the nonlinear and linear models.36
Publication bias was measured by funnel plots, Begg adjusted rank correlation test, and Egger linear regression test.37,38 The P values of <0.10 indicated potential publication bias. If publication bias was present, we further evaluated the number of missing studies by the trim and fill method and recalculated the pooled risk estimates with the addition of those missing studies.39
RESULTS
Search Results and Study Characteristics
Based on the study selection criteria, we identified a total of 10,867 potentially relevant articles (7816 articles from the MEDLINE database and 3051 articles from the EMBASE database). In addition, 13 more articles were identified by studying the cross-reference list. Among these 10,880 articles, 77 were considered potentially relevant and their full texts were retrieved for further evaluation, and 55 were excluded for various reasons (Fig. 1). Therefore, a total of 22 articles (5 cohort and 17 case-control studies) involving 11,696 subjects with CRA were used for this meta-analysis. Table 1 and Table 2 depict the characteristics of these studies. All these studies represented different populations, 4 studies were from Asia (Japan), 10 from North America, 7 from Europe, and 1 was from Israel. Most studies had relevant controls for some conventional risk factors, including BMI (n = 13), smoking (n = 13), physical activity (n = 11), and dietary energy intake (n = 15). Some studies were also adjusted for alcohol use (n = 9) and other dietary variables or nutrients (n = 6). The quality scores of each study were summarized in Supplementary Table 1, http://links.lww.com/MD/A455. The quality scores ranged from 5 to 9, with the median score of 8. The majority of the included studies (18/22) were of high quality (NOS score ≥7).
FIGURE 1.
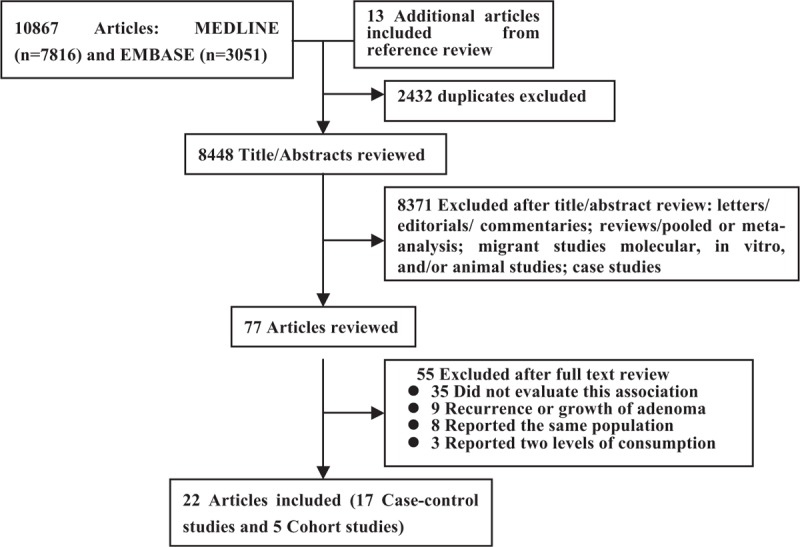
Flow diagram representing the systematic literature search on vegetables and fruits intake and CRA risk.
TABLE 1.
Characteristics of Case-Control Studies Involving Vegetables and Fruits Intake With Colorectal Adenoma Risk
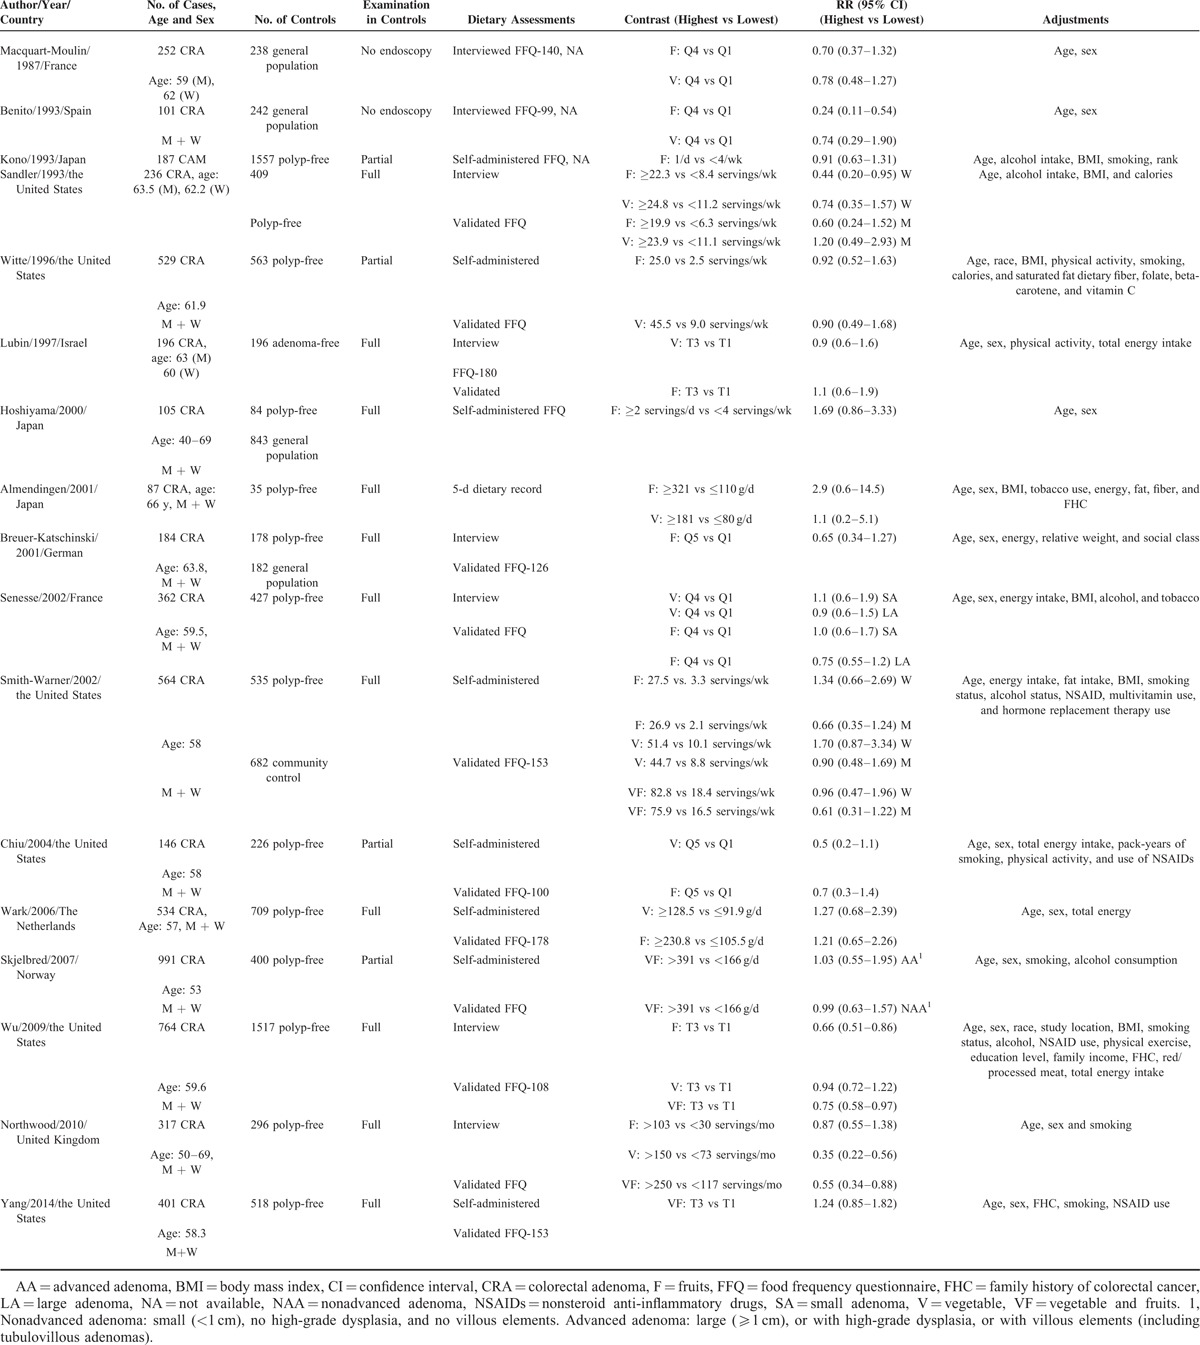
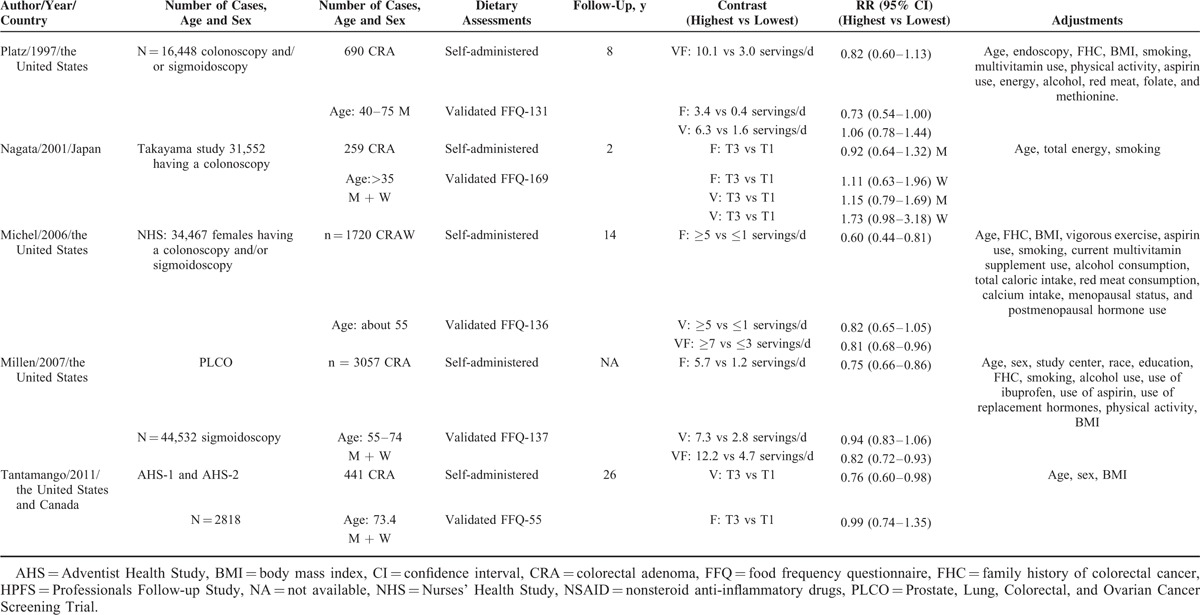
TABLE 2.
Characteristics of Cohort Studies Investigating the Effect of Vegetables and Fruits Intake on Colorectal Adenoma Risk
Total Vegetables and Fruits Combined
High Versus Low Analysis
Eight studies investigated the association between the highest versus lowest intake of vegetables and fruits combined and CRA risk. The SRR of 0.82 (95% CI: 0.75–0.91) was observed, with no evidence of heterogeneity (Pheterogeneity = 0.369, I2 = 7.9%; Fig. 2A).
FIGURE 2.
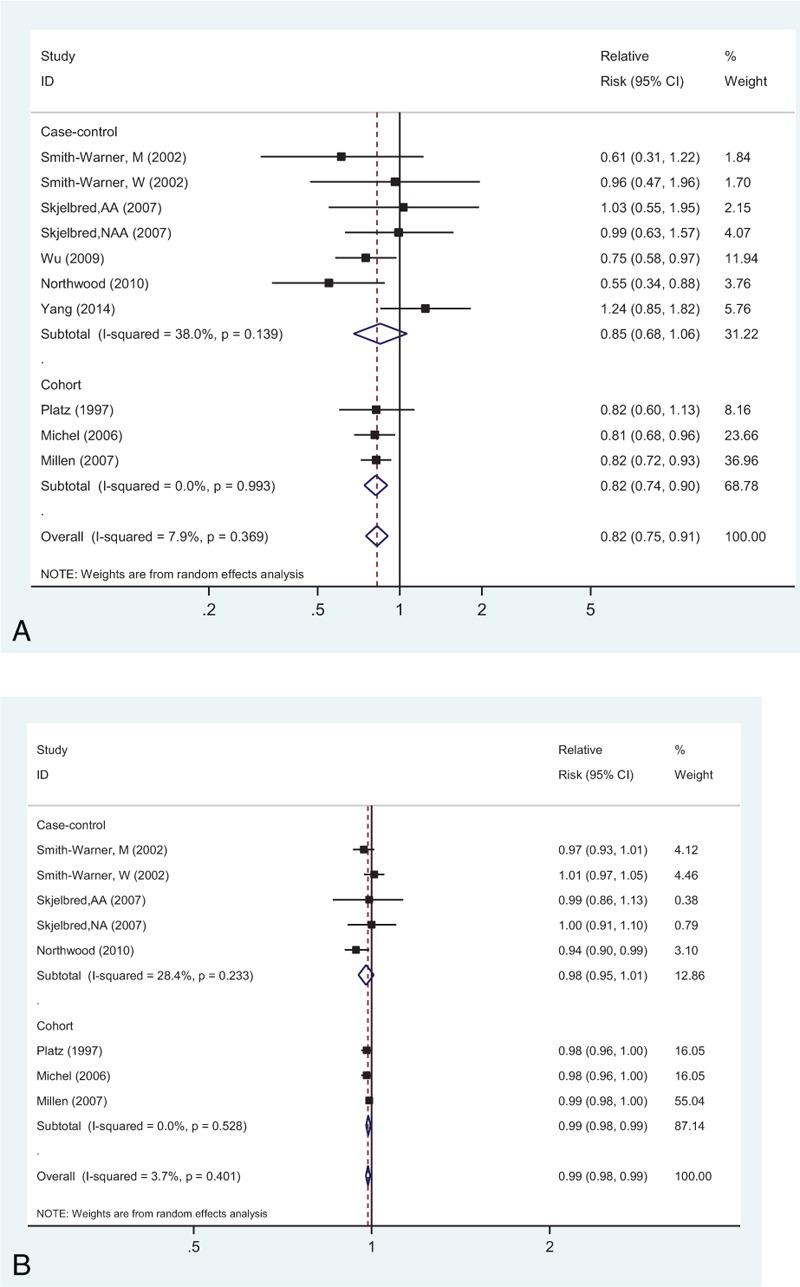
Analysis of combined vegetables and fruits intake with risk of colorectal adenoma: (A) high versus low analysis; (B) dose–response analyses for intake of 100 g/d increments.
Dose–Response Analysis
Six studies were part of this dose–response analysis (Figure 2B). The SRR value per 100 g/d increment of fruits and vegetables combined was 0.99 (95% CI: 0.98–0.99), with no evidence of heterogeneity (I2 = 3.7%, Pheterogeneity = 0.401). Moreover, there was no evident nonlinear association between intake of vegetables and fruits combined and CRA risk (Pnonlinearity = 0.101; Supplementary Figure 1A, http://links.lww.com/MD/A455).
Total Vegetables
High Versus Low Analysis
Seventeen studies investigated the association between the highest versus lowest vegetables intake and CRA risk. The observed SRR was 0.91 (95% CI: 0.80–1.02), with moderate heterogeneity (Pheterogeneity = 0.025, I2 = 41.5%; Fig. 3A).
FIGURE 3.
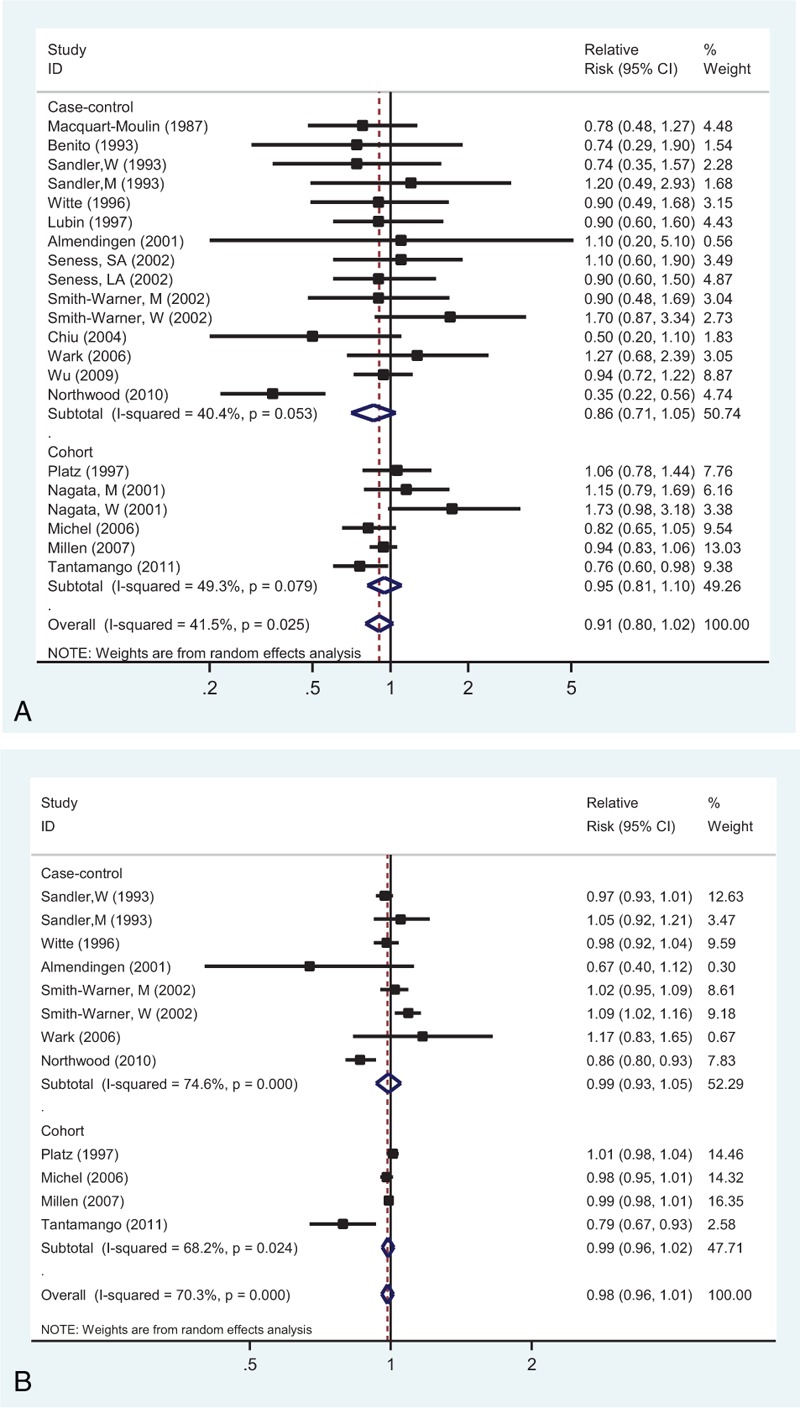
Analysis of vegetables intake with risk of colorectal adenoma: (A) high versus low intake; (B) dose–response analyses for intake of 100 g/d increment.
Dose–Response Analysis
Dose–response analysis was performed based on the data from 10 studies (Figure 3B). The SRR value per 100 g/d increment of vegetables was 0.98 (95% CI: 0.96–1.01), with evidence of high heterogeneity (I2 = 70.3%, Pheterogeneity < 0.001). In addition, there was a nonlinear association (Pnonlinearity = 0.024; Supplementary Figure 1B, http://links.lww.com/MD/A455).
Total Fruit
High Versus Low Analysis
Twenty studies representing the association between the highest versus lowest fruits intake and CRA risk were used for this analysis. The observed SRR was 0.79 (95% CI: 0.71–0.88), and there was a low heterogeneity (Pheterogeneity = 0.111, I2 = 27.0%; Fig. 4A).
FIGURE 4.
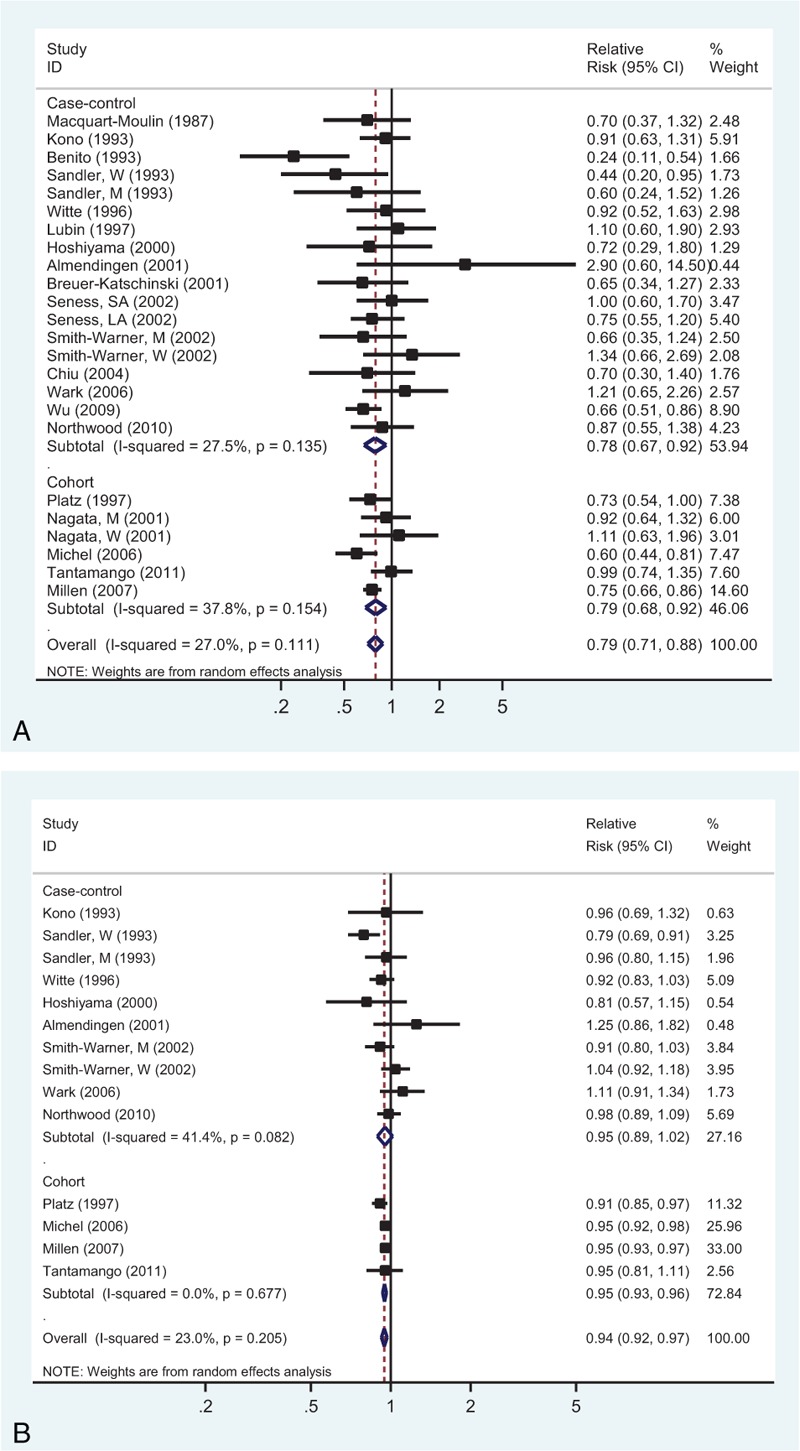
Analysis of fruits intake with risk of colorectal adenoma: (A) high versus low intake; (B) dose–response analyses for intake of 100 g/d increment.
Dose–Response Analysis
Dose–response analysis was achieved by including 12 studies (Figure 4B). The SRR value per 100 g/d increment of fruits was 0.94 (95% CI: 0.92–0.97), with low heterogeneity (I2 = 23.0%, Pheterogeneity = 0.205). There was no evident nonlinear association between fruits intake and CRA risk (Pnonlinearity = 0.583; Supplementary Figure 1C, http://links.lww.com/MD/A455).
Subgroup, Meta-Regression, and Sensitivity Analyses
In stratified analyses (Table 3), the association of high versus low intake of fruits and vegetables combined or separately with CRA risk suggested an inverse associations in studies conducted in Western countries, but not in the Asian countries. The stratified analysis based on sex demonstrated that intake of fruits had statistically significant associations for men (SRR = 0.81; 95% CI: 0.67–0.97), but not for women (SRR = 0.78; 95% CI: 0.49–1.24).
TABLE 3.
Stratified Meta-Analyses of Vegetables and Fruits Intake and Colorectal Adenoma Risk: High Versus Low Analysis
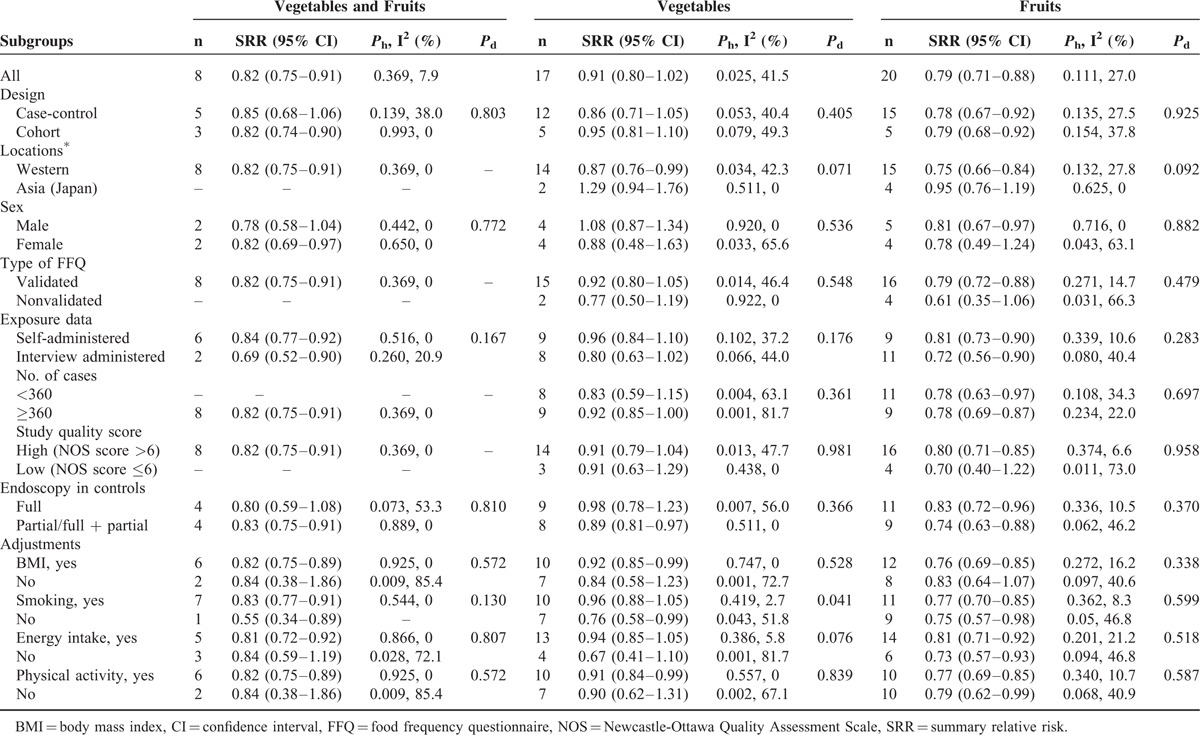
In meta-regression analyses (Table 3), the heterogeneity for association between fruits and vegetables was significant (P for difference = 0.092 and 0.071, respectively) based on the geographical locations. Furthermore, in the case of vegetables intake, confounders adjusted for smoking (P for difference = 0.041) and total energy intake (P for difference = 0.076) appeared to be the significant factors determining its association with CRA risk. Adjustments for smoking and total energy intake significantly attenuated the protective role of vegetables consumption.
We confirmed the stability of this inverse association by calculating the overall homogeneity and effect size by removing one study at a time (data not shown). Moreover, repeated analysis of high versus low intake using the studies included in the linear dose–response analysis for intake produced results that were similar to those of the original analysis (fruit and vegetables combined: SRR = 0.81; 95% CI: 0.74–0.89; vegetable: SRR = 0.87; 95% CI: 0.73–1.04; fruit: SRR = 0.80; 95% CI: 0.70–0.91).
Publication Bias
Egger test revealed the publication bias (P = 0.040) for intake of vegetables and fruits combined, whereas Begg test did not confirm this (P = 0.993; Supplementary Figure 2A, http://links.lww.com/MD/A455). The trim-and-fill method suggested that no additional risk estimate was required to balance the funnel plot. In case of vegetables intake, there was no indication of publication bias by both Egger test (P = 0.278) and Begg test (P = 0.740; Supplementary Figure 2B, http://links.lww.com/MD/A455). But for fruit intake, Egger test revealed evidence of publication bias (P = 0.003), but Begg test did not (P = 0.941; Supplementary Figure 2C, http://links.lww.com/MD/A455). Moreover, the trim-and-fill method indicated that 2 additional risk estimates were needed to balance the funnel plot, and the summary risk estimates were similar (SRR = 0.78; 95% CI: 0.69–0.87).
DISCUSSION
The overall results of this meta-analysis suggested that intake of fruits was associated with significant reductions in the risk of CRA in both case control and cohorts studies. There was a risk reduction by 21% in high versus low analysis, and 6% in 100 g/d increment of fruit consumption. To our knowledge, this is the first report suggesting a linear inverse association between intake of fruits and CRA risk.
Associations between intake of vegetables and fruits and CRA risk have been inconsistently reported among different observational studies. Some prospective studies22–26 have shown a reduced risk in subjects with high intake of fruits and vegetables combined or just fruits, but not with high consumption of vegetables. In contrast, some other studies27,28 observed opposite results. This disparity can be explained by several factors, including potential bias in each study, the definition and range of dietary intake, the limitations of currently available dietary assessment tools, and the potential confounders for which analyses were adjusted. Furthermore, randomized intervention trials on this topic also indicated that the adoption of diet higher in fruits and vegetables did not affect the recurrence of CRAs40–42 or rectal mucosal cell proliferation rates.43 The tentative biological explanation for this inconsistency can be correlated to the nutritional factors that affect critical events in colorectal carcinogenesis at molecular, cellular, or tissue level, well before polyps are formed.40 In addition, the clinical trials always included high-risk populations (ie, subjects with histories of adenoma), whereas the observational studies examined average-risk populations. In addition, the clinical trials might be subjected to shorter follow-up periods and smaller quantities of consumption, and thus explain this discrepancy.
Our data on the associations between intake of vegetables and fruits together or alone and CRA44 suggested a significant inverse association among studies carried out in Western populations, but a null association was observed among Asian studies (Japan). These differences can be attributed not only to the differences in genetic susceptibility, but also to the different types of fruits and vegetables consumed and types of methods used for production, storage conditions, nutrient content, and cooking/preparation in each study. In addition, the lower number of Asian studies (4 for fruit intake and 2 for vegetables intake) represented low statistical power and hence limited the overall results. Thus, more studies from Asian population are needed to demonstrate this association.
Based on the stratified analysis according to sex, we observed a significantly reduced CRA risk for men, but not for women in terms of fruit intake; however, consumption of vegetables did not show any associations in either sex. Although AA data were very informative with regard to the preventive strategies of CRC, we could not study this association because of the unavailability of sufficient data. Millen et al24 have reported that intake of fruits, but not vegetables, was associated with reduced risk for both NAA and AA. Another report from Skjelbred et al25 observed a null association of both NAA and AA with combined intake of vegetables and fruits. Similarly, insufficient data were available for colon and rectal adenoma. Millen et al24 have shown that intake of fruits was associated with reduced risk of colon adenoma (OR = 0.70, 95% CI: 0.60–0.82), but not rectal adenoma (OR = 0.89, 95% CI: 0.68–1.16). In contrast, a case-control study by Kono et al10 detected no association between fruits intake and colon adenoma risk. Another study24 presented results for single and multiple (≥2) adenomas, and found that increased intake of fruits, but not vegetables, was significantly related to the decreased risk of single and multiple (≥2) adenomas. These results, thus, should be interpreted with caution because the current analysis was based on only very few studies. Hence, more studies with sufficient number of data points based on sex, histopathology (nonadvanced or advanced), or location (colon or rectum) are required for a comprehensive analysis about this association.
We observed inverse association between CRA risk and intake of fruits, but not vegetables, and it can be explained through several potential mechanisms. Although both the fruits and vegetables are good sources of various antioxidants, vitamins, dietary fiber, folate, and flavonoids, there were different effects of these constituents on colorectal carcinogenesis. For example, our previous meta-analysis45 and other prospective cohort studies46,47 have suggested that increased dietary fiber intake may lead to decreased risk of colorectal neoplasm. Furthermore, a statistically significant inverse association was observed between CRA and fiber from fruits and cereals, but not from vegetables.45
Furthermore, our study has several strengths. The combined sample size was large and included several prospective cohort studies. CRA outcomes in all studies were ascertained using endoscopy and pathohistological findings. In most of the studies, the risk estimates from the fully adjusted models were used for analyses to reduce the potential of confounding. The dose–response analysis was conducted to evaluate the linear and nonlinear relations, which helps to quantify and test the shape of these associations. We performed several sensitivity analysis based on sex, geographic locations, study quality score, exposure assessment, and important confounding factors.
However, there were also several limitations of this meta-analysis. First was the problem of measurement errors in the assessment of dietary intake. To cover this aspect, we included studies evaluating all fruits or vegetables, but there were differences in their classifications and types consumed in studies from different regions, ethnicities, and time periods. All these had the potential to affect our results. Indeed, our subgroup analyses showed that the associations between consumption of fruits and vegetables with CRA risk differ significantly by study location. Most of the included studies (18/22) used a validated FFQ to evaluate the consumption of fruit and vegetables. However, subgroup analysis suggested that the use of a validated or unvalidated FFQ did not significantly change the risk associations. It is very difficult for persons to accurately report their intake of vegetables or fruits, reflecting the relatively low correlation in validated studies (Spearman correlation coefficients of 0.6 for fruits consumption and 0.4 for vegetables consumption as demonstrated in previous studies).48,49 Measurement errors can also occur when intake levels are calculated based on different units. These measurement errors can lead to the attenuation of risk estimates and the true associations might be stronger than we observed,50,51 and thus strengthening our conclusion of protective effects of fruits on CRA risk.
In addition, there is a possibility of skewing the risk estimates toward null, if there is a misclassification of certain controls because of high rates of incomplete colonoscopies. However, stratified analyses based on type of endoscope in controls observed a similar summary risk estimates for studies with complete versus incomplete colonoscopies.
Second, unmeasured or uncontrolled confounders inherited from observational studies were another concern. Higher intakes of fruits and vegetables may be a marker for generally “healthier” dietary and lifestyle patterns such as a lower prevalence of tobacco smoking and overweight/obesity, drinking less alcohol, and being physically active.52,53 In addition, adjustment for total energy intake was important to account for the potential confounding factors because of dietary correlates in nutritional studies.54 Importantly, stratification based on adjustment for smoking status and total energy intake did significantly change the risk associations for vegetables intake. These results indicated that smoking status and total energy intake may have a residual confounding effect on the association between consumption of vegetables and adenoma risk. Smoking causes oxidative stress and DNA damage in the body, and active smokers have lower blood concentrations of ascorbic acid, alpha-carotene, beta-carotene, which explains why smokers benefit more from consumption of vegetables and fruits.55
Third, moderate heterogeneity was observed among different studies, which can be attributed to the study design, geographic locations, number of cases, method of exposure measurement (eg, self- vs interviewer-administered questionnaires, type of FFQ), classification of vegetables, and fruits intake and adjustment for confounders. Indeed, the subgroup meta-analysis based on geographic locations showed that Asian studies had little variability, whereas significant heterogeneity was observed among Western studies on vegetables intake. Moreover, analyses of high versus low intake were limited because they did not account for true differences among studies at the level and range of intake, thus contributing to the heterogeneity between the results. But when we repeated the high versus low analyses with the same studies that were included in the dose–response analysis, results were not changed.
Finally, publication bias was also a concern because small studies with null results tend to be less published. Egger test did provide evidence of such bias; however, the results obtained from funnel plot and Begg tests did not provide evidence for publication bias. Furthermore, the trim-and-fill method showed that 2 additional risk estimates were required to balance the funnel plot for studies on fruits consumption, whereas the SRRs remained unchanged.
To summarize, the current meta-analysis supported the hypothesis that a high intake of fruits, but not vegetables, was inversely associated with CRA risk. Further studies with prospective designs, that use validated questionnaires and controls for important confounders, would be required to verify our findings.
Footnotes
Abbreviations: BMI = body mass index, CRA = colorectal adenoma, CRC = colorectal cancer, FFQ = food frequency questionnaires, NAA/AA = nonadvanced/advanced adenoma, NOS = Newcastle-Ottawa Quality Assessment Scale.
Authors’ contributions—YY and QB designed the study; QB, JZ, LY, and YS conducted the search and data extraction; QB, JL, and JZ collected the data; QB, LW, and JZ analyzed the data and wrote the manuscript. All authors read and approved the final content.
QBen and JZ contributed equally to this manuscript.
The authors have no funding and conflicts of interest to disclose.
Supplemental digital content is available for this article
Supplemental digital content is available for this article. Direct URL citations appear in the printed text and are provided in the HTML and PDF versions of this article on the journal's Website (www.md-journal.com).
REFERENCES
- 1.Siegel RL, Miller KD, Jemal A. Cancer statistics, 2015. CA Cancer J Clin 2015; 65:5–29. [DOI] [PubMed] [Google Scholar]
- 2.Botteri E, Iodice S, Raimondi S, et al. Cigarette smoking and adenomatous polyps: a meta-analysis. Gastroenterology 2008; 134:388–395. [DOI] [PubMed] [Google Scholar]
- 3.Ben Q, An W, Jiang Y, et al. Body mass index increases risk for colorectal adenomas based on meta-analysis. Gastroenterology 2012; 142:762–772. [DOI] [PubMed] [Google Scholar]
- 4.Wolin KY, Yan Y, Colditz GA. Physical activity and risk of colon adenoma: a meta-analysis. Br J Cancer 2011; 104:882–885. [DOI] [PMC free article] [PubMed] [Google Scholar]
- 5.Khuda-Bukhsh AR, Das S, Saha SK. Molecular approaches toward targeted cancer prevention with some food plants and their products: inflammatory and other signal pathways. Nutr Cancer 2014; 66:194–205. [DOI] [PubMed] [Google Scholar]
- 6.World Cancer Research Fund/American Institute for Cancer Research. Policy and Action for Cancer Prevention. Food, Nutrition, and Physical Activity: A Global Perspective. Washington, DC: AICR; 2007. [Google Scholar]
- 7.World Cancer Research Fund/American Institute for Cancer Research. Continuous Update Project Report for Cancer Prevention: Food, Nutrition, and Physical Activity: A Global Perspective. Washington, DC: AICR; 2011. [Google Scholar]
- 8.Macquart-Moulin G, Riboli E, Cornee J, et al. Colorectal polyps and diet: a case-control study in Marseilles. Int J Cancer 1987; 40:179–188. [DOI] [PubMed] [Google Scholar]
- 9.Benito E, Cabeza E, Moreno V, et al. Diet and colorectal adenomas: a case-control study in Majorca. Int J Cancer 1993; 55:213–219. [DOI] [PubMed] [Google Scholar]
- 10.Kono S, Imanishi K, Shinchi K, et al. Relationship of diet to small and large adenomas of the sigmoid colon. Jpn J Cancer Res 1993; 84:13–19. [DOI] [PMC free article] [PubMed] [Google Scholar]
- 11.Sandler RS, Lyles CM, Peipins LA, et al. Diet and risk of colorectal adenomas: macronutrients, cholesterol, and fiber. J Natl Cancer Inst 1993; 85:884–891. [DOI] [PubMed] [Google Scholar]
- 12.Witte JS, Longnecker MP, Bird CL, et al. Relation of vegetable, fruit, and grain consumption to colorectal adenomatous polyps. Am J Epidemiol 1996; 144:1015–1025. [DOI] [PubMed] [Google Scholar]
- 13.Lubin F, Rozen P, Arieli B, et al. Nutritional and lifestyle habits and water-fiber interaction in colorectal adenoma etiology. Cancer Epidemiol Biomarkers Prev 1997; 6:79–85. [PubMed] [Google Scholar]
- 14.Platz EA, Giovannucci E, Rimm EB, et al. Dietary fiber and distal colorectal adenoma in men. Cancer Epidemiol Biomarkers Prev 1997; 6:661–670. [PubMed] [Google Scholar]
- 15.Hoshiyama Y, Kono S, Sasaba T, et al. Relation of cigarette smoking, alcohol use, and dietary habits to colon adenomas: a case-control study in Saitama, Japan. Asian Pac J Cancer Prev 2000; 1:139–146. [PubMed] [Google Scholar]
- 16.Almendingen K, Hofstad B, Trygg K, et al. Current diet and colorectal adenomas: a case-control study including different sets of traditionally chosen control groups. Eur J Cancer Prev 2001; 10:395–406. [DOI] [PubMed] [Google Scholar]
- 17.Breuer-Katschinski B, Nemes K, Marr A, et al. Colorectal adenomas and diet: a case-control study. Colorectal Adenoma Study Group. Dig Dis Sci 2001; 46:86–95. [DOI] [PubMed] [Google Scholar]
- 18.Nagata C, Shimizu H, Kametani M, et al. Diet and colorectal adenoma in Japanese males and females. Dis Colon Rectum 2001; 44:105–111. [DOI] [PubMed] [Google Scholar]
- 19.Senesse P, Boutron-Ruault MC, Faivre J, et al. Foods as risk factors for colorectal adenomas: a case-control study in Burgundy (France). Nutr Cancer 2002; 44:7–15. [DOI] [PubMed] [Google Scholar]
- 20.Smith-Warner SA, Elmer PJ, Fosdick L, et al. Fruits, vegetables, and adenomatous polyps: the Minnesota Cancer Prevention Research Unit case-control study. Am J Epidemiol 2002; 155:1104–1113. [DOI] [PubMed] [Google Scholar]
- 21.Chiu BC, Gapstur SM. Changes in diet during adult life and risk of colorectal adenomas. Nutr Cancer 2004; 49:49–58. [DOI] [PubMed] [Google Scholar]
- 22.Michels KB, Giovannucci E, Chan AT, et al. Fruit and vegetable consumption and colorectal adenomas in the Nurses’ Health Study. Cancer Res 2006; 66:3942–3953. [DOI] [PubMed] [Google Scholar]
- 23.Wark PA, Van der Kuil W, Ploemacher J, et al. Diet, lifestyle and risk of K-ras mutation-positive and -negative colorectal adenomas. Int J Cancer 2006; 119:398–405. [DOI] [PubMed] [Google Scholar]
- 24.Millen AE, Subar AF, Graubard BI, et al. Fruit and vegetable intake and prevalence of colorectal adenoma in a cancer screening trial. Am J Clin Nutr 2007; 86:1754–1764. [DOI] [PubMed] [Google Scholar]
- 25.Skjelbred CF, Saebo M, Hjartaker A, et al. Meat, vegetables and genetic polymorphisms and the risk of colorectal carcinomas and adenomas. BMC Cancer 2007; 7:228. [DOI] [PMC free article] [PubMed] [Google Scholar]
- 26.Wu H, Dai Q, Shrubsole MJ, et al. Fruit and vegetable intakes are associated with lower risk of colorectal adenomas. J Nutr 2009; 139:340–344. [DOI] [PMC free article] [PubMed] [Google Scholar]
- 27.Northwood EL, Elliott F, Forman D, et al. Polymorphisms in xenobiotic metabolizing enzymes and diet influence colorectal adenoma risk. Pharmacogenet Genomics 2010; 20:315–326. [DOI] [PubMed] [Google Scholar]
- 28.Tantamango YM, Knutsen SF, Beeson WL, et al. Foods and food groups associated with the incidence of colorectal polyps: the Adventist Health Study. Nutr Cancer 2011; 63:565–572. [DOI] [PMC free article] [PubMed] [Google Scholar]
- 29.Yang B, Thyagarajan B, Gross MD, et al. No evidence that associations of incident, sporadic colorectal adenoma with its major modifiable risk factors differ by chromosome 8q24 region rs6983267 genotype. Mol Carcinog 2014; 53 suppl 1:E193–E200. [DOI] [PubMed] [Google Scholar]
- 30.Moher D, Liberati A, Tetzlaff J, et al. Preferred reporting items for systematic reviews and meta-analyses: the PRISMA statement. Ann Intern Med 2009; 151:264–269. [DOI] [PubMed] [Google Scholar]
- 31.Wells GA SB, O’Connell D, Peterson J, Welch V, Losos M, Tugwell P. The Newcastle-Ottawa Scale (NOS) for assessing the quality of nonrandomised studies in meta-analyses. Available at: http://www.ohri.ca/programs/clinical_epidemiology/oxford.asp Accessed June 15, 2012. [Google Scholar]
- 32.DerSimonian R, Laird N. Meta-analysis in clinical trials. Control Clin Trials 1986; 7:177–188. [DOI] [PubMed] [Google Scholar]
- 33.Higgins JP, Thompson SG, Deeks JJ, et al. Measuring inconsistency in meta-analyses. BMJ 2003; 327:557–560. [DOI] [PMC free article] [PubMed] [Google Scholar]
- 34.Greenland S, Longnecker MP. Methods for trend estimation from summarized dose-response data, with applications to meta-analysis. Am J Epidemiol 1992; 135:1301–1309. [DOI] [PubMed] [Google Scholar]
- 35.Orsini NBR, Greenland S. Generalized least squares for trend estimation of summarized dose-response data. BMC Cancer 2006; 6:40–57.16504081 [Google Scholar]
- 36.Royston P. A strategy for modelling the effect of a continuous covariate in medicine and epidemiology. Stat Med 2000; 19:1831–1847. [DOI] [PubMed] [Google Scholar]
- 37.Begg CB, Mazumdar M. Operating characteristics of a rank correlation test for publication bias. Biometrics 1994; 50:1088–1101. [PubMed] [Google Scholar]
- 38.Egger M, Davey Smith G, Schneider M, et al. Bias in meta-analysis detected by a simple, graphical test. BMJ 1997; 315:629–634. [DOI] [PMC free article] [PubMed] [Google Scholar]
- 39.Duval S, Tweedie R. Trim and fill: a simple funnel-plot-based method of testing and adjusting for publication bias in meta-analysis. Biometrics 2000; 56:455–463. [DOI] [PubMed] [Google Scholar]
- 40.Schatzkin A, Lanza E, Corle D, et al. Lack of effect of a low-fat, high-fiber diet on the recurrence of colorectal adenomas. Polyp Prevention Trial Study Group. N Engl J Med 2000; 342:1149–1155. [DOI] [PubMed] [Google Scholar]
- 41.Robertson DJ, Sandler RS, Haile R, et al. Fat, fiber, meat and the risk of colorectal adenomas. Am J Gastroenterol 2005; 100:2789–2795. [DOI] [PubMed] [Google Scholar]
- 42.Lanza E, Hartman TJ, Albert PS, et al. High dry bean intake and reduced risk of advanced colorectal adenoma recurrence among participants in the polyp prevention trial. J Nutr 2006; 136:1896–1903. [DOI] [PMC free article] [PubMed] [Google Scholar]
- 43.Pfeiffer R, McShane L, Wargovich M, et al. The effect of a low-fat, high fiber, fruit and vegetable intervention on rectal mucosal proliferation. Cancer 2003; 98:1161–1168. [DOI] [PubMed] [Google Scholar]
- 44.Aune D, Lau R, Chan DS, et al. Nonlinear reduction in risk for colorectal cancer by fruit and vegetable intake based on meta-analysis of prospective studies. Gastroenterology 2011; 141:106–118. [DOI] [PubMed] [Google Scholar]
- 45.Ben Q, Sun Y, Chai R, et al. Dietary fiber intake reduces risk for colorectal adenoma: a meta-analysis. Gastroenterology 2014; 146:689–699. [DOI] [PubMed] [Google Scholar]
- 46.McCarl M, Harnack L, Limburg PJ, et al. Incidence of colorectal cancer in relation to glycemic index and load in a cohort of women. Cancer Epidemiol Biomarkers Prev 2006; 15:892–896. [DOI] [PubMed] [Google Scholar]
- 47.Nomura AM, Hankin JH, Henderson BE, et al. Dietary fiber and colorectal cancer risk: the multiethnic cohort study. Cancer Causes Control 2007; 18:753–764. [DOI] [PubMed] [Google Scholar]
- 48.Yamaji T, Inoue M, Sasazuki S, et al. Fruit and vegetable consumption and squamous cell carcinoma of the esophagus in Japan: the JPHC study. Int J Cancer 2008; 123:1935–1940. [DOI] [PubMed] [Google Scholar]
- 49.Steevens J, Schouten LJ, Goldbohm RA, et al. Vegetables and fruits consumption and risk of esophageal and gastric cancer subtypes in the Netherlands Cohort Study. Int J Cancer 2011; 129:2681–2693. [DOI] [PubMed] [Google Scholar]
- 50.Prentice RL. Dietary assessment and the reliability of nutritional epidemiology reports. Lancet 2003; 362:182–183. [DOI] [PubMed] [Google Scholar]
- 51.Willett WC, Sampson L, Stampfer MJ, et al. Reproducibility and validity of a semiquantitative food frequency questionnaire. Am J Epidemiol 1985; 122:51–65. [DOI] [PubMed] [Google Scholar]
- 52.George SM, Park Y, Leitzmann MF, et al. Fruit and vegetable intake and risk of cancer: a prospective cohort study. Am J Clin Nutr 2009; 89:347–353. [DOI] [PMC free article] [PubMed] [Google Scholar]
- 53.van Duijnhoven FJ, Bueno-De-Mesquita HB, Ferrari P, et al. Fruit, vegetables, and colorectal cancer risk: the European Prospective Investigation into Cancer and Nutrition. Am J Clin Nutr 2009; 89:1441–1452. [DOI] [PubMed] [Google Scholar]
- 54.Willett WC, Howe GR, Kushi LH. Adjustment for total energy intake in epidemiologic studies. Am J Clin Nutr 1997; 65:1220S–1228S. [DOI] [PubMed] [Google Scholar]
- 55.Yuan JM, Ross RK, Gao YT, et al. Prediagnostic levels of serum micronutrients in relation to risk of gastric cancer in Shanghai, China. Cancer Epidemiol Biomarkers Prev 2004; 13:1772–1780. [PubMed] [Google Scholar]