

Significance
Chronic reduction of synaptic activity in neural networks leads to compensatory changes at both excitatory and inhibitory synapses, a phenomenon known as homeostatic synaptic plasticity. Postsynaptic activity/Ca2+-dependent regulation of retinoic acid (RA) synthesis is critically involved in homeostatic synaptic plasticity; however, the signaling molecule that gates RA synthesis in response to Ca2+ level changes remains unknown. Using pharmacologic and genetic manipulations, we show that calcineurin (CaN) activity, which is regulated by postsynaptic Ca2+ levels, directly controls RA synthesis. Inhibiting CaN activity or genetic ablation of CaN leads to homeostatic modulation of synaptic transmission in an RA signaling-dependent manner. These findings uncover the molecular mechanism by which activity regulates synaptic strength through RA synthesis.
Keywords: retinoic acid, retinoic acid receptor RARα, homeostatic synaptic plasticity, calcineurin, AMPA receptor trafficking
Abstract
Homeostatic synaptic plasticity is a form of non-Hebbian plasticity that maintains stability of the network and fidelity for information processing in response to prolonged perturbation of network and synaptic activity. Prolonged blockade of synaptic activity decreases resting Ca2+ levels in neurons, thereby inducing retinoic acid (RA) synthesis and RA-dependent homeostatic synaptic plasticity; however, the signal transduction pathway that links reduced Ca2+-levels to RA synthesis remains unknown. Here we identify the Ca2+-dependent protein phosphatase calcineurin (CaN) as a key regulator for RA synthesis and homeostatic synaptic plasticity. Prolonged inhibition of CaN activity promotes RA synthesis in neurons, and leads to increased excitatory and decreased inhibitory synaptic transmission. These effects of CaN inhibitors on synaptic transmission are blocked by pharmacological inhibitors of RA synthesis or acute genetic deletion of the RA receptor RARα. Thus, CaN, acting upstream of RA, plays a critical role in gating RA signaling pathway in response to synaptic activity. Moreover, activity blockade-induced homeostatic synaptic plasticity is absent in CaN knockout neurons, demonstrating the essential role of CaN in RA-dependent homeostatic synaptic plasticity. Interestingly, in GluA1 S831A and S845A knockin mice, CaN inhibitor- and RA-induced regulation of synaptic transmission is intact, suggesting that phosphorylation of GluA1 C-terminal serine residues S831 and S845 is not required for CaN inhibitor- or RA-induced homeostatic synaptic plasticity. Thus, our study uncovers an unforeseen role of CaN in postsynaptic signaling, and defines CaN as the Ca2+-sensing signaling molecule that mediates RA-dependent homeostatic synaptic plasticity.
Synaptic plasticity, a fundamental feature of the nervous system, is defined as modification of synaptic strength based on experience and activity history. Homeostatic synaptic plasticity is a type of compensatory mechanism activated during chronic elevation or reduction of network activity to modulate synaptic strength in the opposite direction (for example, reduced network activity leads to increased synaptic strength) (1, 2). Retinoic acid (RA) is a key signaling molecule in a form of homeostatic synaptic plasticity induced by reduced excitatory synaptic activity (3–5). Prolonged inhibition of excitatory synaptic transmission leads to a compensatory increase in synaptic excitation and a decrease in synaptic inhibition (4, 5). Both of these processes require RA synthesis. It also has been shown that dendritic Ca2+ levels directly govern the synthesis of RA; basal Ca2+ levels maintained by normal synaptic transmission are sufficient to suppress RA synthesis. Upon synaptic activity inhibition, reduced Ca2+ levels de-repress RA synthesis and activate RA-dependent homeostatic synaptic mechanisms (6). Thus, a Ca2+-dependent signaling molecule that is sensitive to changes in basal Ca2+ levels must be involved in synaptic RA signaling.
Ca2+-dependent protein kinases and phosphatases are critical components of signaling pathways involved in synaptic plasticity (7, 8). For example, regulation of the phosphorylation of key serine residues in the C-terminal sequences of the α-amino-3-hydroxy-5-methyl-4-isoxazolepropionic acid (AMPA) type glutamate receptor (AMPAR) subunit GluA1 by kinases (i.e., PKA, PKC, and CaMKII) and phosphatases [i.e., calcineurin (CaN) and PP2A] is thought to play major roles in governing AMPAR trafficking in and out of the synaptic membrane and to mediate the expression of well-established forms of synaptic plasticity, such as long-term potentiation (LTP) and long-term depression (LTD) (9–12). A recent study examining the stoichiometry of AMPAR phosphorylation revealed surprisingly low levels of phosphorylated GluA1 in neurons (13), however, suggesting that the phosphorylation of AMPARs might not be involved in homeostatic plasticity, and that other mechanisms may be in play.
In the present study, we identified CaN as the Ca2+-dependent signaling molecule that regulates RA synthesis in neurons in an activity-dependent manner. Inhibition of CaN activity triggers RA synthesis, suggesting that basal CaN activity, supported by normal synaptic transmission, is sufficient to suppress RA synthesis in an active neural network. In CaN-deficient neurons, synaptic activity blockade-induced RA-dependent forms of homeostatic synaptic plasticity are absent. Similar to direct RA application, CaN inhibition enhances excitatory synaptic transmission and reduces inhibitory synaptic transmission. Blocking RA synthesis or genetic deletion of the RA receptor RARα prevents CaN inhibitor-induced regulation of synaptic strength, indicating that CaN acts upstream of RA. Importantly, neurons bearing GluA1 S831A or S845A knockin (KI) mutations, which eliminate phosphorylation at these two serine residues, respond normally to CaN inhibitors and RA treatment. Taken together, our results indicate that CaN participates in RA-dependent homeostatic synaptic plasticity through regulation of RA synthesis independent of the modulation of GluA1 phosphorylation.
Results
Prolonged Blockade of CaN Activity Induces RA Synthesis.
Our previous findings suggested that intracellular Ca2+ suppresses RA synthesis during normal synaptic transmission (6), likely through a Ca2+-activated target protein. Thus, we reasoned that inhibiting the activity of the relevant target for Ca2+ should trigger RA synthesis in neurons. We screened for such Ca2+-activated targets using a combination of shRNA-based and pharmacology-based methods, along with a previously established RA synthesis reporter system (4, 6). We found that inhibiting CaN, a Ca2+/calmodulin-dependent serine-threonine phosphatase, significantly increased RA synthesis in cultured rat hippocampal neurons. Specifically, similar to the effect of RA and activity blockers [tetrodotoxin (TTX) plus the AMPAR antagonist 6-cyano-7-nitroquinoxaline-2,3-dione (CNQX) (TTX+CNQX)], treating neurons with FK506, a CaN inhibitor, for 10 h after transfection of an RA response element (RARE)-based GFP reporter significantly increased expression of the RA reporter (Fig. 1A). The increase in RARE-GFP reporter expression was due to RA synthesis, because it could be blocked by N,N-diethylaminobenzaldehyde (DEAB), a drug that inhibits the RA synthesis enzymes retinal dehydrogenases (RALDHs) (14) (Fig. 1A). FK1012, a derivative of FK506 that does not inhibit CaN activity (15), failed to increase RARE-GFP reporter expression (Fig. 1A).
Fig. 1.

Inhibition of CaN activity induces RA synthesis and RA-dependent regulation of synaptic transmission. (A) Sample images (Left) and quantification (Right) of RA synthesis reporter RARE-GFP expression in cultured hippocampal neurons. Here 10 d in vitro (DIV) neurons were transfected with the RARE-GFP reporter and treated with activity blockers or CaN inhibitor. Expression levels are normalized to DMSO controls: RA, 297.86 ± 23.00%; DEAB, 80.30 ± 8.97%; TTX+CNQX, 175.07 ± 17.22%; TTX+CNQX+DEAB, 79.42 ± 8.78%; FK506, 146.95 ± 13.30%; FK+DEAB, 78.18 ± 6.68%; FK1012, 82.57 ± 10.39%. **P < 0.01; ***P < 0.005, one-way ANOVA. (B) Example traces (Left) and quantification (Right) for mEPSC amplitudes and frequencies recorded from neurons treated with DMSO (36 h), CsA (36 h), RA (4 h), and CsA (36 h) + RA (4 h). Amplitudes: DMSO, 11.56 ± 0.34 pA; CsA, 13.16 ± 0.57 pA; RA, 12.75 ± 0.38 pA; CsA+RA, 13.36 ± 0.48 pA. *P < 0.05; **P < 0.01. Frequencies: DMSO, 0.49 ± 0.07 Hz; CsA, 0.44 ± 0.10 Hz; RA, 0.37 ± 0.05 Hz; CsA+RA, 0.40 ± 0.05 Hz. P > 0.5, one-way ANOVA. (C) Example traces (Left) and quantification (Right) for mIPSC amplitudes and frequencies recorded from neurons treated with DMSO (36 h), CsA (36 h), RA (4 h), and CsA (36 h) + RA (4 h). Amplitudes: DMSO, 22.69 ± 1.01 pA; CsA, 16.61 ± 0.58 pA; RA, 14.86 ± 0.30 pA; CsA+RA, 15.10 ± 0.35 pA. ***P < 0.005. Frequencies: DMSO, 0.82 ± 0.08 Hz; CsA, 0.88 ± 0.08 Hz; RA, 0.60 ± 0.08 Hz; CsA+RA, 0.74 ± 0.12 Hz. P > 0.5, one-way ANOVA. (D) Summary of mEPSC amplitudes and frequencies recorded from neurons receiving treatment with CaN inhibitors with or without DEAB, and with FK1012 and okadaic acid (all treatments for 36 h). Amplitudes: DMSO, 11.98 ± 0.33 pA; FK506, 13.90 ± 0.64 pA; FK506+DEAB, 11.05 ± 0.24 pA; CsA, 14.70 ± 0.61 pA; CsA+DEAB, 11.73 ± 0.42 pA; FK1012, 12.07 ± 0.64 pA; OA, 10.77 ± 0.32. ***P < 0.005, one-way ANOVA. Frequencies: DMSO, 0.34 ± 0.04 Hz; FK506, 0.36 ± 0.06 Hz; FK506 ± DEAB, 0.32 ± 0.04 Hz; CsA, 0.42 ± 0.05 Hz; CsA+DEAB, 0.44 ± 0.07 Hz; FK1012, 0.36 ± 0.04 Hz; OA, 0.24 ± 0.03 Hz. (E) Summary of mIPSC amplitudes and frequencies recorded from neurons receiving treatments of CaN inhibitors with or without DEAB, and with FK1012 and okadaic acid (all treatments for 36 h). Amplitudes: DMSO, 24.22 ± 0.64 pA; FK506, 18.05 ± 0.61 pA; FK506+DEAB, 24.29 ± 1.53 pA; CsA, 17.99 ± 0.68 pA; CsA+DEAB, 24.40 ± 0.89 pA; FK1012, 25.27 ± 1.15 pA; OA, 24.58 ± 0.82. ***P < 0.005, one-way ANOVA. Frequencies: DMSO, 1.07 ± 0.08 Hz; FK506, 1.10 ± 0.09 Hz; FK506 ± DEAB, 1.03 ± 0.19 Hz; CsA, 0.90 ± 0.06 Hz; CsA+DEAB, 1.03 ± 0.08 Hz; FK1012, 0.98 ± 0.09 Hz; OA, 0.73 ± 0.07 Hz. In all graphs, data represent average values ± SEM.
Inhibition of CaN Activity Regulates Synaptic Transmission in an RA-Dependent Manner.
We have previously shown that RA mediates homeostatic synaptic plasticity by increasing synaptic excitation and decreasing synaptic inhibition (4, 5). If CaN operates upstream of RA synthesis in homeostatic synaptic plasticity, then blocking CaN activity also should regulate synaptic strength in a manner similar to RA. Moreover, it should occlude further modulation of synaptic strength by RA. Indeed, similar to acute (2–4 h) RA treatment, prolonged (36 h) blockade of CaN activity in cultured organotypic hippocampal slices with another CaN inhibitor, cyclosporine A (CsA), increased synaptic excitation and decreased synaptic inhibition, as manifested by increased miniature excitatory postsynaptic current (mEPSC) amplitudes (Fig. 1B) and decreased miniature inhibitory synaptic current (mIPSC) amplitudes (Fig. 1C). Importantly, the addition of RA to CsA-treated slices did not further increase mEPSC amplitudes or further decrease mIPSC amplitudes (Fig. 1 B and C), indicating that the effects of RA and CaN inhibition converge to the same downstream signaling pathway.
To further test whether CaN operates upstream of RA synthesis, we examined the effect of the RA synthesis blocker DEAB on CaN inhibitor-induced changes in synaptic strength. Both FK506 and CsA, but not FK1012, induced a robust increase in mEPSC amplitudes (Fig. 1D) and a decrease in mIPSC amplitudes (Fig. 1E). Both synaptic changes were blocked by coapplication of DEAB (Fig. 1 D and E). DEAB treatment alone did not cause any changes in synaptic transmission (Fig. S1). These effects on synaptic transmission were specific to CaN; inhibition of protein phosphatases PP1 and PP2A with okadaic acid did not change mEPSC and mIPSC amplitudes (Fig. 1 D and E). Passive membrane properties of neurons were not altered by these drugs (Fig. S2). In addition, inhibiting Ca2+-activated kinases, such as PKC and CaMKII, did not lead to any significant changes in synaptic transmission (Fig. S3). Thus, inhibition of CaN activity leads to changes in excitatory and inhibitory synaptic transmission through a pathway that promotes RA synthesis.
Fig. S1.
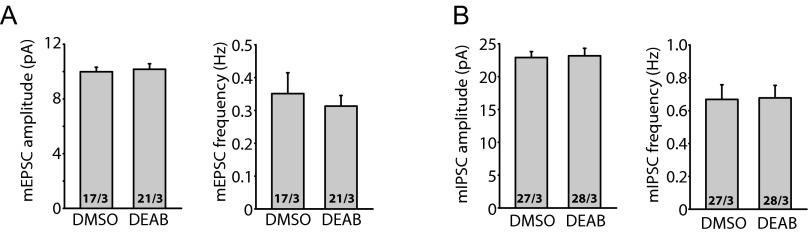
RA synthesis inhibitor DEAB does not change basal synaptic transmission. (A) Quantification of mEPSCs recorded from DMSO- or DEAB-treated hippocampal slices. DMSO or DEAB was added to the cultured slices at 36 h before recording. Amplitudes: DMSO, 9.99 ± 0.33 pA; DEAB, 10.17 ± 0.41 pA. Frequencies: DMSO, 0.35 ± 0.06 Hz; DEAB, 0.31 ± 0.03 Hz. P > 0.5, one-way ANOVA. (B) Quantification of mIPSCs recorded from DMSO- or DEAB-treated hippocampal slices. Amplitudes: DMSO, 22.90 ± 0.91 pA; DEAB, 23.17 ± 1.15 pA. Frequencies: DMSO, 0.67 ± 0.09 Hz; DEAB, 0.68 ± 0.08 Hz. P > 0.5, one-way ANOVA.
Fig. S2.

Inhibition of CaN activity does not alter passive membrane properties of neurons. Passive membrane properties of the neurons treated with CaN inhibitors DEAB, FK1012, or OA. (Left) Membrane capacitance. (Right) Membrane resistance.
Fig. S3.
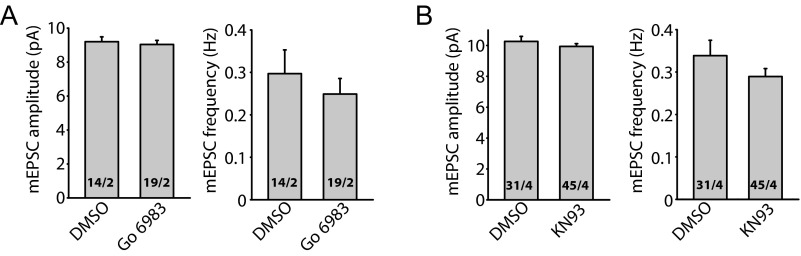
Prolonged inhibition of PKC and CaMKII does not alter synaptic transmission. (A) Summary of mEPSCs recorded from neurons treated with a pan-PKC inhibitor Go 6983 (10 μM) for 36 h. Amplitudes: DMSO, 9.20 ± 0.29 pA; Go, 9.04 ± 0.23 pA. Frequencies: DMSO, 0.30 ± 0.06 Hz; Go, 0.25 ± 0.04 Hz. P > 0.4, one-way ANOVA. (B) Summary of mEPSCs recorded from neurons treated with KN-93 (30 μM), a CaMKII inhibitor. Amplitudes: DMSO, 10.27 ± 0.33 pA; Go, 9.94 ± 0.18 pA. Frequencies: DMSO, 0.34 ± 0.04 Hz; Go, 0.29 ± 0.02 Hz. P > 0.7, one-way ANOVA.
RA Receptor RARα Mediates CaN Inhibitor-Induced Regulation of Synaptic Transmission.
Our previous work showed that synaptic RA signaling is mediated by the RA receptor RARα, a member of the nuclear hormone receptor family that is also localized, at least in part, to the cytoplasm (4, 16). Thus, we tested whether the effects of CaN inhibition also require RARα, using conditional RARα knockout (KO) neurons. Selective deletion of RARα in postsynaptic neurons was achieved by injecting lentiviruses expressing Cre recombinase into the CA1 pyramidal cell layer of cultured slices from conditional RARα KO mice (17, 18) (Fig. S4A). Compared with the neighboring WT (uninfected) neurons, whose mEPSC amplitudes were significantly increased by CsA, RARα KO (infected) neurons failed to respond to CsA treatment (Fig. 2A). Similarly, the effect of CsA on mIPSC amplitudes was blocked in RARα KO neurons (Fig. 2B). Deletion of RARα did not affect neuronal health, as indicated by the neurons’ normal morphology and passive membrane properties (Fig. S4).
Fig. S4.

Deletion of RARα does not alter gross morphology or passive membrane properties of neurons. (A) Images of RARα cKO hippocampal pyramidal neurons infected with Cre-expressing lentivirus. (Upper) GFP-Cre. (Lower) GFP-Cre and DIC overlay. Relatively sparse infection, indicated by the GFP-Cre signal, is achieved to facilitate paired recordings of neighboring infected and uninfected neurons. (Scale bar: 10 μm.) (B) Images of two RARα cKO hippocampal neurons infected with Cre-IRES-mCherry–expressing viruses filled with Alexa Fluor 488. (Scale bar: 20 μm.) (C) Passive membrane properties of the WT and RARα KO neurons. (Left) Membrane capacitance. (Right) Membrane resistance. P > 0.5, one-way ANOVA.
Fig. 2.

Regulation of synaptic strength by CaN inhibition requires RA signaling. (A) Quantification of mEPSCs recorded from WT and RARα KO neurons treated with CsA for 36 h. WT amplitudes: control, 10.04 ± 0.23 pA; CsA, 11.91 ± 0.39 pA; ***P < 0.005. RARα KO amplitudes: control, 10.11 ± 0.31 pA, CsA, 10.01 ± 0.29 pA; P > 0.5. WT frequencies: control, 0.37 ± 0.04 Hz; CsA, 0.34 ± 0.04 Hz; P > 0.5. RARα KO frequencies: control, 0.40 ± 0.05 Hz; CsA, 0.36 ± 0.03 Hz; P > 0.5, one-way ANOVA. (B) Quantification of mIPSCs recorded from WT and RARα KO neurons treated with CsA for 36 h. WT amplitudes: control, 21.60 ± 1.31 pA; CsA, 16.50 ± 0.72 pA; **P < 0.01. RARα KO amplitudes: control, 22.06 ± 1.23 pA; CsA, 20.78 ± 1.02 pA; P > 0.5. WT frequencies: control, 0.87 ± 0.11 Hz; CsA, 0.78 ± 0.12 Hz; P > 0.5; RARα KO frequencies: control, 0.93 ± 0.10 Hz; CsA, 0.86 ± 0.07 Hz; P > 0.5, one-way ANOVA. (C) Recording configuration for paired recordings of evoked synaptic transmission. (D) Example traces of eEPSCs recorded from WT and RARα KO neurons treated with DMSO or CsA for 36 h. Red lines indicate the time point (60 ms after stimulation) at which NMDAR-mediated response was measured. (Scale bars: 20 pA and 10 ms.) (E) Scatterplots of AMPAR eEPSCs from individual pairs (gray circles) and group mean ± SEM (black circles) of simultaneously recorded WT and neighboring RARα KO neurons. Average amplitudes are summarized on the right. DMSO-treated: WT, 45.61 ± 5.25 pA; RARα KO, 42.87 ± 5.89 pA; P > 0.5. CsA-treated: WT, 42.87 ± 5.15 pA; RARα KO, 28.69 ± 3.42 pA; ***P < 0.005, paired t test. (F) Scatterplots of NMDAR eEPSCs from individual pairs (gray circles) and group mean ± SEM (black circles) of simultaneously recorded WT and neighboring RARα KO neurons. Average amplitudes are summarized on the right. DMSO-treated: WT, 27.87 ± 5.38 pA; RARα KO, 29.67 ± 6.21 pA; P > 0.5. CsA-treated: WT, 46.04 ± 7.67 pA; RARα KO, 42.59 ± 6.57 pA; P > 0.5, paired t test. (G) Example traces of eIPSCs recorded from WT and RARα KO neurons treated with DMSO or CsA for 36 h. (Scale bars: DMSO, 50 pA and 10 ms; CsA, 100 pA and 10 ms.) (H) Scatterplots of eIPSCs from individual pairs (gray circles) and group mean ± SEM (black circles) of simultaneously recorded WT and neighboring RARα KO neurons. Average amplitudes are summarized on the right. DMSO-treated: WT, 155.66 ± 19.57 pA; RARα KO, 141.61 ± 14.79 pA; P > 0.2. CsA-treated: WT, 170.29 ± 26.45 pA; RARα KO, 253.04 ± 35.73 pA; ***P < 0.005, paired t test. In all graphs, data represent average values ± SEM.
The results obtained with miniature synaptic transmission were corroborated by results of evoked synaptic transmission (eEPSCs and eIPSCs) in WT and RARα KO neurons. We directly compared the evoked response amplitudes in neighboring pairs of WT (uninfected) and RARα KO (Cre-infected) neurons (Fig. 2C). RARα deletion did not change eEPSC amplitudes mediated by AMPARs (Fig. 2 D and E) or NMDA receptors (NMDARs) (Fig. 2 D and F) under control conditions; however, in CsA-treated slices, WT neurons exhibited significantly greater AMPAR eEPSC amplitudes than their RARα KO neighbors (Fig. 2 D and E), indicating a lack of increase in eEPSC size in the KO neurons. No difference was observed in the NMDAR eEPSC amplitudes (Fig. 2 D and F). The selective increase in AMPAR-mediated EPSCs by CsA in WT neurons was also reflected by a significant increase in AMPAR/NMDAR ratios of the eEPSCs (Fig. S5). This increased AMPAR/NMDAR ratio was absent in RARα KO neurons (Fig. S5). Likewise, whereas RARα deletion did not alter eIPSC amplitudes (Fig. 2 G and H), it did significantly impair the depression of eIPSCs by CsA (Fig. 2 G and H). In contrast, neurons infected with lentiviruses expressing an inactive form of Cre recombinase (mCre) responded to CsA treatment similarly as their uninfected neighbors for both eEPSCs and eIPSCs (Fig. S6 A and B). Taken together, these results demonstrate that the altered excitatory and inhibitory synaptic transmission by CaN inhibition is mediated by the RA signaling pathway.
Fig. S5.

Deletion of RARα blocks the increase in AMPAR/NMDAR ratios of eEPSCs induced by prolonged inhibition of CaN activity. Quantification of AMPAR/NMDAR ratios from WT or RARα KO neurons treated with DMSO or CsA for 36 h. WT: control, 1.46 ± 0.17; CsA, 2.33 ± 0.29; *P < 0.05. RARα KO: control, 1.52 ± 0.15; CsA, 1.43 ± 0.18 pA; P > 0.7, one-way ANOVA.
Fig. S6.

mCre infection in RARα cKO neurons does not affect CsA-induced changes in synaptic transmission. (A) Scatterplots of AMPAR eEPSCs from individual pairs (gray circles) and group mean ± SEM (black circles) of simultaneously recorded uninfected and neighboring mCre-infected neurons. Average amplitudes are summarized on the right: DMSO-treated: uninfected, 68.30 ± 12.25 pA; mCre-infected, 67.34 ± 14.10 pA; CsA-treated: uninfected, 51.14 ± 4.20 pA; mCre-infected, 44.69 ± 8.22 pA. P > 0.5, paired t test. (B) Scatterplots of eIPSCs from individual pairs (gray circles) and group mean ± SEM (black circles) of simultaneously recorded uninfected and neighboring mCre-infected neurons. Average amplitudes are summarized on the right: DMSO-treated: uninfected, 164.07 ± 17.64 pA; mCre-infected, 158.66 ± 19.09 pA; CsA-treated, uninfected, 240.18 ± 40.64 pA; mCre-infected, 290.05 ± 68.37 pA. P > 0.5, paired t test.
CaN Is Critically Involved in Activity Blockade-Induced Homeostatic Synaptic Plasticity.
Having established the connection between CaN activity and RA signaling, we next asked whether CaN is involved in activity blockade-induced homeostatic plasticity, which requires RA signaling (4, 6). We performed three lines of experiments to test this. First, we asked whether CNQX- and CsA-induced homeostatic plasticity occlude each other. Indeed, both CNQX- and CsA treatment increased mEPSC amplitudes, but cotreatment of CNQX and CsA did not further increase mEPSC amplitudes (Fig. S7A), or further decrease mIPSC amplitudes (Fig. S7B). The lack of additive effect between CNQX and CsA supports the idea that synaptic activity blockade and inhibition of CaN activity induce homeostatic synaptic plasticity through a converging signaling pathway.
Fig. S7.

CaN inhibitor treatment occludes activity blocker-induced homeostatic synaptic plasticity. (A) Quantification of mEPSCs recorded from neurons treated with DMSO, CNQX, CsA, and CsA+CNQX for 36 h. Amplitudes: DMSO, 11.29 ± 0.36 pA; CNQX, 13.86 ± 0.40 pA; CsA, 13.05 ± 0.33 pA; CsA+CNQX, 13.81 ± 0.38 pA; ***P < 0.001. Frequencies: DMSO, 0.43 ± 0.04 Hz; CNQX, 0.41 ± 0.04 Hz; CsA, 0.49 ± 0.05 Hz; CsA+CNQX, 0.42 ± 0.05 Hz; P > 0.5; one-way ANOVA. (B) Quantification of mIPSCs recorded from neurons treated with DMSO, CNQX, CsA, and CsA+CNQX for 36 h. Amplitudes: DMSO, 24.10 ± 0.64 pA; CNQX, 14.47 ± 0.27 pA; CsA, 14.64 ± 0.31 pA; CsA+CNQX, 15.32 ± 0.42 pA; ***P < 0.001. Frequencies: DMSO, 0.86 ± 0.08 Hz; CNQX, 0.79 ± 0.08 Hz; CsA, 0.87 ± 0.09 Hz; CsA+CNQX, 0.88 ± 0.10 Hz; P > 0.5, one-way ANOVA.
Second, we tested whether persistent CaN activity prevents changes in synaptic strength induced by prolonged activity blockade. We generated a constitutively active CaN (CA-CaN) by deleting the autoinhibitory domain (19) and expressed CA-CaN in CA1 pyramidal neurons in cultured slices with lentivirus injection. Indeed, CA-CaN expression blocked CNQX-induced up-regulation of mEPSC amplitudes and down-regulation of mIPSC amplitudes (Fig. S8). We also noticed, however, that neurons expressing CA-CaN were less healthy than their uninfected neighbors. Thus, in a third line of experiments, we further explored CaN’s involvement in homeostatic synaptic plasticity using the genetic deletion of CaN in the CaN-B KO mice. CaN is a heterodimer of a 61-kDa calmodulin-binding catalytic subunit (CaN-A) and a 19-kDa Ca2+-binding regulatory subunit (CaN-B). Deletion of CaN-B leads to rapid degradation of CaN-A, completely inactivating CaN.
Fig. S8.

Constitutively active CaN blocks homeostatic plasticity induced by prolonged CNQX treatment. (A) Summary of mEPSC amplitudes recorded from constitutively active CaN (CA-CaN) treated with DMSO or CNQX. Uninfected: control, 8.61 ± 0.14 pA; CNQX, 14.19 ± 1.10 pA; ***P < 0.001. CA-CaN: control, 9.89 ± 0.51 pA; CNQX, 10.73 ± 0.32 pA; P > 0.1). (B) Summary of mIPSC amplitudes recorded from CA-CaN treated with DMSO or CNQX. Uninfected: control, 18.62 ± 0.65 pA; CNQX, 15.20 ± 0.45 pA; ***P < 0.001. CA-CaN: control, 18.98 ± 1.04 pA; CNQX, 19.18 ± 1.13 pA; P > 0.4.
Owing to the high stability of CaN protein and potential incomplete removal of CaN (Fig. S9), we generated heterozygous CaN-B null/floxed mice by crossing constitutive CaN-B KO mice with the conditional CaN-B KO mice. Null/floxed compound heterozygous mice are viable and fertile. We then induced complete KO of CaN-B by injecting Cre-expressing lentiviruses into the CA1 region of cultured hippocampal slices prepared from the null/floxed mice (Figs. S9 and S10A).
Fig. S9.
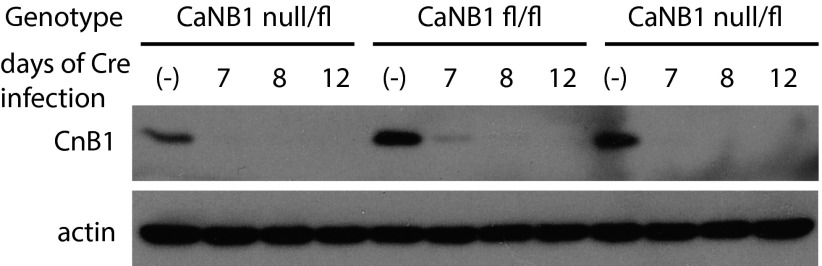
Immunoblot of CaNB1 from cultured cortical neurons. Cortical neurons from CaNB1 fl/fl or null/fl mouse brain were cultured and infected with lentiviruses expressing Cre recombinase. Cell lysates were collected at 7, 8, and 12 d after infection and blotted for CaNB1.
Fig. S10.

Deletion of CaN does not alter gross morphology or passive membrane properties of neurons. (A) Images of CaNB1 null/fl hippocampal pyramidal neurons infected with Cre-expressing lentivirus. (Upper) GFP-Cre. (Lower) GFP-Cre and DIC overlay. Relatively sparse infection, indicated by the GFP-Cre signal, is achieved to facilitate paired recordings of neighboring infected and uninfected neurons. (Scale bar: 10 μm.) (B) Images of two CaNB1 null/fl hippocampal neurons infected with Cre-IRES-mCherry–expressing viruses filled with Alexa Fluor 488. (Scale bar: 20 μm.) (C) Passive membrane properties of the WT and CaN KO neurons. (Left) Membrane capacitance. (Right) Membrane resistance. P > 0.5, one-way ANOVA.
We first verified the specificity of CsA, which should not be effective in CaN-B KO neurons. Indeed, whereas CsA significantly increased mEPSC amplitudes in WT neurons (Fig. 3A), it failed to change mEPSC amplitudes in CaN-B KO neurons (Fig. 3A). The CaN-B KO had no effect on neuronal health, as evidenced by normal neuronal morphology and passive membrane properties (Fig. S10). We then examined whether CaN-B deletion affects RA-dependent, activity blockade-induced homeostatic synaptic plasticity. Consistent with previous reports (6), prolonged treatment (36 h) of cultured slices with CNQX increased mEPSC amplitudes in WT neurons, but not in CaN-B KO neurons (Fig. 3B).
Fig. 3.

CaN deletion blocks homeostatic synaptic plasticity induced by synaptic activity blockade at excitatory synapses. (A) Quantification of mEPSCs recorded from WT and CaN KO neurons treated with DMSO or CsA. WT amplitudes: DMSO control, 9.77 ± 0.17 pA; CsA, 11.25 ± 0.31 pA; ***P < 0.005. CaN KO amplitudes: control, 11.17 ± 0.32 pA; CsA, 11.29 ± 0.32 pA; P > 0.5. WT frequencies: control, 0.30 ± 0.03 Hz; CsA, 0.37 ± 0.04 Hz; P > 0.5. CaN KO frequencies: control, 0.31 ± 0.04 Hz; CsA, 0.34 ± 0.03 Hz; P > 0.5, one-way ANOVA. (B) Quantification of mEPSCs recorded from WT and CaN KO neurons treated with DMSO or CNQX. WT amplitudes: DMSO control, 10.62 ± 0.26 pA; CNQX, 12.15 ± 0.35 pA; ***P < 0.005. CaN KO amplitudes: control, 12.45 ± 0.32 pA; CNQX, 12.54 ± 0.48 pA; P > 0.5. WT frequencies: control, 0.33 ± 0.03 Hz; CNQX, 0.33 ± 0.03 Hz; P > 0.5. CaN KO frequencies: control, 0.37 ± 0.03 Hz; CNQX, 0.33 ± 0.03 Hz; P > 0.5, one-way ANOVA. (C) Example traces (Left) and scatterplot (Right) of eEPSCs recorded from WT and CaN KO pairs treated with DMSO. Individual pairs are plotted in gray circles; group means, in black circles. Average amplitudes are summarized on the right: WT, 67.26 ± 10.73 pA; CaN KO, 105.68 ± 16.36 pA; ***P < 0.005, paired t test. (Scale bars: 20 pA and 10 ms.) (D) Example traces (Left) and scatterplot (Right) of eEPSCs recorded from WT and CaN KO pairs treated with CsA. Average amplitudes are summarized on the right: WT, 104.70 ± 17.88 pA; CaN KO, 77.92 ± 10.34 pA; P > 0.1, paired t test. (Scale bars: 20 pA and 10 ms.) (E) Example traces (Left) and scatterplot (Right) of eEPSCs recorded from WT and CaN KO pairs treated with CNQX. Average amplitudes are summarized on the right: WT, 60.57 ± 9.09 pA; CaN KO, 44.28 ± 6.38 pA; P > 0.05, paired t test. (Scale bars: 20 pA and 10 ms.) (F) Quantification of mEPSCs recorded from WT and CaN KO neurons treated with DMSO or RA. WT amplitudes: DMSO control, 10.90 ± 0.36 pA; RA, 12.73 ± 0.31 pA; ***P < 0.005. CaN KO amplitudes: control, 13.40 ± 0.62 pA; RA, 12.82 ± 0.38 pA; ***P < 0.005. WT frequencies: control, 0.53 ± 0.06 Hz; RA, 0.37 ± 0.03 Hz; *P < 0.05. CaN KO frequencies: control, 0.51 ± 0.08 Hz; RA, 0.36 ± 0.04 Hz; P > 0.05, one-way ANOVA. In all graphs, data represent average values ± SEM.
We next assessed excitatory synaptic transmission with evoked responses. Of note, CaN-B KO neurons have an elevated basal excitatory synaptic response, reflected by greater mEPSC, AMPAR eEPSC, and NMDAR eEPSC amplitudes in CaN-B KO neurons compared with their WT controls (Fig. 3 A and C and Fig. S11). This increase in basal excitatory transmission has been reported previously, and attributed to transcriptional control of morphological and electrophysiological properties of neurons mediated by distinct CaN–NFAT interactions (20). This increased basal synaptic transmission is specific to CaN-B KO neurons, with no difference observed between mCre-infected and WT neurons (Fig. S12A). In both CsA-treated and CNQX-treated slices, WT neurons, but not CaN-B KO neurons, exhibited increased eEPSC amplitudes, thus eliminating the difference between WT and CaN-B KO neurons (Fig. 3 D and E).
Fig. S11.

Deletion of CaN elevates basal synaptic NMDAR responses. Scatterplots of NMDAR eEPSCs (measured at +40 mV) from individual pairs (gray circles) and group mean ± SEM (black circles) of simultaneously recorded uninfected and neighboring Cre-infected neurons from conditional CaN-B KO slices. Average amplitudes are summarized on the right: uninfected, 37.55 ± 6.38 pA; Cre-infected, 45.60 ± 7.73 pA. *P < 0.05, paired t test.
Fig. S12.

mCre infection in CaN conditional KO neurons does not affect basal transmission. (A) Scatterplots of AMPAR eEPSCs from individual pairs (gray circles) and group mean ± SEM (black circles) of simultaneously recorded uninfected and neighboring mCre-infected neurons. Average amplitudes are summarized on the right: uninfected, 55.32 ± 9.04 pA; mCre-infected, 51.84 ± 10.77 pA. P > 0.5, paired t test. (B) Scatterplots of eIPSCs from individual pairs (gray circles) and group mean ± SEM (black circles) of simultaneously recorded uninfected and neighboring mCre-infected neurons. Average amplitudes are summarized on the right: uninfected, 117.43 ± 12.87 pA; mCre-infected, 125.72 ± 15.89 pA. P > 0.5, paired t test.
We also examined inhibitory synaptic transmission in CaN-B KO neurons. Different from excitatory synaptic transmission, neither Cre infection or mCre infection altered basal inhibitory synaptic responses (Fig. 4 A–C and Fig. S12B). However, neither CsA nor CNQX treatment decreased inhibitory synaptic responses in CaN-B KO neurons, as measured by mIPSC and eIPSC recordings (Fig. 4 A–E), indicating that activity blockade-induced homeostatic synaptic plasticity at inhibitory synapses is also blocked by CaN deletion. In addition, we treated CaN-B KO neurons with RA, which successfully reduced mIPSC amplitudes in both WT and CaN-B KO neurons (Fig. 4F), indicating that RA acts downstream of CaN to modulate synaptic transmission. Interestingly, RA did not further increase mEPSC amplitudes in CaN-B KO neurons (Fig. 3F), likely because of elevated basal transmission preventing further increases owing to synaptic constraints. Taken together, these results support the notion that CaN activity, acting upstream of RA synthesis, is an essential component of activity blockade-induced homeostatic synaptic plasticity.
Fig. 4.

CaN deletion blocks homeostatic synaptic plasticity induced by synaptic activity blockade at inhibitory synapses. (A) Quantification of mIPSCs recorded from WT and CaN KO neurons treated with DMSO or CsA. WT amplitudes: DMSO control, 23.38 ± 1.25 pA; CsA, 14.59 ± 0.42 pA; ***P < 0.005. CaN KO amplitudes: control, 22.79 ± 1.01 pA; CsA, 21.76 ± 0.79 pA; P > 0.4. WT frequencies: control, 1.22 ± 0.19 Hz; CsA, 0.95 ± 0.19 Hz; P > 0.3. CaN KO frequencies: control, 1.20 ± 0.19 Hz; CsA, 1.15 ± 0.15 Hz; P > 0.8, one-way ANOVA. (B) Quantification of mIPSCs recorded from WT and CaN KO neurons treated with DMSO or CNQX. WT amplitudes: DMSO control, 26.42 ± 0.76 pA; CNQX, 19.67 ± 0.70 pA; ***P < 0.005. CaN KO amplitudes: control, 26.33 ± 0.83 pA; CNQX, 27.12 ± 1.24 pA; P > 0.5. WT frequencies: control, 1.69 ± 0.13 Hz; CNQX, 1.46 ± 0.10 Hz; P > 0.15. CaN KO frequencies: control, 1.58 ± 0.11 Hz; CNQX, 1.67 ± 0.12 Hz; P > 0.5, one-way ANOVA. (C) Example traces (Left) and scatterplot (Right) of eIPSCs recorded from WT and CaN KO pairs treated with DMSO. Individual pairs are plotted in gray circles; group means, in black circles. Average amplitudes are summarized on the right: WT, 155.53 ± 20.95 pA; CaN KO, 121.83 ± 15.73 pA; *P < 0.05, paired t test. (Scale bars: 50 pA and 10 ms.) (D) Examples traces (Left) and scatterplot (Right) of eIPSCs recorded from WT and CaN KO pairs treated with CsA. Average amplitudes are summarized on the right: WT, 114.50 ± 21.33 pA; CaN KO, 167.73 ± 23.29 pA; ***P < 0.005, paired t test. (Scale bars: 50 pA and 10 ms.) (E) Example traces (Left) and scatterplot (Right) of eIPSCs recorded from WT and CaN KO pairs treated with CNQX. Average amplitudes are summarized on the right: WT, 105.04 ± 11.95 pA; CaN KO, 144.61 ± 21.50 pA; **P < 0.01, paired t test. (Scale bars: 50 pA and 10 ms.) (F) Quantification of mIPSCs recorded from WT and CaN KO neurons treated with DMSO or RA. WT amplitudes: DMSO control, 23.23 ± 1.46 pA; RA, 14.23 ± 0.37 pA; ***P < 0.005. CaN KO amplitudes: control, 24.08 ± 1.56 pA; RA, 14.65 ± 0.35 pA; ***P < 0.005. WT frequencies: control, 1.07 ± 0.10 Hz; RA, 0.70 ± 0.10 Hz; *P < 0.05. CaN KO frequencies: control, 1.29 ± 0.09 Hz; RA, 0.83 ± 0.08 Hz; ***P < 0.005, one-way ANOVA. In all graphs, data represent average values ± SEM.
GluA1 Phosphorylation at S831 and S845 Is Not Required for RA-Dependent Homeostatic Synaptic Plasticity.
The AMPAR GluA1 subunit contains multiple C-terminal phosphorylation sites whose phosphorylation state is regulated by various kinases and phosphatases (21–23). Both GluA1 S831 and S845 were hyperphosphorylated in the hippocampus of conditional CaN-B KO mice crossed to mice expressing Cre under control of the Emx1 promoter, which activates Cre expression in all excitatory forebrain neurons (Fig. 5A). The phosphorylation state of these two serine residues is thought to regulate trafficking of AMPARs at synaptic membranes during Hebbian plasticity (11). Thus, we were curious to know whether inhibition of CaN may induce homeostatic synaptic plasticity by increasing the phosphorylation of S831 and S845, in addition to its stimulation of RA synthesis. To address this question, we used GluA1 S831A and S845A KI mice in which phosphorylation of these two sites are blocked (24). Treatment with RA, CsA, or CNQX significantly increased the mEPSC amplitudes in the S831A and S845A KI mice to levels similar to those seen in their WT littermates (Fig. 5 B and C). Therefore, although blocking CaN activity may significantly increase the phosphorylation of GluA1 S831 and S845, phosphorylation of these two sites of GluA1 is not required for RA-mediated homeostatic synaptic plasticity.
Fig. 5.

Phosphorylation of GluA1 at S831 and S845 sites is not required for regulation of synaptic strength by RA or CaN inhibitors. (A) Immunoblot of phosphorylated GluA1 S831 and S845 in P21 WT and Emx-Cre CaN KO hippocampus. (B) Quantification of mEPSCs recorded from S831A KI mice treated with RA, CsA, or CNQX. WT amplitudes: DMSO, 9.91 ± 0.16 pA; RA, 11.80 ± 0.23 pA; CsA, 11.53 ± 0.34 pA; CNQX, 11.22 ± 0.28 pA; ***P < 0.005. S831A KI amplitudes: DMSO, 9.97 ± 0.18 pA; RA, 11.88 ± 0.24 pA; CsA, 11.80 ± 0.54 pA; CNQX, 12.16 ± 0.41 pA ***P < 0.005. WT frequencies: DMSO, 0.38 ± 0.03 Hz; RA, 0.29 ± 0.03 Hz; CsA, 0.30 ± 0.03 Hz; CNQX, 0.40 ± 0.04 Hz, P > 0.1. S831A KI frequencies: DMSO, 0.29 ± 0.02 Hz; RA, 0.32 ± 0.04 Hz; CsA, 0.31 ± 0.03 Hz; CNQX, 0.32 ± 0.03 Hz, P > 0.3, one-way ANOVA. (C) Quantification of mEPSCs recorded from S845A KI mice treated with RA, CsA, or CNQX. WT amplitudes: DMSO, 10.62 ± 0.20 pA; RA, 11.81 ± 0.49 pA; CsA, 12.04 ± 0.29 pA; CNQX, 13.23 ± 0.38 pA; **P < 0.01; ***P < 0.005. S845A KI amplitudes: DMSO, 10.34 ± 0.21 pA; RA, 12.78 ± 0.39 pA; CsA, 11.72 ± 0.49 pA; CNQX, 13.51 ± 0.44 pA; ***P < 0.005. WT frequencies: DMSO, 0.35 ± 0.03 Hz; RA, 0.37 ± 0.03 Hz; CsA, 0.39 ± 0.04 Hz; CNQX, 0.44 ± 0.05 Hz; P > 0.3. S845A KI frequencies: DMSO, 0.35 ± 0.04 Hz; RA, 0.42 ± 0.09 Hz; CsA, 0.32 ± 0.05 Hz; CNQX, 0.44 ± 0.06 Hz; P > 0.2, one-way ANOVA. In all graphs, data represent average values ± SEM.
Discussion
In this study, we have uncovered a previously unknown function of CaN in regulating RA synthesis. Although RA is increasingly recognized as an active signaling molecule in the adult brain (25), little is known about how RA synthesis is regulated in the adult nervous system. Our previous work showed that regular basal Ca2+ levels in neurons maintained by normal synaptic transmission is sufficient to suppress RA synthesis, and that a decrease in basal Ca2+ levels stimulates RA synthesis (6). Here we have identified CaN as the signaling molecule linking Ca2+ levels to RA synthesis, thus revealing a crucial component of the pathway for the activity-dependent regulation of RA synthesis.
How does CaN regulate RA synthesis? RA is produced through oxidation of retinal by RALDHs (26, 27). During development, RA levels are controlled largely by changes in RALDH expression levels (28). There are three RALDHs, designated RALDH1–3, which display nonoverlapping tissue-specific patterns of expression during embryogenesis (29). These enzymes are also expressed in the adult mammalian brain (30, 31). Given the relatively high expression levels of RALDHs in the brain (4, 30), it is likely that the enzymatic activity of RALDHs is acutely regulated by posttranslational modifications, such as phosphorylation. Indeed, phosphorylation sites on RALDHs have been reported by recent quantitative phosphoproteomics studies (32–38). Further work is needed to elucidate how CaN may directly or indirectly modulate RALDH activity in neurons through regulation of various phosphorylation sites.
Phosphorylation of the C-terminal sequences of AMPARs is thought to play a major role in controlling AMPAR synaptic targeting and channel properties (9). In particular, changes in phosphorylation of the two serine residues in the C-terminal sequence of GluA1 (S831 and S845) appear to govern the conductance and trafficking of AMPARs in and out of synaptic membranes during LTP and LTD (10–12). PKA-mediated phosphorylation of GluA1 S845 has been shown to promote plasma membrane insertion of GluA1 and synaptic retention, thereby facilitating LTP (12, 39–43), whereas dephosphorylation of S845 by CaN and other phosphatases has been correlated with AMPAR endocytosis and LTD (11, 12, 40, 42). In addition, it has been suggested that regulation of GluA1 S845 phosphorylation by PKA and CaN is involved in AMPAR trafficking during bidirectional homeostatic synaptic plasticity in cortical neurons (44, 45; but see ref. 46). However, increased phosphorylation of GluA1 S845 alone is not considered sufficient for homeostatic synaptic plasticity in the cortex (47), and does not increase AMPA synaptic targeting in the hippocampus (46). Moreover, it was recently shown that AMPAR trafficking during LTP and RA-dependent homeostatic synaptic plasticity uses different exocytosis pathways involving distinct SNARE-dependent mechanisms (48). Thus, it is likely that the regulatory mechanisms for AMPAR trafficking are also distinct between LTP and RA-dependent homeostatic synaptic plasticity.
Two recent lines of evidence further challenge the notion that the AMPAR GluA1 phosphorylation state dictates AMPAR trafficking during hippocampal synaptic plasticity. First, a study using a single-cell molecular replacement strategy found that LTP requires a reserved pool of glutamate receptors that is not subunit-specific, and that LTP expression does not require the C-terminal sequence of GluA1 (49). Second, another study using a highly quantitative Phos-tag SDS/PAGE method estimated the proportion of the phosphorylated AMPAR subunit GluA1 in the hippocampus as <1% for S831 and <0.1% for S845 (13). Further analysis of the postsynaptic density fraction and surface-localized AMPAR population showed that the phosphorylation of GluA1 is not significantly different from those estimated from the total population (13). Thus, our findings, together with the foregoing lines of evidence, suggest that at least in the hippocampus, other mechanisms besides GluA1 phosphorylation are involved in regulating AMPAR trafficking during various forms of synaptic plasticity.
Results from the present study provide compelling evidence that CaN is involved in homeostatic synaptic plasticity through a mechanism independent of AMPAR phosphorylation, namely regulation of RA synthesis. First, we have demonstrated directly that blocking CaN activity induces RA synthesis. Second, we have shown that inhibition of CaN activity regulates not only excitatory synaptic strength, but also inhibitory synaptic strength, and that the latter clearly does not require GluA1 phosphorylation. Third, we have demonstrated the necessity of RA signaling in mediating the CaN blocker-induced synaptic plasticity; both inhibition of RA synthesis and genetic deletion of RARα completely block CaN inhibitor-induced synaptic plasticity. Last but not least, we have shown that in GluA1 S845A and S831A KI mutant mice, RA-, CNQX-, and CaN inhibitor-induced synaptic plasticity is intact, indicating that CaN inactivation modulates synaptic strength through a mechanism (i.e., RA signaling) distinct from direct phosphorylation of synaptic receptors. Taken together, our results provide a previously unidentified mechanism for activity-dependent regulation of RA synthesis in the context of homeostatic synaptic plasticity.
Materials and Methods
All mouse breeding colonies were maintained in the animal facility at Stanford Medical School following standard procedures approved by Stanford University’s Administrative Panel on Laboratory Animal Care. Organotypic slice cultures were prepared from mouse pups at postnatal day (P) 6–7 and maintained for 5–7 d before recording (4, 50). More details are provided in SI Materials and Methods.
SI Materials and Methods
Mouse Lines and Genotyping Information.
The RARα floxed mouse (C57BL/6 background) was a gift from Drs. Pierre Chambon and Norbert Ghyselinck (Institut de Génétique et de Biologie Moléculaire et Cellulaire) (18). Breeding colonies were maintained in the animal facility at Stanford Medical School. Genotyping of the mice was achieved by PCR with the following primers: primer 1, forward, 5′-GTGTGTGTGTGTATTCGCGTGC-3′ and primer 2, reverse, 5′-ACAAAGCAAGGCTTGTAGATGC-3′, and compared with WT C57BL/6. After infection with a lentiviral vector expressing Cre recombinase or a truncated and inactive version of Cre, successful lox-P mediated recombination in organotypic hippocampal slice cultures was assayed by PCR with primer 1 and primer 3 (5′-TACACTAACTACCCTTGACC-3′). Conditions were 30 cycles of 30 s at 92 °C, annealing at decreasing temperatures from 62 °C to 56 °C to increase product specificity, and then elongation for 30 s at 72 °C.
Calcineurin B1 (CnB1) floxed mice (51) were obtained from The Jackson Laboratory. CnB1 null mice were created by crossing with CMV-CRE mice to create a germline deletion. Mice with a deletion allele were crossed back to the floxed line to obtain CnB1 null/fl mice. Thereafter, CnB1 null/fl mice were bred to CnB1 fl/fl mice. Genotyping was performed using forward primers CAATGCAGTCCGCTGTAGTTC and TTCGAGGACAGCTATACAGAGAAA, along with reverse primer GACCTCCAGCCTCCACATAC.
The GluA1 S831A and S845A mice of C57BL/6 background were gifts from Dr. Richard Huganir (Johns Hopkins University). GluR1 S845A and S831A mice were genotyped by PCR using primers GTATAGACTGACACATCAGATGGGTGCTAC and CAGGATCTCTCCCGTTATTG, followed by digestion of the PCR product with SacII (S845) or BsiW1 (S831).
RARE Assay.
The 3xRARE-EGFP reporter construct was as described previously (4, 6). Three copies of the RARE were placed upstream of a TK promoter driving EGFP. Dissociated cultures used for RARE imaging were transfected using Lipofectamine 2000 (Invitrogen) as described previously (4, 6), fixed with 4% paraformaldehyde (15 min at room temperature), and washed with PBS before mounting. Images were acquired and quantified as described previously (6, 52) using an Olympus FV1000 BX61WI laser-scanning confocal microscope. Regions of interest at soma of transfected cells were chosen for quantification of GFP expression.
Immunoblot Analyses.
Removal of CnB1 in the floxed line was tested by Western blot analysis. Dissociated cortical cultures were prepared from null/fl or fl/fl mice and infected with lentivirus expressing Cre recombinase. Lysates were probed for CnB1 protein using mouse anti-CnB1 (Sigma-Aldrich). CnB1fl/+;Emx1-cre+ males were crossed with CnB1fl/∆ females, and the resulting progenies were killed at P20. Hippocampi were dissected in ice-cold PBS and immediately lysed with ice-cold RIPA buffer [50 mM Tris pH 8.0, 150 mM NaCl, 1% (vol/vol) Nonidet P-40, 0.1% (wt/vol) SDS, 1% (wt/vol) Na-deoxycholate, and 1 mM EDTA] containing protease and phosphatase inhibitors. Soluble fractions were denatured in SDS sample buffer and resolved by electrophoresis. Gels were transferred to a nitrocellulose membrane and blocked with 5% (wt/vol) milk/TBST. Blots were probed with primary antibodies overnight at 4 °C and secondary antibodies for 1 h at room temperature, and then developed with Chemiluminescent Substrate (Life Technologies). The following antibodies were used: GluA1 phospho-S845 (Abcam), GluA1 phospho-S831 (a gift from Dr. Hey Kyoung Lee, Johns Hopkins University), CnB1 mAb (Sigma-Aldrich), and actin mAb (CalBiochem).
Organotypic Hippocampal Slice Cultures.
Organotypic slice cultures were prepared from young mouse pups (P6–7) and placed on semiporous membranes (Millipore) for 5–7 d before recording (4, 50). In brief, slices were maintained in MEM-based culture medium comprising 1 mM CaCl2, 2 mM MgSO4, 1 mM l-glutamine, 1 mg/L insulin, 0.0012% (wt/vol) ascorbic acid, 30 mM Hepes, 13 mM d-glucose, and 5.2 mM NaHCO3. The culture medium was adjusted to a pH of 7.25 and an osmolarity of 320 mOsm. Cultures were maintained in an incubator with 95% O2/5% (vol/vol) CO2 at 34 °C. For experiments with shRNA, CRE, or mCRE expression, cultures were injected on DIV 0 and maintained for 10 d before recording.
Viral Vectors and Viral Infection.
Recombinant lentivirus was produced as described previously (4, 50). In brief, using the calcium phosphate method, HEK293 cells were transfected with four plasmids, the lentiviral shuttle vector, pVSVG, pRRE, and pREV. The HEK293 culture medium was collected at 40–44 h after transfection and filtered through a 0.45-μm PVDF filter (Millipore) to remove cellular debris, followed by centrifugation at 50,000 × g to concentrate the virus. Concentrated virus was dissolved in a small volume of medium, aliquoted, and stored frozen at −80 °C. Virus expressing ShRNA, Cre-recombinase, or a truncated and inactive version of Cre (mCre) (53) was injected into the CA1 region of organotypic hippocampal slice cultures at DIV 0 and expressed for 10 d. Virus injection was carried out using a picospritzer delivering 18–20 psi coupled to a micropipette with a tip size of 8–10 μm. Virus was delivered into the CA1 cell body layer at four to five injection sites, with four or five pulses (5 ms duration) per injection site. Virus titer ranged from 104 to 105 TU/mL. Recordings from infected neurons were carried out at DIV 10.
Electrophysiology.
Voltage-clamp whole-cell recordings were obtained from CA1 pyramidal neurons in organotypic slice cultures treated with either vehicle controls or 10 μM RA (for 4 h before recording), 20 μM CNQX, 1 μM FK506, 10 μM CsA, 1 μM FK1012, 10 μM Go6983, 30 μM KN-93, 1 μM okadaic acid, and/or DEAB (20 μM) (for 36 h before recording) under visual guidance using transmitted light illumination. For experiments testing whether treatment generated RA, blockade drugs were coapplied with 20 μM DEAB. For experiments testing whether blockade of calcineurin occluded RA scaling, slices were first treated with the calcineurin inhibitor CsA for 36 h before recording, and 10 μM RA was added to the medium during the last 4 h of treatment before recording. Vehicle control and RA- or blockade-treated cells were obtained from the same batches of slices on the same experimental day.
For experiments testing the knockout of either calcineurin or RARα, CA1 pyramidal neurons infected with either CRE or mCRE virus were obtained in concert with uninfected neighboring neurons from the same organotypic slice cultures. In experiments measuring evoked currents, direct comparison of AMPA, NMDA, or GABAergic transmission, pairs of neighboring cells (uninfected and infected) were recorded under simultaneous dual-whole cell recording.
The recording chamber was perfused with 119 mM NaCl, 2.5 mM KCl, 4 mM CaCl2, 4 mM MgCl2, 26 mM NaHCO3, 1 mM NaH2PO4, 11 mM glucose, and 4 μM 2-chloroadenosine at pH 7.4; gassed with 5% CO2/95% O2; and held at 30 °C. For EPSC recordings, patch recording pipettes (3–6 MΩ) were filled with 115 mM cesium methanesulfonate, 20 mM CsCl, 10 mM Hepes, 2.5 mM MgCl2, 4 mM Na2ATP, 0.4 mM Na3GTP, 10 mM sodium phosphocreatine, and 0.6 mM EGTA at pH 7.25. For IPSC recordings, pipettes were filled with 140 mM CsCl, 2 mM MgCl2, 5 mM EGTA, 10 mM Hepes, 0.3 mM Na3-GTP, and 4 mM Na2-ATP at pH 7.35. Stable recordings were ensured by online monitoring of Rm, Ra, and Cm. Only neurons with stable Rm, Ra, and Cm were retained for further analysis. Spontaneous miniature transmission was obtained in the presence of 1 μM TTX in the external solution.
Synaptic responses were evoked with bipolar electrodes using single-voltage pulses (200 μs, up to 20 V or 10 mA). The stimulating electrodes were placed over Schaffer collateral fibers 300–500 μm from the recorded cells. Synaptic AMPAR-mediated responses were measured at −60 mV and NMDA receptor (NMDAR)-mediated responses were measured at +40 mV, taken at a latency at which AMPAR responses had fully decayed (60 ms). Synaptic responses were averaged over 50–100 trials.
All electrophysiological recordings were carried out with Multiclamp 700B amplifiers (Axon Instruments), and analysis was completed in Clampfit (Axon), MiniAnalysis (Synaptosoft), Excel (Microsoft), and Prism (GraphPad).
Statistical Analyses.
In all graphs, data represent average values ± SEM. Statistical differences were calculated according to nonparametric tests. Comparisons between multiple groups were performed with Kruskal–Wallis ANOVA. When significant differences were observed, P values for pairwise comparisons were calculated according to the two-tailed Mann–Whitney test (for unpaired data) or Wilcoxon test (for paired data). P values are indicated in each figure.
Acknowledgments
We thank Dr. Rick Huganir (Johns Hopkins University) for the GluA1 S845A and S31A KI mice and Dr. Hey Kyoung Lee (Johns Hopkins University) for the GluA1 phospho-S831 antibody. We also thank members of the Chen laboratory for comments and help during the course of the study. This work was supported by National Institutes of Health Grants MH086403 (to L.C.), MH091193 (to L.C.), and 5PN2EY016525 (to I.A.G.), and by a fellowship from the Boehringer Ingelheim Funds (to M.H.).
Footnotes
The authors declare no conflict of interest.
This article is a PNAS Direct Submission. V.N.M. is a guest editor invited by the Editorial Board.
This article contains supporting information online at www.pnas.org/lookup/suppl/doi:10.1073/pnas.1510239112/-/DCSupplemental.
References
- 1.Turrigiano G. Homeostatic synaptic plasticity: Local and global mechanisms for stabilizing neuronal function. Cold Spring Harb Perspect Biol. 2012;4(1):a005736. doi: 10.1101/cshperspect.a005736. [DOI] [PMC free article] [PubMed] [Google Scholar]
- 2.Davis GW, Müller M. Homeostatic control of presynaptic neurotransmitter release. Annu Rev Physiol. 2015;77:251–270. doi: 10.1146/annurev-physiol-021014-071740. [DOI] [PubMed] [Google Scholar]
- 3.Chen L, Lau AG, Sarti F. Synaptic retinoic acid signaling and homeostatic synaptic plasticity. Neuropharmacology. 2014;78:3–12. doi: 10.1016/j.neuropharm.2012.12.004. [DOI] [PMC free article] [PubMed] [Google Scholar]
- 4.Aoto J, Nam CI, Poon MM, Ting P, Chen L. Synaptic signaling by all-trans retinoic acid in homeostatic synaptic plasticity. Neuron. 2008;60(2):308–320. doi: 10.1016/j.neuron.2008.08.012. [DOI] [PMC free article] [PubMed] [Google Scholar]
- 5.Sarti F, Zhang Z, Schroeder J, Chen L. Rapid suppression of inhibitory synaptic transmission by retinoic acid. J Neurosci. 2013;33(28):11440–11450. doi: 10.1523/JNEUROSCI.1710-13.2013. [DOI] [PMC free article] [PubMed] [Google Scholar]
- 6.Wang HL, Zhang Z, Hintze M, Chen L. Decrease in calcium concentration triggers neuronal retinoic acid synthesis during homeostatic synaptic plasticity. J Neurosci. 2011;31(49):17764–17771. doi: 10.1523/JNEUROSCI.3964-11.2011. [DOI] [PMC free article] [PubMed] [Google Scholar]
- 7.Mansuy IM, Shenolikar S. Protein serine/threonine phosphatases in neuronal plasticity and disorders of learning and memory. Trends Neurosci. 2006;29(12):679–686. doi: 10.1016/j.tins.2006.10.004. [DOI] [PubMed] [Google Scholar]
- 8.Lee HK. Synaptic plasticity and phosphorylation. Pharmacol Ther. 2006;112(3):810–832. doi: 10.1016/j.pharmthera.2006.06.003. [DOI] [PMC free article] [PubMed] [Google Scholar]
- 9.Shepherd JD, Huganir RL. The cell biology of synaptic plasticity: AMPA receptor trafficking. Annu Rev Cell Dev Biol. 2007;23:613–643. doi: 10.1146/annurev.cellbio.23.090506.123516. [DOI] [PubMed] [Google Scholar]
- 10.Lee HK, Kameyama K, Huganir RL, Bear MF. NMDA induces long-term synaptic depression and dephosphorylation of the GluR1 subunit of AMPA receptors in hippocampus. Neuron. 1998;21(5):1151–1162. doi: 10.1016/s0896-6273(00)80632-7. [DOI] [PubMed] [Google Scholar]
- 11.Lee HK, Barbarosie M, Kameyama K, Bear MF, Huganir RL. Regulation of distinct AMPA receptor phosphorylation sites during bidirectional synaptic plasticity. Nature. 2000;405(6789):955–959. doi: 10.1038/35016089. [DOI] [PubMed] [Google Scholar]
- 12.Lee HK, et al. Phosphorylation of the AMPA receptor GluR1 subunit is required for synaptic plasticity and retention of spatial memory. Cell. 2003;112(5):631–643. doi: 10.1016/s0092-8674(03)00122-3. [DOI] [PubMed] [Google Scholar]
- 13.Hosokawa T, Mitsushima D, Kaneko R, Hayashi Y. Stoichiometry and phosphoisotypes of hippocampal AMPA-type glutamate receptor phosphorylation. Neuron. 2015;85(1):60–67. doi: 10.1016/j.neuron.2014.11.026. [DOI] [PMC free article] [PubMed] [Google Scholar]
- 14.Russo JE, Hauguitz D, Hilton J. Inhibition of mouse cytosolic aldehyde dehydrogenase by 4-(diethylamino)benzaldehyde. Biochem Pharmacol. 1988;37(8):1639–1642. doi: 10.1016/0006-2952(88)90030-5. [DOI] [PubMed] [Google Scholar]
- 15.Spencer DM, Wandless TJ, Schreiber SL, Crabtree GR. Controlling signal transduction with synthetic ligands. Science. 1993;262(5136):1019–1024. doi: 10.1126/science.7694365. [DOI] [PubMed] [Google Scholar]
- 16.Poon MM, Chen L. Retinoic acid-gated sequence-specific translational control by RARalpha. Proc Natl Acad Sci USA. 2008;105(51):20303–20308. doi: 10.1073/pnas.0807740105. [DOI] [PMC free article] [PubMed] [Google Scholar]
- 17.Sarti F, Schroeder J, Aoto J, Chen L. Conditional RARα knockout mice reveal acute requirement for retinoic acid and RARα in homeostatic plasticity. Front Mol Neurosci. 2012;5:16. doi: 10.3389/fnmol.2012.00016. [DOI] [PMC free article] [PubMed] [Google Scholar]
- 18.Chapellier B, et al. A conditional floxed (loxP-flanked) allele for the retinoic acid receptor alpha (RARalpha) gene. Genesis. 2002;32(2):87–90. doi: 10.1002/gene.10071. [DOI] [PubMed] [Google Scholar]
- 19.O’Keefe SJ, Tamura J, Kincaid RL, Tocci MJ, O’Neill EA. FK-506- and CsA-sensitive activation of the interleukin-2 promoter by calcineurin. Nature. 1992;357(6380):692–694. doi: 10.1038/357692a0. [DOI] [PubMed] [Google Scholar]
- 20.Schwartz N, Schohl A, Ruthazer ES. Neural activity regulates synaptic properties and dendritic structure in vivo through calcineurin/NFAT signaling. Neuron. 2009;62(5):655–669. doi: 10.1016/j.neuron.2009.05.007. [DOI] [PubMed] [Google Scholar]
- 21.Roche KW, O’Brien RJ, Mammen AL, Bernhardt J, Huganir RL. Characterization of multiple phosphorylation sites on the AMPA receptor GluR1 subunit. Neuron. 1996;16(6):1179–1188. doi: 10.1016/s0896-6273(00)80144-0. [DOI] [PubMed] [Google Scholar]
- 22.Mammen AL, Kameyama K, Roche KW, Huganir RL. Phosphorylation of the alpha-amino-3-hydroxy-5-methylisoxazole4-propionic acid receptor GluR1 subunit by calcium/calmodulin-dependent kinase II. J Biol Chem. 1997;272(51):32528–32533. doi: 10.1074/jbc.272.51.32528. [DOI] [PubMed] [Google Scholar]
- 23.Chung HJ, Xia J, Scannevin RH, Zhang X, Huganir RL. Phosphorylation of the AMPA receptor subunit GluR2 differentially regulates its interaction with PDZ domain-containing proteins. J Neurosci. 2000;20(19):7258–7267. doi: 10.1523/JNEUROSCI.20-19-07258.2000. [DOI] [PMC free article] [PubMed] [Google Scholar]
- 24.Lee HK, Takamiya K, He K, Song L, Huganir RL. Specific roles of AMPA receptor subunit GluR1 (GluA1) phosphorylation sites in regulating synaptic plasticity in the CA1 region of hippocampus. J Neurophysiol. 2010;103(1):479–489. doi: 10.1152/jn.00835.2009. [DOI] [PMC free article] [PubMed] [Google Scholar]
- 25.Shearer KD, Stoney PN, Morgan PJ, McCaffery PJ. A vitamin for the brain. Trends Neurosci. 2012;35(12):733–741. doi: 10.1016/j.tins.2012.08.005. [DOI] [PubMed] [Google Scholar]
- 26.Zhao D, et al. Molecular identification of a major retinoic acid-synthesizing enzyme, a retinaldehyde-specific dehydrogenase. Eur J Biochem. 1996;240(1):15–22. doi: 10.1111/j.1432-1033.1996.0015h.x. [DOI] [PubMed] [Google Scholar]
- 27.Duester G. Retinoic acid synthesis and signaling during early organogenesis. Cell. 2008;134(6):921–931. doi: 10.1016/j.cell.2008.09.002. [DOI] [PMC free article] [PubMed] [Google Scholar]
- 28.Rhinn M, Dollé P. Retinoic acid signalling during development. Development. 2012;139(5):843–858. doi: 10.1242/dev.065938. [DOI] [PubMed] [Google Scholar]
- 29.Mic FA, Haselbeck RJ, Cuenca AE, Duester G. Novel retinoic acid-generating activities in the neural tube and heart identified by conditional rescue of Raldh2 null mutant mice. Development. 2002;129(9):2271–2282. doi: 10.1242/dev.129.9.2271. [DOI] [PMC free article] [PubMed] [Google Scholar]
- 30.Krezel W, Kastner P, Chambon P. Differential expression of retinoid receptors in the adult mouse central nervous system. Neuroscience. 1999;89(4):1291–1300. doi: 10.1016/s0306-4522(98)00342-x. [DOI] [PubMed] [Google Scholar]
- 31.Zetterström RH, et al. Role of retinoids in the CNS: Differential expression of retinoid binding proteins and receptors and evidence for presence of retinoic acid. Eur J Neurosci. 1999;11(2):407–416. doi: 10.1046/j.1460-9568.1999.00444.x. [DOI] [PubMed] [Google Scholar]
- 32.Olsen JV, et al. Quantitative phosphoproteomics reveals widespread full phosphorylation site occupancy during mitosis. Sci Signal. 2010;3(104):ra3. doi: 10.1126/scisignal.2000475. [DOI] [PubMed] [Google Scholar]
- 33.Lundby A, et al. Quantitative maps of protein phosphorylation sites across 14 different rat organs and tissues. Nat Commun. 2012;3:876. doi: 10.1038/ncomms1871. [DOI] [PMC free article] [PubMed] [Google Scholar]
- 34.Højlund K, et al. In vivo phosphoproteome of human skeletal muscle revealed by phosphopeptide enrichment and HPLC-ESI-MS/MS. J Proteome Res. 2009;8(11):4954–4965. doi: 10.1021/pr9007267. [DOI] [PMC free article] [PubMed] [Google Scholar]
- 35.Grimsrud PA, et al. A quantitative map of the liver mitochondrial phosphoproteome reveals posttranslational control of ketogenesis. Cell Metab. 2012;16(5):672–683. doi: 10.1016/j.cmet.2012.10.004. [DOI] [PMC free article] [PubMed] [Google Scholar]
- 36.Huttlin EL, et al. A tissue-specific atlas of mouse protein phosphorylation and expression. Cell. 2010;143(7):1174–1189. doi: 10.1016/j.cell.2010.12.001. [DOI] [PMC free article] [PubMed] [Google Scholar]
- 37.Han G, et al. Phosphoproteome analysis of human liver tissue by long-gradient nanoflow LC coupled with multiple stage MS analysis. Electrophoresis. 2010;31(6):1080–1089. doi: 10.1002/elps.200900493. [DOI] [PubMed] [Google Scholar]
- 38.Wilson-Grady JT, Haas W, Gygi SP. Quantitative comparison of the fasted and re-fed mouse liver phosphoproteomes using lower pH reductive dimethylation. Methods. 2013;61(3):277–286. doi: 10.1016/j.ymeth.2013.03.031. [DOI] [PubMed] [Google Scholar]
- 39.Banke TG, et al. Control of GluR1 AMPA receptor function by cAMP-dependent protein kinase. J Neurosci. 2000;20(1):89–102. doi: 10.1523/JNEUROSCI.20-01-00089.2000. [DOI] [PMC free article] [PubMed] [Google Scholar]
- 40.Ehlers MD. Reinsertion or degradation of AMPA receptors determined by activity-dependent endocytic sorting. Neuron. 2000;28(2):511–525. doi: 10.1016/s0896-6273(00)00129-x. [DOI] [PubMed] [Google Scholar]
- 41.Esteban JA, et al. PKA phosphorylation of AMPA receptor subunits controls synaptic trafficking underlying plasticity. Nat Neurosci. 2003;6(2):136–143. doi: 10.1038/nn997. [DOI] [PubMed] [Google Scholar]
- 42.Man HY, Sekine-Aizawa Y, Huganir RL. Regulation of alpha-amino-3-hydroxy-5-methyl-4-isoxazolepropionic acid receptor trafficking through PKA phosphorylation of the Glu receptor 1 subunit. Proc Natl Acad Sci USA. 2007;104(9):3579–3584. doi: 10.1073/pnas.0611698104. [DOI] [PMC free article] [PubMed] [Google Scholar]
- 43.Oh MC, Derkach VA, Guire ES, Soderling TR. Extrasynaptic membrane trafficking regulated by GluR1 serine 845 phosphorylation primes AMPA receptors for long-term potentiation. J Biol Chem. 2006;281(2):752–758. doi: 10.1074/jbc.M509677200. [DOI] [PubMed] [Google Scholar]
- 44.Diering GH, Gustina AS, Huganir RL. PKA-GluA1 coupling via AKAP5 controls AMPA receptor phosphorylation and cell-surface targeting during bidirectional homeostatic plasticity. Neuron. 2014;84(4):790–805. doi: 10.1016/j.neuron.2014.09.024. [DOI] [PMC free article] [PubMed] [Google Scholar]
- 45.Kim S, Ziff EB. Calcineurin mediates synaptic scaling via synaptic trafficking of Ca2+-permeable AMPA receptors. PLoS Biol. 2014;12(7):e1001900. doi: 10.1371/journal.pbio.1001900. [DOI] [PMC free article] [PubMed] [Google Scholar]
- 46.He K, Goel A, Ciarkowski CE, Song L, Lee HK. Brain area-specific regulation of synaptic AMPA receptors by phosphorylation. Commun Integr Biol. 2011;4(5):569–572. doi: 10.4161/cib.4.5.15890. [DOI] [PMC free article] [PubMed] [Google Scholar]
- 47.Goel A, et al. Phosphorylation of AMPA receptors is required for sensory deprivation-induced homeostatic synaptic plasticity. PLoS One. 2011;6(3):e18264. doi: 10.1371/journal.pone.0018264. [DOI] [PMC free article] [PubMed] [Google Scholar]
- 48.Arendt KL, et al. Retinoic acid and LTP recruit postsynaptic AMPA receptors using distinct SNARE-dependent mechanisms. Neuron. 2015;86(2):442–456. doi: 10.1016/j.neuron.2015.03.009. [DOI] [PMC free article] [PubMed] [Google Scholar]
- 49.Granger AJ, Shi Y, Lu W, Cerpas M, Nicoll RA. LTP requires a reserve pool of glutamate receptors independent of subunit type. Nature. 2013;493(7433):495–500. doi: 10.1038/nature11775. [DOI] [PMC free article] [PubMed] [Google Scholar]
- 50.Arendt KL, Sarti F, Chen L. Chronic inactivation of a neural circuit enhances LTP by inducing silent synapse formation. J Neurosci. 2013;33(5):2087–2096. doi: 10.1523/JNEUROSCI.3880-12.2013. [DOI] [PMC free article] [PubMed] [Google Scholar]
- 51.Neilson JR, Winslow MM, Hur EM, Crabtree GR. Calcineurin B1 is essential for positive but not negative selection during thymocyte development. Immunity. 2004;20(3):255–266. doi: 10.1016/s1074-7613(04)00052-4. [DOI] [PubMed] [Google Scholar]
- 52.Nam CI, Chen L. Postsynaptic assembly induced by neurexin-neuroligin interaction and neurotransmitter. Proc Natl Acad Sci USA. 2005;102(17):6137–6142. doi: 10.1073/pnas.0502038102. [DOI] [PMC free article] [PubMed] [Google Scholar]
- 53.Kaeser PS, et al. RIM proteins tether Ca2+ channels to presynaptic active zones via a direct PDZ-domain interaction. Cell. 2011;144(2):282–295. doi: 10.1016/j.cell.2010.12.029. [DOI] [PMC free article] [PubMed] [Google Scholar]