Significance
Sphingolipids are essential in eukaryotes and are particularly important in neural tissues. Generally, sphingolipids have an 18-carbon (C18) long chain base (LCB) backbone. However, low-abundance sphingolipids containing LCBs of 16 or 20 carbons have also been discovered. Yet their specific functions and biological significance is not known. This work demonstrates that elevation of 20-carbon LCBs and/or sphingolipids containing C20 LCBs has detrimental neurodegenerative effects in the brain and the retina, leading to perturbation of protein homeostasis. This work describes, for the first time to our knowledge, the specific pathological roles of a class of low-abundance LCBs in vivo.
Keywords: sphingolipid, serine palmitoyltransferase, long chain base, neurodegeneration, axon degeneration
Abstract
Sphingolipids typically have an 18-carbon (C18) sphingoid long chain base (LCB) backbone. Although sphingolipids with LCBs of other chain lengths have been identified, the functional significance of these low-abundance sphingolipids is unknown. The LCB chain length is determined by serine palmitoyltransferase (SPT) isoenzymes, which are trimeric proteins composed of two large subunits (SPTLC1 and SPTLC2 or SPTLC3) and a small subunit (SPTssa or SPTssb). Here we report the identification of an Sptssb mutation, Stellar (Stl), which increased the SPT affinity toward the C18 fatty acyl-CoA substrate by twofold and significantly elevated 20-carbon (C20) LCB production in the mutant mouse brain and eye, resulting in surprising neurodegenerative effects including aberrant membrane structures, accumulation of ubiquitinated proteins on membranes, and axon degeneration. Our work demonstrates that SPT small subunits play a major role in controlling SPT activity and substrate affinity, and in specifying sphingolipid LCB chain length in vivo. Moreover, our studies also suggest that excessive C20 LCBs or C20 LCB-containing sphingolipids impair protein homeostasis and neural functions.
Sphingolipids are lipid molecules that play essential structural and signaling functions in eukaryotes (1). Aberrant sphingolipid metabolism has been linked to many neurological diseases, including neuronal lysosomal storage diseases, Creutzfelt-Jakob disease, Alzheimer’s disease, and Parkinson’s disease (2–6). However, in most cases, due to the extreme diversity of sphingolipids and the complexity of their metabolism, it has been difficult to precisely determine the lipid species that is a key to the etiology of these diseases.
Sphingolipids are composed of a polar head group and a hydrophobic tail called ceramide, which in turn consists of a fatty acylated long chain base (LCB). It is well appreciated that the fatty acyl moiety can vary in carbon chain length, the degree of desaturation and hydroxylation, and together with the variations of the polar head group, contribute to the sphingolipid structural diversity (7). Indeed there are six distinct mammalian ceramide synthases that show substrate preference for the fatty acyl-CoAs of distinct carbon chain length (8, 9). On the other hand, the structural variation of the LCBs themselves has rarely been appreciated, although LCBs of various chain lengths have been found in gangliosides (10, 11). It was shown that in the brain, gangliosides containing 20-carbon LCBs (or called d20 gangliosides) increase with age, and it has been suggested that the ratio of d20/d18 gangliosides might be important for modulating membrane properties (11). LCBs are generated through the action of serine palmitoyltransferase (SPT), which condenses a fatty acyl-CoA, usually palmitoyl-CoA, and serine to generate LCBs. The 18-carbon (C18) chain LCBs, which are produced when palmitoyl-CoA is used as a substrate, are the most abundant class of LCBs and, as a result, sphingolipids in eukaryotes generally contain C18 LCBs. In some cases, SPT can use l-alanine or glycine as amino acid substrates, resulting in the production of 1-deoxy- and 1-deoxymethyl sphingolipids, respectively (12).
Yeast SPT is composed of two large subunits and a small subunit. Mammalian SPTs are also heterotrimeric proteins consisting of a large subunit dimer, SPTLC1 and SPTLC2 or SPTLC3, and one of two small subunits, SPTssa or SPTssb (13). Therefore, up to four SPT isoenzyme complexes can be formed by permutation. Evolving studies suggest that, besides C18 LCBs, these various combinations regulate the production of different types of LCBs, such as C16 and C20 LCBs (14, 15). For example, studies in yeast demonstrated that the small subunit of SPT could promote the use of stearoyl-CoA as the fatty acyl-CoA substrate thus generating C20 LCBs (16). A similar role for mammalian SPTssb was also demonstrated in an important report recently (17). Additional studies have shown that the SPTLC3 subunit favors the use of myristoyl-CoA as a substrate thus leading to the formation of C16 LCBs (17, 18). Thus, SPT displays substrate selectivity that is governed by the type of subunits present in the active enzyme. However, little is known about the biological significance of LCB diversity and especially the function of sphingolipids with C20 LCBs, although C20 LCBs were discovered in gangliosides in the nervous system several decades ago (10). To investigate these issues, we took advantage of a novel mouse mutant Stellar, which harbors a mutation in Sptssb, the gene encoding the small subunit b of SPT. The Stellar mutation causes enhanced production of C20 LCBs, resulting in profound neuropathological changes in the brain and the retina. Therefore, this mutant serves as a great model to understand the roles of C20 LCBs.
Results
The Stellar Mutation in Sptssb Causes Multiple Pathological Features in the Central Nervous System.
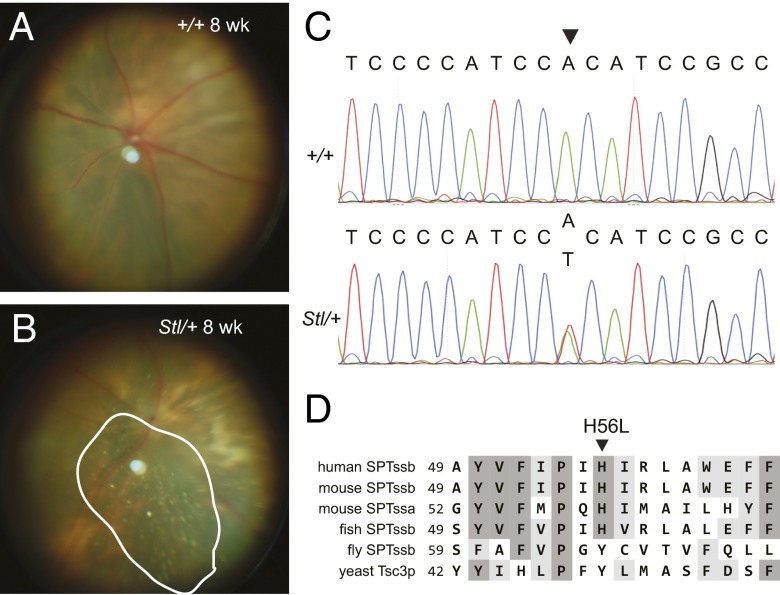
The Stellar mutant arose in the ABy/J background from the Translational Vision Research Models program (P.M.N.) at The Jackson Laboratory. Heterozygous Stellar mutants were identified by the appearance of shiny flecks in the fundus of the eye (Fig. 1 A and B). Classic recombination mapping followed by high-throughput sequencing of an exome capture library generated from Stellar mutants (details in Fig. S1A and Methods), identified an adenine-to-thymine transversion at nucleotide 167, in the coding region of the Sptssb gene that encodes a small subunit of mammalian SPT (Fig. 1C). This mutation (SptssbSt) causes a histidine-to-leucine change at amino acid 56 (H56L), in a residue that is highly conserved among vertebrates (Fig. 1D).
Fig. 1.
The Stellar mutation is in Sptssb. (A and B) Fundus images of 8-wk-old wild-type (A, +/+) and heterozygous Stellar mutant (B, Stl/+) mice. The area showing shiny flecks is circled (B). (C) Sequence traces of wild-type (+/+) and the heterozygous Stellar (Stl/+) genomic sequences around the mutation (marked by an arrowhead). (D) Alignment of human, mouse, fly, and zebrafish SPTssb, and mouse SPTssa protein sequences around the site of the Stellar mutation (marked by an arrowhead). The yeast Tsc3p sequence is shown for comparison.
Fig. S1.
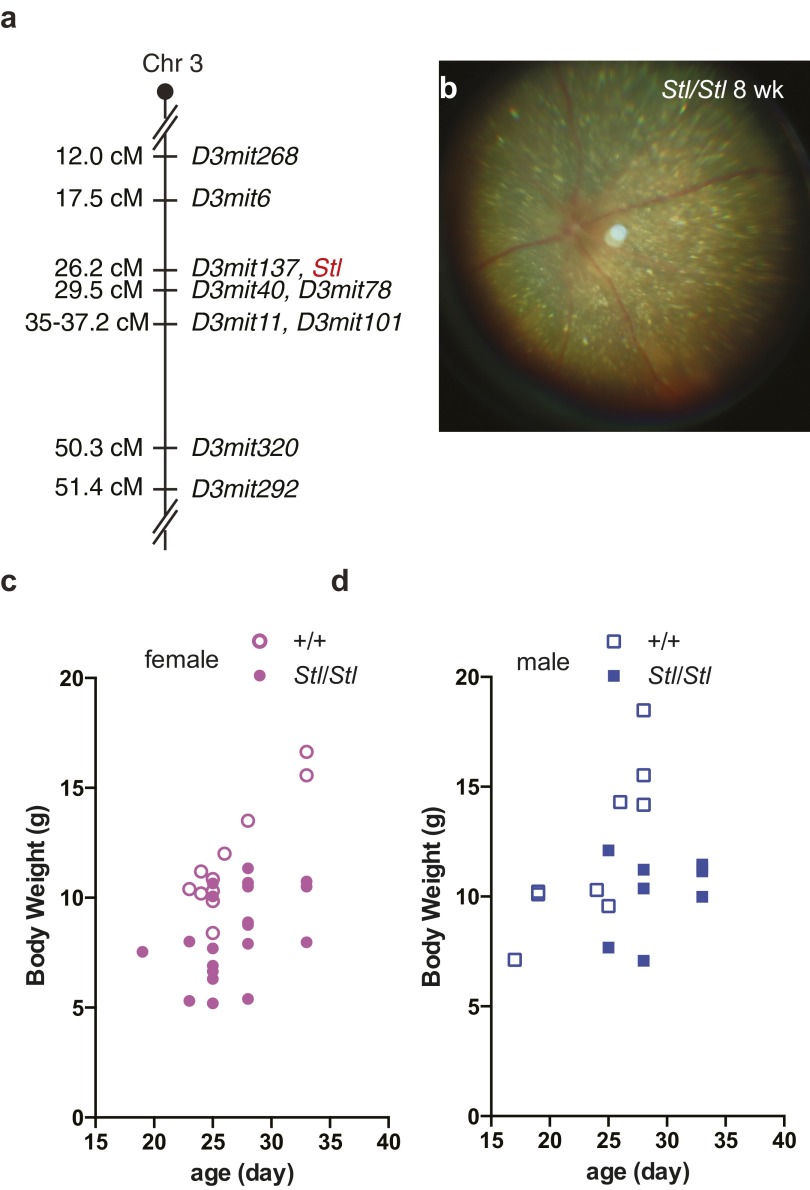
The Stellar (Stl) mutation is localized to chromosome 3. (A) Genetic map of the Stellar locus. (B) Abundant shiny flecks in 8-wk-old Stl/Stl mutant fundus. (C and D) Body weight of female (C) and male (D) wild-type (+/+, open circles or squares) and homozygous mutant (Stl/Stl, closed circles or squares) mice.
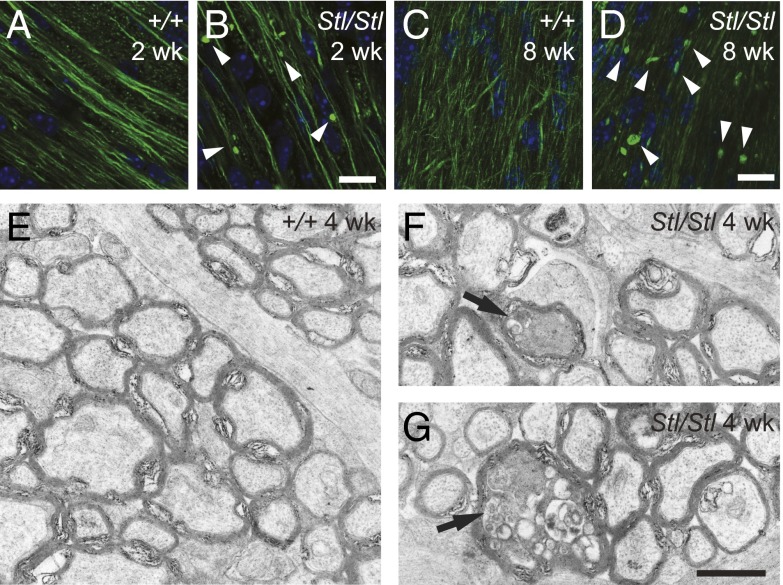
The homozygous Stellar eyes have a great number of shiny flecks (Fig. S1B). In addition, the homozygotes develop early onset ataxia, exhibit reduced body weight (Fig. S1C) and usually die prematurely around 10 wk after birth. The ataxic phenotype of the mutants prompted us to examine their brains in greater detail. We first examined the cerebellum, a region of the brain important for motor control. As early as 2 wk after birth, abnormal neurofilament H (NF-H) accumulation was observed in the cerebellar white matter (Fig. 2 A and B), typically a sign of axon degeneration (19). However, no obvious cell death or degeneration of cerebellar neuronal somas was observed. Similar abnormal neurofilament accumulation is also present in the mutant optic nerve (Fig. 2 C and D). Close examination of these structures by electron microscopy revealed degenerating axons filled with electron dense material and vacuoles (Fig. 2 E–G).
Fig. 2.
The Stellar mutation causes axon degeneration. (A–D) Neurofilament aggregates (arrowheads) in the cerebellar white matter (A and B; from 2-wk-old mice) and the optic nerve (C and D; from 8-wk-old mice). Immunohistochemistry of wild-type (A and C, +/+) and homozygous mutant (B and D, Stl/Stl) tissues with an antibody against neurofilament-H (NF-H). (Scale bar, 10 µm.) (E–G) Axon degeneration in the optic nerve. Transmission electron micrographs of 4-wk-old wild-type (E, +/+) and homozygous mutant (F and G, Stl/Stl) optic nerve cross-sections. Degenerating axons are marked with arrows. (Scale bar, 1 µm.)
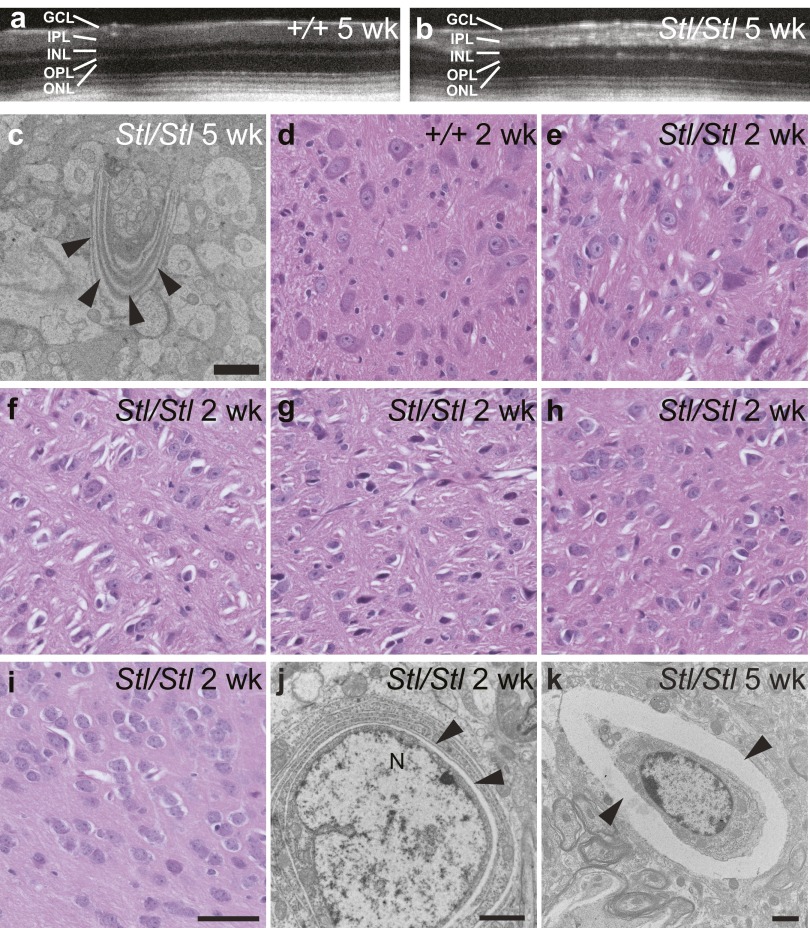
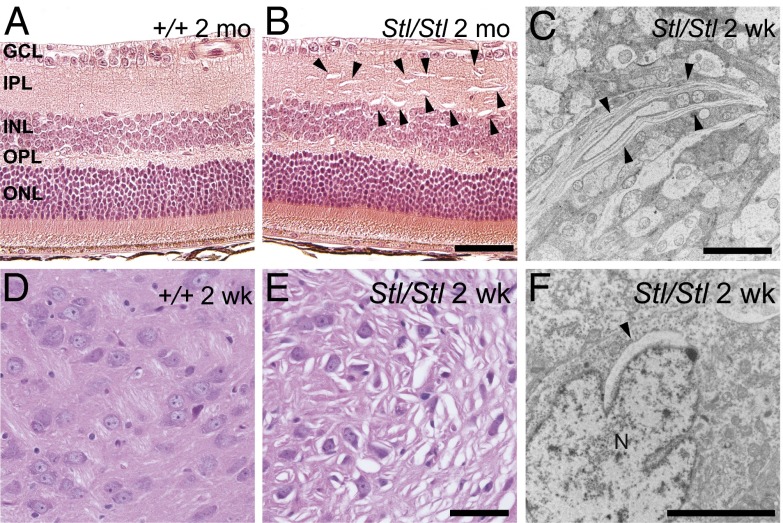
To further characterize the location and nature of the shiny flecks in the mutant fundus, we examined the retina by optical coherence tomography (OCT) and histochemistry. OCT images illustrate numerous hyperreflective areas in the inner (IPL) and outer plexiform layers (OPL) of the mutant retina (Fig. S2 A and B). This is confirmed by the presence of abnormal vacuolar structures, mainly in the OPL and IPL, shown by hematoxylin and eosin (H&E) staining (Fig. 3 A and B). The detail of these structures was revealed by transmission electronic microscopy (TEM) as aberrant membranes (Fig. 3C and Fig. S2C). We also observed abnormal vacuolar structures in many regions of the brain, including the deep cerebellar nuclei, brainstem (pons and medulla), midbrain, pontine nuclei, thalamus, and isolated areas in hypothalamus, as early as 1–2 wk after birth (Fig. 3 D and E and Fig. S2 D–I). Abnormal vacuolar structures were also found in heterozygous Stellar mice, even at a younger age, i.e., 8 wk, but were much more sparse in both the brain and the retina compared with age-matched homozygotes, although the numbers of these structures also increased with age.
Fig. S2.
The Stellar mutation causes accumulation of abnormal membranous structures in the retina and the brain. (A and B) Optical coherence tomography (OCT) of 5-wk-old wild type, +/+ (A) and Stl/Stl (B) showing the light-reflecting flecks in the mutant eye. Retinal layers are labeled as in Fig. 3. (C) An abnormal membrane structure in 5-wk-old Stl/Stl retina shown by electron micrograph. (Scale bar, 2 µm.) (D–I) H&E staining of the deep cerebellar nuclei (D and E), pons (F), and medulla (G) in the brainstem, midbrain (H), and periform cortex (I) from 2-wk-old wild-type, +/+ (D) and homozygous Stl/Stl mutant (E–I) mice. (Scale bar, 50 µm.) (J and K) Electron micrographs of cells in the thalamus (J) and brainstem (K) from 2-wk-old (J) and 5-wk-old (K) homozygous Stl/Stl mutant mice, show cavities (marked by arrowheads) juxtaposed to the nucleus (J) or surrounding the cell (K). (Scale bar, 2 µm.)
Fig. 3.
Aberrant membrane structures caused by the Stellar mutation. (A and B) Hematoxylin and eosin-stained retina from 2-mo-old wild-type (A, +/+) and homozygous mutant (B, Stl/Stl) mice. Retinal layers are labeled as follows: ganglion cell layer (GCL), inner plexiform layer (IPL), inner nuclear layer (INL), outer plexiform layer (OPL), and outer nuclear layer (ONL). (Scale bar, 50 µm.) (C) Electron micrograph of an area in the Stl/Stl retina. (Scale bar, 5 µm.) (D and E) H&E-stained sections showing the thalamus of 2-wk-old wild-type (D, +/+) and homozygous mutant (E, Stl/Stl) mice. (Scale bar, 50 µm.) (F) Electron micrographs of 2-wk-old homozygous mutant (Stl/Stl) mice showing abnormal membrane structures in the thalamus. Note the perinuclear membrane structures. N, nucleus. (Scale bar, 5 µm.) Abnormal membrane structures are marked by arrowheads (B, C, and F).
TEM revealed many of these aberrant structures to be in close proximity to the nucleus where the endoplasmic reticulum (ER) is localized, appearing as cytoplasmic cavities with distinct delimiting membranes, at 2 wk after birth (Fig. 3F and Fig. S2J). At 5 wk after birth, these abnormal structures were found primarily at the periphery of cells or in extracellular space (Fig. S2K).
Ubiquitinated Protein Accumulation in Stellar Mutant Brains.
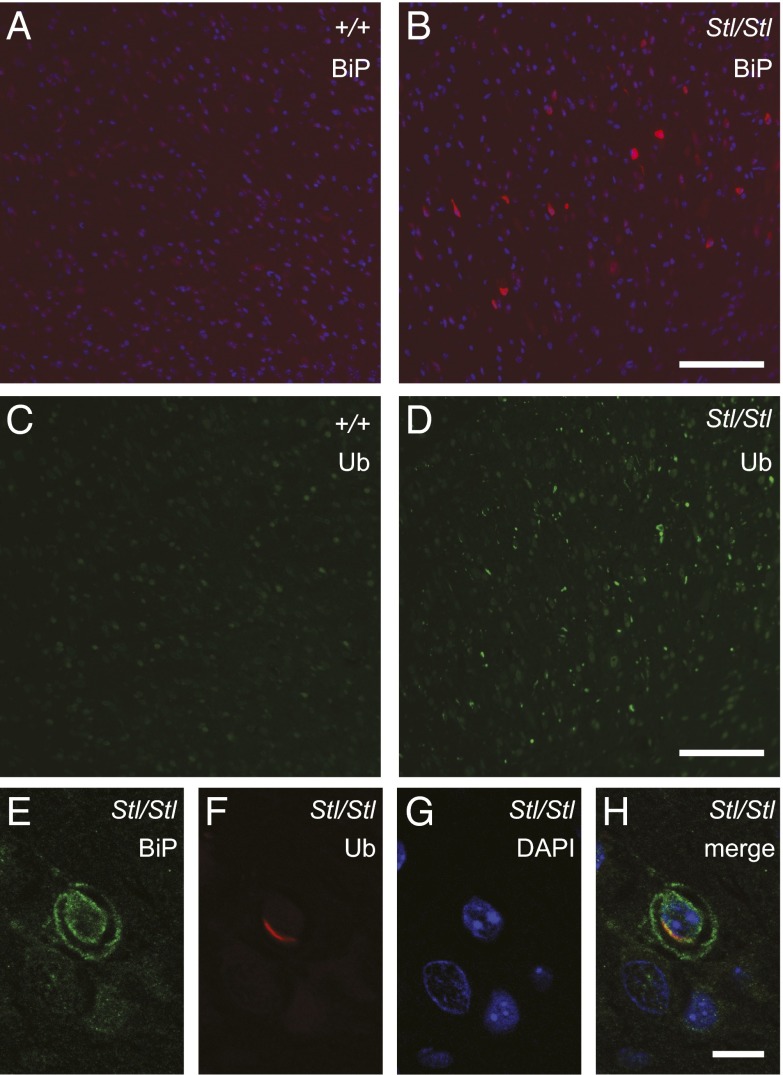
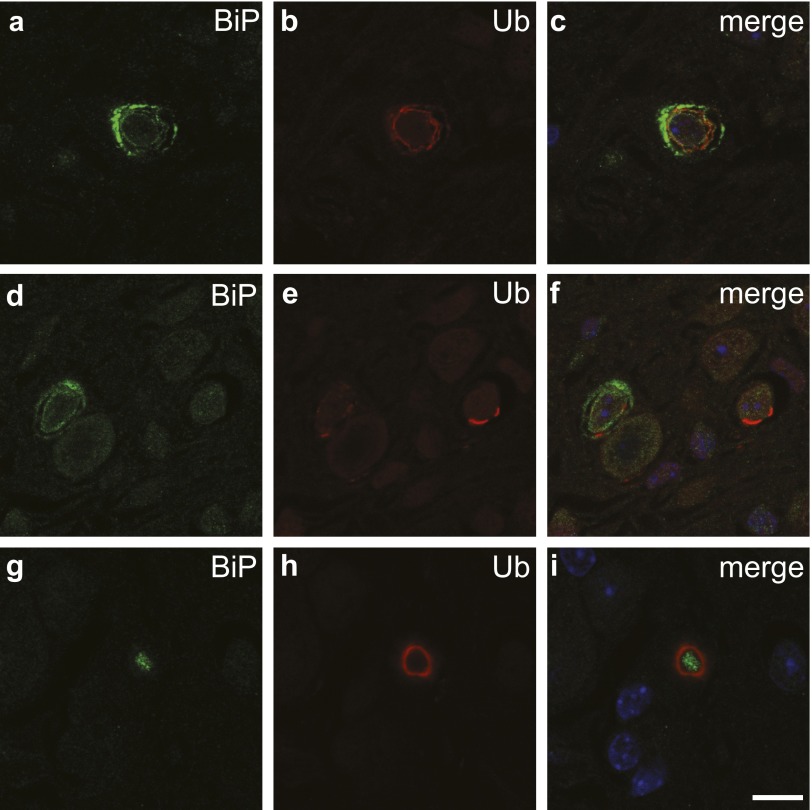
The observation of ER-associated membrane structures at the early age, e.g., 2 wk after birth, led us to hypothesize that ER functions might be impaired in Stellar mutant cells. To test this hypothesis, wild-type and Stellar mutant brain sections were stained with antibodies against binding immunoglobulin protein (BiP, also known as 78kD glucose regulated protein or GRP78), an ER molecular chaperone that is normally up-regulated by the unfolded protein response upon ER stress, and for ubiquitin, which can detect ubiquitinated protein accumulation that is often associated with ER stress and proteotoxicity (20, 21). Many cells in brainstem in the 2-wk-old homozygous Stellar mutants clearly displayed BiP accumulation, indicating ER protein homeostasis might be impaired (Fig. 4 A and B). In addition, widespread ubiquitinated protein accumulations were indeed observed in many brain regions (Fig. 4 C and D). Strikingly, at 2 wk of age, the accumulated ubiquitinated proteins were localized on membranous structures, and in some cases close to the nucleus or ER (Fig. 4 E–H and Fig. S3), indicating that they may be associated with the abnormal intracellular membrane structures that accumulate in older animals. Together, these results suggest that ER function and protein homeostasis are impaired by the Stellar mutation.
Fig. 4.
ER and protein homeostasis are impaired in the Stellar mouse brain. (A–D) BiP (A and B) or ubiquitin (C and D) immunostained sections from 2-wk-old wild-type (A and C, +/+) and homozygous mutant (B and D, Stl/Stl) mice. Images shown are from the pons region of the brainstem. (Scale bar, 100 µm.) (E–H) Ubiquitin-positive membrane-like structures in the Stl/Stl brain. Sections were immunostained with antibodies against BiP (E) and ubiquitin (F) and counterstained with DAPI to label the nucleus (G); the merged image is shown in H. (Scale bars, 10 µm.)
Fig. S3.
Ubiquitin-positive protein accumulations in the Stellar brain. Immunohistochemistry of the homozygous Stellar mutant (Stl/Stl) brain with antibodies against an ER marker BiP (A, D, and G) and ubiquitin (B, E, and H). Merged images are shown (C, F, and I). Note the ubiquitin-positive protein accumulations do not necessarily correlate with the increase of BiP levels (D–F) and sometimes are far from the soma of cells (G–I). (Scale bar, 10 µm.)
Abnormal Membrane Structures Are Largely Neuronal.
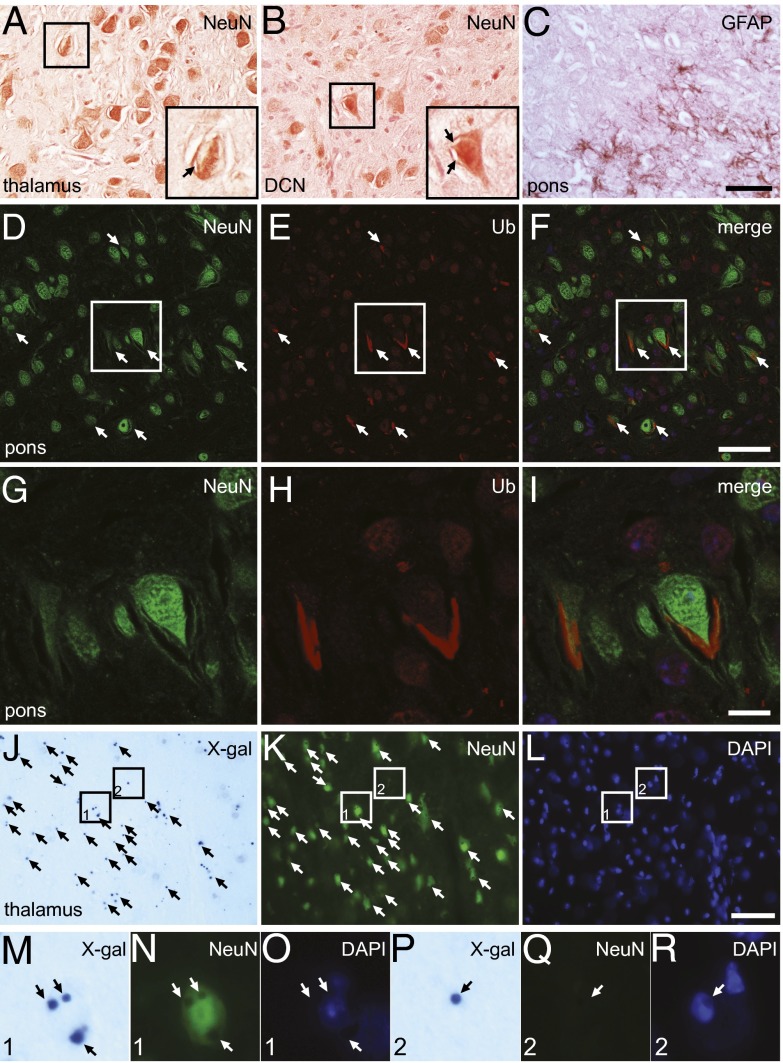
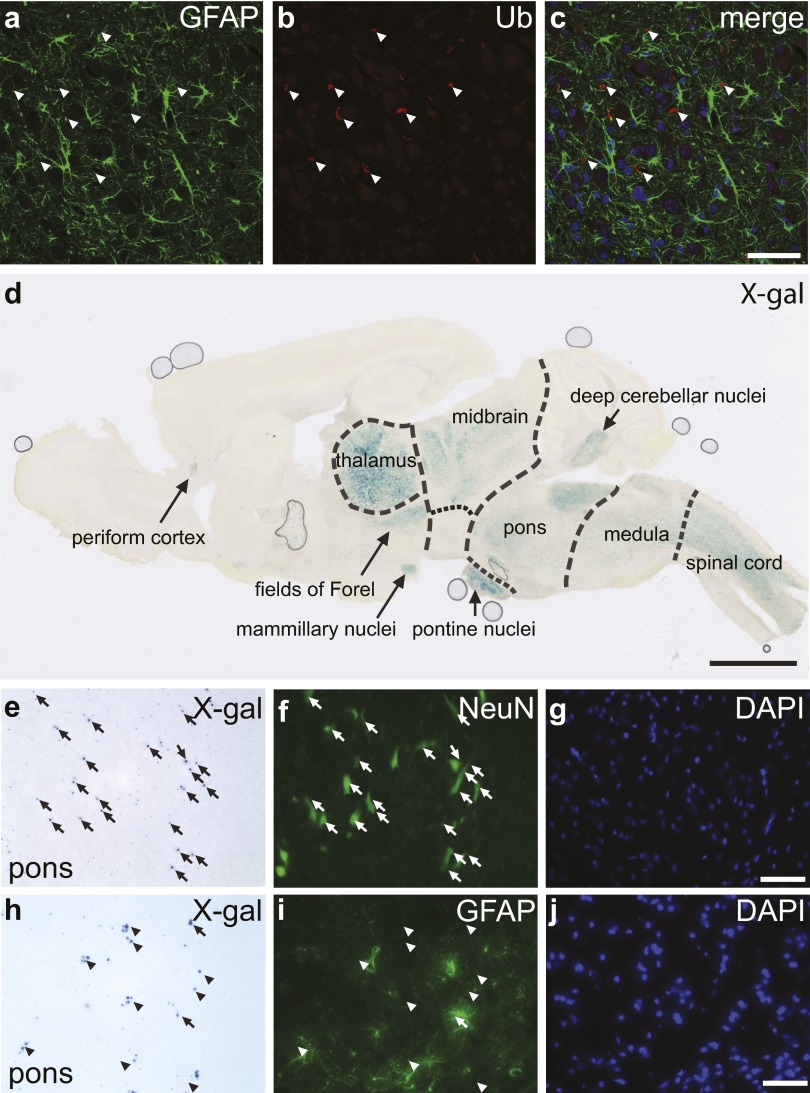
To identify the cell types harboring the abnormal membrane structures, cell-type–specific markers were examined on brain sections of Stellar homozygotes. Neurons and astroglia were detected by immunohistochemistry using antibodies against a neuronal marker neuron-specific nuclear protein (NeuN) and a glia marker glial fibrillary acidic protein (GFAP), respectively. Most abnormal membrane structures were associated NeuN-positive cells at 2 wk of age (Fig. 5 A and B). Close examination clearly revealed that many of these structures were in the NeuN-positive cells, suggesting that these structures were at least in a subset of neurons (Fig. 5 A and B, Insets). The abnormal structures were also present in areas enriched with GFAP-positive cells (Fig. 5C), but it is unclear whether they were associated with glia solely based on GFAP stain, due to the branching staining pattern of glia cells. Thus, to further determine the localization of these structures, we stained brain sections with a ubiquitin antibody and an antibody against NeuN or GFAP. We found that the ubiquitin-positive deposits were in general associated with NeuN-positive neurons (Fig. 5 D–F). Close examination clearly showed that there were intraneuronal ubiquitin-positive membrane-like structures (Fig. 5 G–I). In contrast, these ubiquitin-positive structures were never found inside GFAP-positive cells (Fig. S4 A–C). Taken together, these results suggest that the abnormal membrane-like structures are mainly in neurons.
Fig. 5.
Neuronal localization of abnormal membrane structures in the Stellar brain. (A–C) Brain sections immunostained with antibodies against NeuN (A and B) and GFAP (C). Areas in thalamus (A), deep cerebellar nuclei (DCN, B), and pons (C) are shown. Areas enclosed by rectangles in A and B are also shown in detail in Insets. Note the intracellular abnormal membrane structures (arrows). (C) GFAP-stained brain sections showing an area in pons. (Scale bar, 50 µm.) (D–I) Most ubiquitin-positive structures in the Stellar brain are neuronal. Sections were incubated with antibodies against NeuN (D) and ubiquitin (E). An area in pons is shown. The merged image is shown in F. Ubiquitin-positive structures are marked (arrows). The enclosed area is also shown in detail (G–I). (Scale bar, 50 µm in D–F and 10 µm in G–I). (J–L) X-gal–positive cells in the Sptssb knockout mouse are mostly neurons. An area of the thalamus is shown. X-gal–stained cryosection (J) was also incubated with a NeuN antibody (K), which labels neurons, and counterstained with DAPI (L). Cells positive for both X-gal stain and NeuN are marked with arrows in J and K. Areas enclosed by rectangles are enlarged in M–R. Area 1 (M–O) shows a typical neuron positive for both X-gal (Sptssb, M) and NeuN (N). Area 2 (P–R) shows a rare case in which an X-gal–positive cell (P) is negative for NeuN (R). (Scale bar, 50 µm.)
Fig. S4.
The pathological effects of the Stellar mutation are largely in neurons in the brain. (A–C) Ubiquitin-positive structures are not associated with glia. Glia cells were labeled with an antibody against GFAP (A) and ubiquitin was detected with an antibody (B). Merged image (C) shows lack of association of ubiquitin-positive structures with GFAP-positive cells. (Scale bar, 50 µm.) (D) X-gal stain of a heterozygous SptssbKO/+ brain section. (Scale bar, 2 mm.) (E–G) X-gal–positive cells are mostly neurons. An area of pons in the brainstem is shown. X-gal (E) stained cryosection was also incubated with a NeuN antibody (F), which labels neurons, and counterstained with DAPI (G). Cells positive for both X-gal stain and NeuN are marked with arrows in E and F. (Scale bar, 50 µm.) (H–J) X-gal–positive cells are rarely glia. An area of pons is shown. (H) X-gal–stained cryosection was also incubated with a GFAP antibody (I) and counterstained with DAPI (J). Locations of X-gal stain are marked with arrowheads, and X-gal stain close to a GFAP-positive cell is marked with an arrow in H and I. (Scale bar, 50 µm.)
To determine whether the pathology observed is intrinsically neuronal, we examined the expression of Sptssb in the brain, by taking advantage of a Knockout Mouse Project (KOMP2) Sptssb knockout mouse strain in which a lacZ gene in the knockout cassette is under the control of the Sptssb promoter. We stained the SptssbKO/+ heterozygous mouse brain with X-gal to show the β-galactosidase expression (Fig. S4D). X-gal stain was found highest in thalamus and pontine nuclei, and also pronounced in spinal cord, brainstem (medulla and pons), deep cerebellar nuclei, midbrain, fields of Forel and mammillary nuclei in the hypothalamus, and periform cortex. In contrast, X-gal stain was very low or nonexistent in other regions, such as cerebellar cortex, cerebral cortex, and hippocampus. Hence, the brain regions showing expression of Sptssb, or X-gal–positive, coincide with the regions harboring abnormal membrane structures.
We further examined the cell-type identity of Sptssb-positive cells in the SptssbKO/+ heterozygous brain by performing immunohistochemistry following X-gal staining, using NeuN and GFAP antibodies that label neurons and glia, respectively. Most X-gal–positive cells were also NeuN-positive (Fig. 5 J–L, Fig. S4 E–G, and detail shown in Fig. 5 M–O), although occasionally a small number of X-gal–positive cells were NeuN-negative (Fig. 5 P–R). In contrast, X-gal stain-positive cells were rarely GFAP-positive (Fig. S4 H–J). These results suggest that Sptssb is mainly expressed in neurons.
Collectively, our results suggest that the abnormal membrane structures were largely associated with neurons in which Sptssb was expressed, indicating that the effect of the Sptssb mutation is most likely intrinsic to neurons.
The Stellar Mutation Caused Elevation of C20 LCB Biosynthesis.
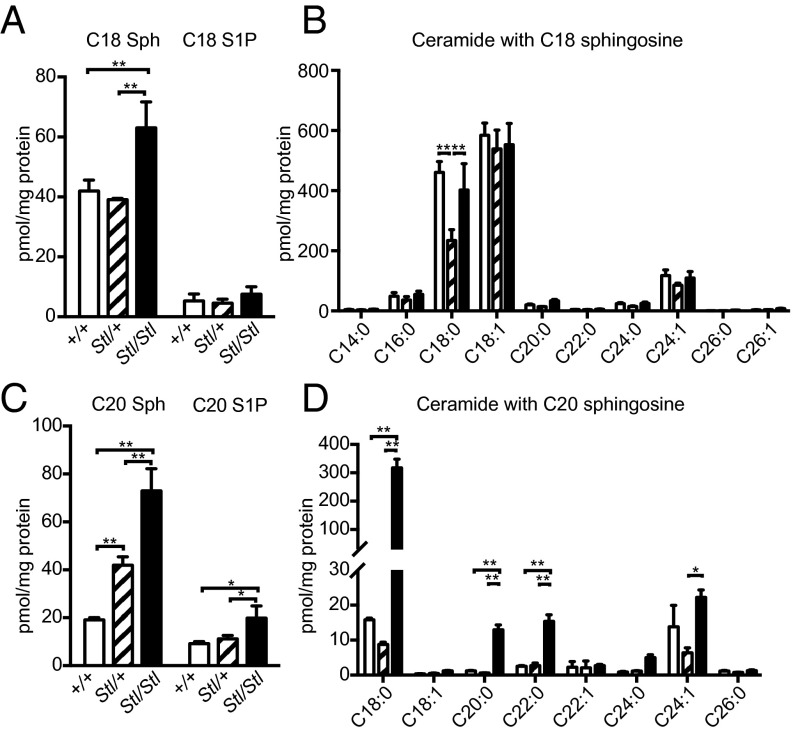
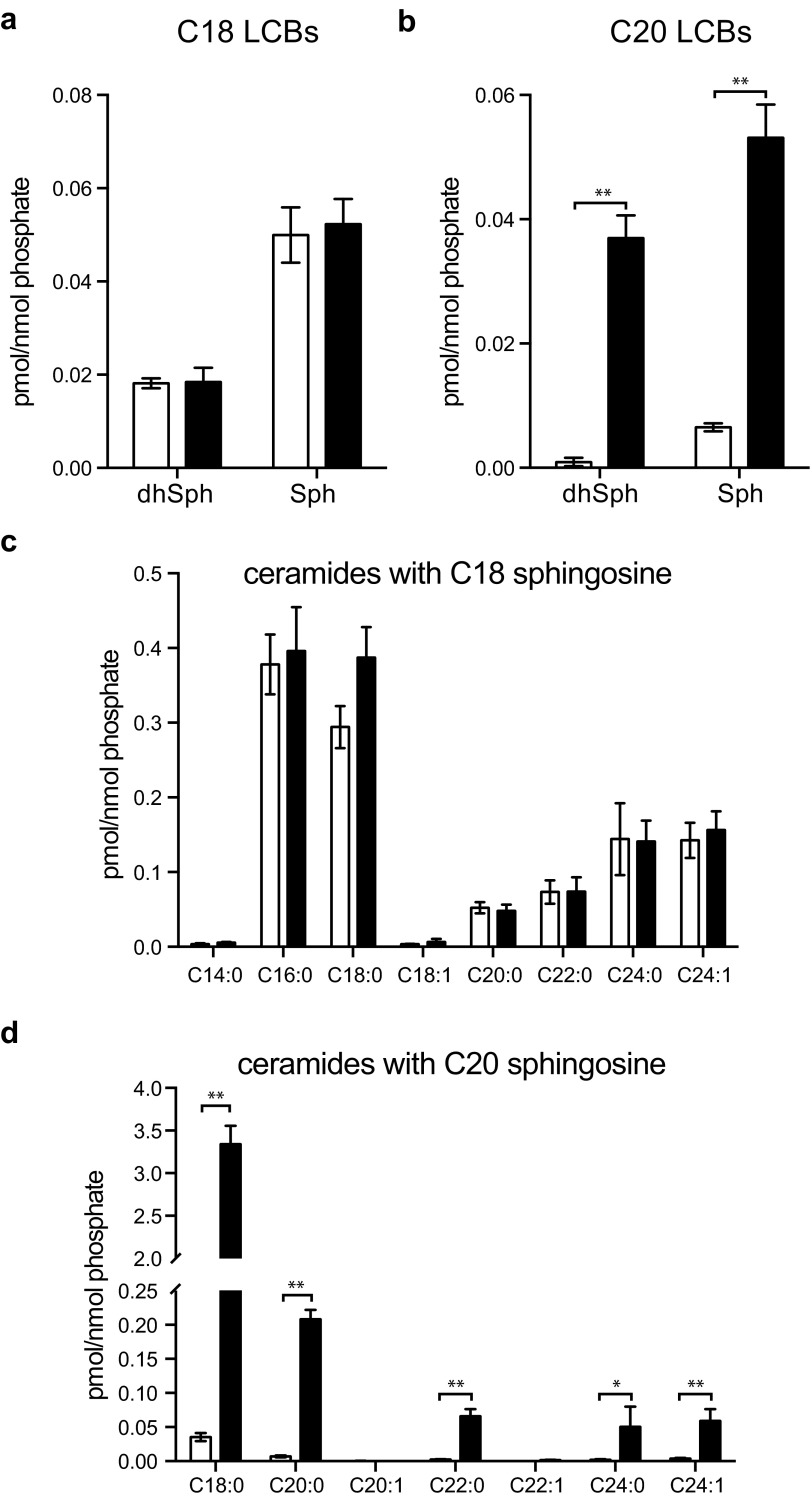
Because Sptssb encodes a small subunit of SPT, to test if the Stellar mutation affected the chain-length composition of LCBs and sphingolipids with different LCBs in vivo, we performed sphingolipid profiling using liquid chromatography coupled with tandem mass spectrometry analysis (LC-MS/MS). In both the heterozygous SptssbStl/+ and homozygous SptssbStl/Stl brains, steady-state levels of sphingolipids with C18 LCBs, such as C18 sphingosine and sphingosine-1-phosphate (S1P), and a few ceramide species containing C18 sphingosine, were modestly increased or unchanged (Fig. 6 A and B). In contrast, the levels of C20 sphingosine increased by 2- to 3-fold in the homozygotes and about 1-fold in the heterozygotes (Fig. 6C). Similarly, C20 S1P increased 1-fold in the homozygous SptssbStl/Stl brains (Fig. 6C). Consistently, the level of ceramide with C20 sphingosine was also elevated, but not all of the ceramide species exhibited the same magnitude of change. Among the ceramide species with C20 sphingosine, the ceramide with C18 fatty acyl group (C18:0 and C18:1 ceramide, or formally called d20/C18:0 and d20/C18:1 ceramide, respectively) displayed the most dramatic change of more than 15-fold (Fig. 6D). We observed a similar increase of C20 LCBs and ceramides with C20 LCBs but not C18 LCBs and ceramides with C18 LCBs in the eye (Fig. S5). We conclude, therefore, that the Stellar mutation is either a hyperactive or constitutively active allele of Sptssb that primarily promotes the synthesis of low-abundance C20 LCBs. Further, the difference of C20 LCB levels in the brain parallels the phenotypic severity in heterozygous and homozygous brains, indicating that there is a dosage effect.
Fig. 6.
The Stellar mutation results in elevation of C20 LCBs and corresponding ceramide species. (A) C18 sphingosine, (B) ceramide species with C18 sphingosine, (C) C20 sphingosine, and (D) ceramide species with C20 sphingosine in 5-wk-old wild-type (+/+; open bar; n = 4), heterozygous (Stl/+; hatched bar; n = 3), and homozygous (Stl/Stl; solid bar; n = 7) mutant brains. Ceramide species are separated based on the fatty acyl chain (B and D). The data were normalized to the amount of total protein in each sample. All values are mean ± SD *P ≤ 0.05; **P ≤ 0.01 (one-way ANOVA with multiple comparison).
Fig. S5.
Elevation of C20 LCBs in Stellar mutant eyes. (A) C18 dihydrosphingosine (dhSph) and sphingosine (Sph), (B) C20 dihydrosphingosine and sphingosine, (C) ceramide species with C18 sphingosine, and (D) ceramide species with C20 sphingosine in +/+ (open bars, n = 3) and Stl/Stl (solid bars, n = 3) eyes. Ceramide species in C and D were separated based on the fatty acyl chain. The data were normalized to the amount of lipid phosphate in each sample. All values are mean ± SD *P ≤ 0.05; **P ≤ 0.01.
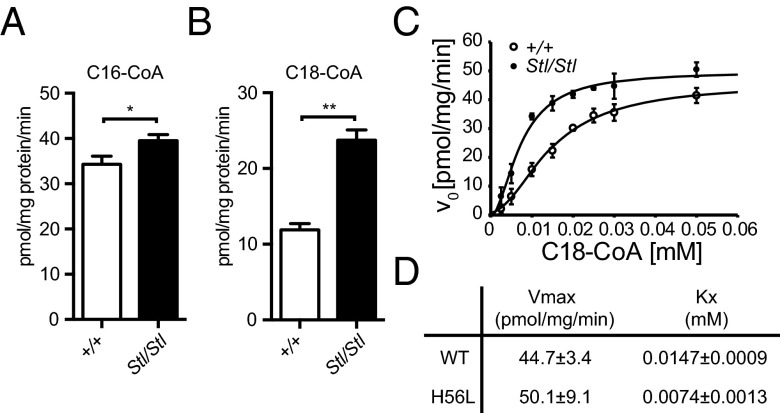
We then set out to measure the SPT enzymatic activity in the mouse brain using microsomes prepared from wild-type and mutant Sptssb brain homogenates. SptssbStl/Stl brains displayed a minor increase of SPT activity compared with the wild-type brains when the C16 palmitoyl-CoA was used as the fatty acyl-CoA substrate (Fig. 7A). However, when the C18 stearoyl-CoA was used as the fatty acyl-CoA substrate, the SPT activity in the SptssbStl/Stl brains is about onefold higher than that in the wild-type brains (Fig. 7B). These results demonstrate that the Stellar mutation of Sptssb indeed increases SPT activity.
Fig. 7.
The Stellar mutation increases SPT activity. (A and B) SPT assays using brain microsomes. Wild-type (+/+; open bars) and Stellar mutant (Stl/Stl; solid bars) brain microsomes were incubated with serine and the C16 palmitoyl-CoA (A) or the C18 stearoyl-CoA (B). A total of 0.01 mM fatty acyl-CoA was used. All values are mean ± SD *P ≤ 0.05; **P ≤ 0.01 (unpaired t test). (C) SPT activity at different C18 fatty acyl-CoA concentrations. Wild-type (+/+; open circles) and Stellar mutant (Stl/Stl; closed circles) brain microsomes were used. All values are mean ± SD. (D) Vmax and Kx (Hill’s equation) of SPT in the wild-type and the Stellar mutant (H56L) brain using the C18 stearoyl-CoA. The calculation was performed using the kinetics mode of SigmaPlot.
To test whether the mutation in SPTssb affected the affinity of the SPT complex toward the C18 fatty acyl-CoA substrate and/or promoted formation of an active SPT complex, we performed enzyme kinetics analyses with brain microsomes. Our results showed that the affinity of the SPT complex with a mutant SPTssb has two times higher affinity (50% lower Kx, based on Hill’s equation, equivalent to Km in Michaelis–Menten kinetics) toward the substrate (Fig. 7 C and D). The total amount of the active SPT complex (measured by Vmax) was slightly increased. Taken together, these data show that C18 fatty acyl-CoA substrate affinity is increased in the mutant compared with the wild type, suggesting that the Sptssb mutation is a gain-of-function mutation mainly resulting in higher substrate affinity of SPT, ultimately leading to increased C20 LCB production.
Discussion
Research in recent years has found that SPT can produce LCBs other than the commonly known C18 LCB, but in vivo LCB profiles have been missing. More importantly, it was largely unknown whether different LCBs possess specific molecular functions and pathogenic roles. Our results provide a clear snapshot of the LCB content in the nervous system. In both the brain and the eye, amounts of C20 LCBs, though lower than levels of C18 LCBs, are not negligible under the normal physiological condition in adult wild-type mouse brain and the eye, indicating that this class of LCBs may have physiological functions. Indeed, C20 LCBs were first found in some ganglioside species in the mammalian brains and were shown to increase with age (10).
Our results clearly demonstrate that unregulated production of C20 LCBs is detrimental, leading to axon degeneration and aberrant accumulation of membrane structures (Figs. 2 and 3). More interestingly, ubiquitin-positive proteins are deposited on these abnormal membrane structures (Fig. 4 and Fig. S3), indicating that protein homeostasis, i.e., membrane protein targeting and/or degradation, is impaired by excessive C20 LCB-containing sphingolipids in Stellar mutants. The increase of C20 LCBs in the Stellar mutant (SptssbH56L) tissues also suggests that under physiological conditions, the full processing capacity of SPT complexes containing wild-type SPTssb is suppressed, supporting the idea that C20 LCBs and C20 LCB-containing sphingolipids have important functions and their production is regulated. At present, it is unknown whether the suppression of SPT activity can be achieved solely through regulation by the ORM family proteins, or other mechanisms could also be in play (22, 23). The exact mechanism of this suppression will be addressed in future studies, but as our kinetics data suggest, SPTssb is likely involved in regulating SPT complex affinity toward the C18 fatty acyl-CoA substrate, and the H56L mutation increases the intrinsic catalytic activity or reduces negative regulation of the SPT heterotrimer by increasing the affinity toward an otherwise low concentration substrate (Fig. 7 C and D).
It has been demonstrated in budding yeast that heat shock leads to a spike of LCB biosynthesis, causing a moderate increase of C18 LCBs and a dramatic increase of C20 LCB levels (24, 25). The elevation of LCBs is essential for activation of signal transduction pathways required for heat stress adaptation (24, 26, 27). However, the biological significance of having different LCB chains in both the yeast mammalian cells is still not clear. In summary, our results in mammalian eye and brain provide critical support to the functional significance of the emerging complexity of bioactive sphingolipids.
Methods
Ethics Statement.
Experiments using mice have been approved by The Jackson Laboratory’s Animal Care and Use Committee according to national and international guidelines.
Mouse Strains.
The ABy/J-Stellar mutant was identified as an N-ethyl-N-nitrosourea-induced mutation from the Translational Vision Research Models Program (P.M.N.), and maintained by mating between heterozygous and wild-type siblings. The Sptssb knockout mouse, C57BL6/N(Cg)-Sptssbtm1b(KOMP)Mbp/J, was obtained from the KOMP2 consortium at The Jackson Laboratory and maintained by crossing between heterozygous siblings.
Genome Mapping and High-Throughput Genome Sequencing.
For genome mapping, heterozygous mutant Stellar mice of the ABy/J background were outcrossed with C57BL/6J mice and affected F1 mice were backcrossed to C57BL/6J mice. Mutants, with retinal flecks, were detected after dilation of pupils with 1% atropine using a Heine Omega 500 indirect ophthalmoscope with a 60-diopter aspheric lens. An initial genome scan was performed with backcrossed mice using polymorphic microsatellite markers. Additional markers were used to refine the map position to a minimal interval of 12 cM on chromosome 3 (Fig. S1). For high-throughput sequencing, high-quality genomic DNA was prepared from heterozygous mutant mice for exome capture and sequencing with an Illumina HiSeq2500. The sequencing reads within the confidence interval were filtered against known polymorphisms between C57BL/6J and ABy/J strains.
Genotyping Assays.
Allele-specific genotyping of the Stellar mice was done by PCR using annealing temperature at 65 °C, with primers LZO110 (5′-CGTGAAGGAGTATTTTGCCT-3′), LZO111 (5′-CCACATATTTTGGAGAACCTTCCCAAGCCAGGCGGTTGA-3′), and LZO112 (5′-AATTCCCAAGCCAGGCGGATCT-3′) at ratio 4:1:3. The wild-type and the mutant PCR products are 174 bp and 192 bp, respectively, and were separated on a 3.5% (wt/vol) MetaPhor agarose gel by electrophoresis. Genotyping of Sptssbtm1b(KOMP)Mbp mice was performed according to the protocol on The Jackson Laboratory website (jaxmice.jax.org/protocolsdb/f?p=116:2:0::NO:2:P2_MASTER_PROTOCOL_ID,P2_JRS_CODE:12164,023424).
Histology and Immunohistochemistry.
Histology and immunohistochemistry were conducted as described (28). Briefly, mice were perfused intracardically with 4% (wt/vol) paraformaldehyde and brains postfixed before dehydration and embedding in paraffin. For immunohistochemistry, 5-µm sections were subjected to antigen retrieval in boiling 0.01 M citrate buffer (pH 6), followed by incubation at 4 °C overnight with primary antibodies in PBS with 0.03% Triton X-100 and 5% (vol/vol) normal donkey serum. Alexa Fluor-conjugated secondary antibodies (Life Technologies, 1:200) were used for fluorescent detection. Sections were treated with 0.01% Sudan Black in 70% (vol/vol) ethanol to quench autofluorescence before counterstaining with DAPI. Sections were mounted with Fluoromount-G (Southern Biotech).
For X-gal staining, mice were perfused intracardically with 2% (wt/vol) polyformaldehyde and postfixed for 1 h. Brains were either embedded in 5% (wt/vol) low melting point agarose and cut as 100-µm sections using Vibratome (Leica) or immersed in sucrose series, embedded in Tissue-Tek OCT, and cut as 10-µm sections. Staining was performed as described (20). After X-gal staining, selected 10-µm sections were subjected to immunohistochemistry using antibodies against NeuN and GFAP, respectively, followed by incubation with biotin-conjugated secondary antibodies and peroxidase-conjugated ExtrAvidin, and (3,3′)-diaminobenzidine stain as described (20).
Goat polyclonal anti-GRP78/BiP antibody (Santa Cruz, cat. no. sc-1050), rabbit polyclonal anti-BiP antibody (Cell Signaling, cat. no. 3177), and rabbit polyclonal anti-ubiquitin antibody (DAKO, cat. no. Z0458) were used at a 1:200 dilution. Mouse monoclonal anti-ubiquitin antibody (Cell Signaling, cat. no. 3936) was used at a 1:800 dilution. Mouse monoclonal antibodies against neurofilament-H (cat no. 2826) and neurofilament-M (cat. no. 2838) were purchased from Cell Signaling and used at a 1:200 dilution. Rabbit polyclonal antibodies against NeuN (Abcam, cat. no. 177487) and GFAP (DAKO, cat. no. Z0334) was used 1:500. Fluorophor-conjugated secondary antibodies were purchased from Life Technologies and used at 1:200 dilutions.
Electron Microscopy.
Mice were perfused intracardically with a solution containing 1.2% (wt/vol) paraformaldehyde and 0.8% glutaraldehyde, and brains were processed for transmission electron micrography using a standard procedure (29).
Lipid Extraction and Analyses of Sphingolipids.
Electron spray ionization (ESI)/MS/MS analysis of endogenous sphingosine bases, sphingoid base-1-phosphates, and ceramide species (C18-sphingoid base) was performed on a Thermo Fisher TSQ Quantum triple quadrupole mass spectrometer, operating in a multiple reaction monitoring (MRM) positive ionization mode, using a protocol modified from ref. 30. Briefly, cell pellets corresponding to about 1–3 × 10⁶ cells or brain homogenates corresponding to exactly 1.5 mg of protein [i.e., half brains homogenized in 20 mM Hepes buffer, pH 7.4, 2 mM KCL, 2 mM MgCl2, 250 mM sucrose, supplemented with protease inhibitors (Roche), using a Tissue Tearor homogenizer (Biospec Products)] were fortified with internal standards (C17 d-erythro-sphingosine or C17 Sph), C17 sphingosine-1-phosphate (C17 Sph-1P), N-palmitoyl-d-erythro-C13 sphingosine (C13/C16-Cer), and heptadecanoyl-d-erythro-sphingosine (C18/C17 Cer), and extracted with an ethyl acetate/isopropanol/water (60/30/10 vol/vol) solvent system. After evaporation and reconstitution in 100 μL of 1 mM ammonium formate in 0.2% formic acid in methanol, samples were injected into the HP1100/TSQ Quantum LC/MS system and gradient eluted from the BDS Hypersil C8, 150 × 3.2 mm, 3-μm particle size column, with 1.0 mM methanolic ammonium formate/2 mM aqueous ammonium formate mobile phase system. Peaks corresponding to the target analytes and internal standards were collected and processed using the Xcalibur software system.
Quantitative analysis was based on the calibration curves generated by spiking an artificial matrix with the known amounts of the target analyte synthetic standards and an equal amount of the internal standards. The target analyte/internal standard peak-area ratios were plotted against analyte concentration. The target analyte/internal standard peak-area ratios from the samples were similarly normalized to their respective internal standards and compared with the calibration curves, using a linear regression model.
Sphingoid bases and their ceramide derivatives with 20-carbon atoms in the LCB, for which no synthetic standards are available, were quantitated using calibration curves of their C18 counterparts, taking advantage of the fragmentation pattern that is conserved for all (C13, C16, C17, C18, and C20) LCBs and their ceramide derivatives. Applying consistent mass spectral conditions of collision assistant dissociation (CAD); 35 eV and ESI, all sphingoid bases and related ceramides undergo uniform transition from initial molecular ion (M+1) to the respective sphingoid backbone secondary ions. Consequently, calibration curves, generated from authentic standards of the typical, C18-sphingosine and ceramides, can be used for quantitation of other, e.g., C20, counterparts.
The phosphate contents of the lipid extracts were used to normalize the MS measurements of eye sphingolipids. The phosphate contents of the eye lipid extracts were measured with a standard curve analysis and a colorimetric assay of ashed phosphate (31).
Microsomal Membrane Preparation.
Brain tissue was homogenized in buffer containing 10% (vol/vol) glycerol, 50 mM Tris (7.5), 1 mM EGTA, 1 mM βME, 1 mM PMSF, 1 μg/mL aprotinin, 1 μg/mL pepstatin A, 1 μg/mL leupeptin, 1 mM sodium fluoride, 1 mM sodium pyrophosphate, and 1 mM sodium orthovanadate using a 15-mL potter homogenizer for 15–20 strokes. The resulting suspension was centrifuged at 8,000 × g for 10 min. The supernatant was spun at 100,000 × g for 45 min. The pellet was homogenized in 20 mL of the above buffer and centrifuged at 100,000 × g for 45 min. The resulting pellet was homogenized in 0.5–1.0 mL of 30% (vol/vol) glycerol, 50 mM Tris (7.5), 1 mM βME, 1 mM EGTA, 1 μg/mL aprotinin, 1 μg/mL pepstatin A, and 1 μg/mL leupeptin and stored at −80 °C.
SPT Assay Using Brain Microsomes.
The reaction was started by adding 200 µg of microsomal membrane to a reaction mixture (final volume 300 µL) containing 50 mM Hepes (8.1), 20 µM BSA, 50 µM pyridoxal phosphate, 3 µM serine, 20 µCi 3H serine, and the indicated concentration of palmitoyl- or stearoyl-CoA. After the 20-min reaction time, NH4OH to a final 0.25 M was added, followed by the addition of 1.5 mL of CHCl3:methanol (1:2), and vortexed. Long chain bases were extracted by adding 1 mL CHCl3 and 2 mL of 0.5 M NH4OH, vortexing and centrifuging briefly. The upper aqueous layer was aspirated off and the lower layer was washed with 2 mL of 30 mM KCl and centrifuged. The washing was carried out three times and 0.83 mL of the sample was dried and counted.
Data Analysis.
All numeric data except the enzyme kinetics data were graphed with GraphPad Prism 6 and statistical analyses were performed using unpaired t test, or one-way ANOVA with multiple comparison. The enzyme kinetics studies were plotted and analyzed by using the kinetics mode of the SigmaPlot software (SYSTAT).
Acknowledgments
We thank Dr. Chuck Dangler for his assistance in mouse pathology, Dr. Anna Lisa Lucido for editorial comments, and the Medical University of South Carolina Lipidomics Core for the mass spectrometry analyses. This research is supported by NIH Grants EY016501 (to P.M.N.) and NS075447 (to L.Z.). The expense of SPT enzymatic assays is supported by NIH Grant HD080181 (to T.M.D.). The Jackson Laboratory sequencing, histology, and imaging services were supported by Institutional Grant CA34196. The JAX KOMP2 program is supported by Grant OD011185.
Footnotes
The authors declare no conflict of interest.
This article is a PNAS Direct Submission.
This article contains supporting information online at www.pnas.org/lookup/suppl/doi:10.1073/pnas.1516733112/-/DCSupplemental.
References
- 1.Bartke N, Hannun YA. Bioactive sphingolipids: Metabolism and function. J Lipid Res. 2009;50(Suppl):S91–S96. doi: 10.1194/jlr.R800080-JLR200. [DOI] [PMC free article] [PubMed] [Google Scholar]
- 2.Ben-David O, Futerman AH. The role of the ceramide acyl chain length in neurodegeneration: Involvement of ceramide synthases. Neuromolecular Med. 2010;12(4):341–350. doi: 10.1007/s12017-010-8114-x. [DOI] [PubMed] [Google Scholar]
- 3.Tamai Y, et al. Creutzfeldt-Jakob disease: Alteration in ganglioside sphingosine in the brain of a patient. Neurosci Lett. 1979;11(1):81–86. doi: 10.1016/0304-3940(79)90060-0. [DOI] [PubMed] [Google Scholar]
- 4.Platt FM. Sphingolipid lysosomal storage disorders. Nature. 2014;510(7503):68–75. doi: 10.1038/nature13476. [DOI] [PubMed] [Google Scholar]
- 5.Kolter T, Sandhoff K. Sphingolipid metabolism diseases. Biochim Biophys Acta. 2006;1758(12):2057–2079. doi: 10.1016/j.bbamem.2006.05.027. [DOI] [PubMed] [Google Scholar]
- 6.Haughey NJ, Bandaru VV, Bae M, Mattson MP. Roles for dysfunctional sphingolipid metabolism in Alzheimer’s disease neuropathogenesis. Biochim Biophys Acta. 2010;1801(8):878–886. doi: 10.1016/j.bbalip.2010.05.003. [DOI] [PMC free article] [PubMed] [Google Scholar]
- 7.Hannun YA, Obeid LM. Many ceramides. J Biol Chem. 2011;286(32):27855–27862. doi: 10.1074/jbc.R111.254359. [DOI] [PMC free article] [PubMed] [Google Scholar]
- 8.Stiban J, Tidhar R, Futerman AH. Ceramide synthases: Roles in cell physiology and signaling. Adv Exp Med Biol. 2010;688:60–71. doi: 10.1007/978-1-4419-6741-1_4. [DOI] [PubMed] [Google Scholar]
- 9.Mullen TD, Hannun YA, Obeid LM. Ceramide synthases at the centre of sphingolipid metabolism and biology. Biochem J. 2012;441(3):789–802. doi: 10.1042/BJ20111626. [DOI] [PMC free article] [PubMed] [Google Scholar]
- 10.Rosenberg A, Stern N. Changes in sphingosine and fatty acid components of the gangliosides in developing rat and human brain. J Lipid Res. 1966;7(1):122–131. [PubMed] [Google Scholar]
- 11.Sonnino S, Chigorno V. Ganglioside molecular species containing C18- and C20-sphingosine in mammalian nervous tissues and neuronal cell cultures. Biochim Biophys Acta. 2000;1469(2):63–77. doi: 10.1016/s0005-2736(00)00210-8. [DOI] [PubMed] [Google Scholar]
- 12.Penno A, et al. Hereditary sensory neuropathy type 1 is caused by the accumulation of two neurotoxic sphingolipids. J Biol Chem. 2010;285(15):11178–11187. doi: 10.1074/jbc.M109.092973. [DOI] [PMC free article] [PubMed] [Google Scholar]
- 13.Lowther J, Naismith JH, Dunn TM, Campopiano DJ. Structural, mechanistic and regulatory studies of serine palmitoyltransferase. Biochem Soc Trans. 2012;40(3):547–554. doi: 10.1042/BST20110769. [DOI] [PubMed] [Google Scholar]
- 14.Pruett ST, et al. Biodiversity of sphingoid bases (“sphingosines”) and related amino alcohols. J Lipid Res. 2008;49(8):1621–1639. doi: 10.1194/jlr.R800012-JLR200. [DOI] [PMC free article] [PubMed] [Google Scholar]
- 15.Russo SB, Tidhar R, Futerman AH, Cowart LA. Myristate-derived d16:0 sphingolipids constitute a cardiac sphingolipid pool with distinct synthetic routes and functional properties. J Biol Chem. 2013;288(19):13397–13409. doi: 10.1074/jbc.M112.428185. [DOI] [PMC free article] [PubMed] [Google Scholar]
- 16.Cowart LA, Hannun YA. Selective substrate supply in the regulation of yeast de novo sphingolipid synthesis. J Biol Chem. 2007;282(16):12330–12340. doi: 10.1074/jbc.M700685200. [DOI] [PubMed] [Google Scholar]
- 17.Han G, et al. Identification of small subunits of mammalian serine palmitoyltransferase that confer distinct acyl-CoA substrate specificities. Proc Natl Acad Sci USA. 2009;106(20):8186–8191. doi: 10.1073/pnas.0811269106. [DOI] [PMC free article] [PubMed] [Google Scholar]
- 18.Hornemann T, et al. The SPTLC3 subunit of serine palmitoyltransferase generates short chain sphingoid bases. J Biol Chem. 2009;284(39):26322–26330. doi: 10.1074/jbc.M109.023192. [DOI] [PMC free article] [PubMed] [Google Scholar]
- 19.Petzold A. Neurofilament phosphoforms: Surrogate markers for axonal injury, degeneration and loss. J Neurol Sci. 2005;233(1-2):183–198. doi: 10.1016/j.jns.2005.03.015. [DOI] [PubMed] [Google Scholar]
- 20.Zhao L, Longo-Guess C, Harris BS, Lee JW, Ackerman SL. Protein accumulation and neurodegeneration in the woozy mutant mouse is caused by disruption of SIL1, a cochaperone of BiP. Nat Genet. 2005;37(9):974–979. doi: 10.1038/ng1620. [DOI] [PubMed] [Google Scholar]
- 21.Zhao L, Ackerman SL. Endoplasmic reticulum stress in health and disease. Curr Opin Cell Biol. 2006;18(4):444–452. doi: 10.1016/j.ceb.2006.06.005. [DOI] [PubMed] [Google Scholar]
- 22.Han S, Lone MA, Schneiter R, Chang A. Orm1 and Orm2 are conserved endoplasmic reticulum membrane proteins regulating lipid homeostasis and protein quality control. Proc Natl Acad Sci USA. 2010;107(13):5851–5856. doi: 10.1073/pnas.0911617107. [DOI] [PMC free article] [PubMed] [Google Scholar]
- 23.Gururaj C, Federman RS, Chang A. Orm proteins integrate multiple signals to maintain sphingolipid homeostasis. J Biol Chem. 2013;288(28):20453–20463. doi: 10.1074/jbc.M113.472860. [DOI] [PMC free article] [PubMed] [Google Scholar]
- 24.Dickson RC, et al. Sphingolipids are potential heat stress signals in Saccharomyces. J Biol Chem. 1997;272(48):30196–30200. doi: 10.1074/jbc.272.48.30196. [DOI] [PubMed] [Google Scholar]
- 25.Jenkins GM, et al. Involvement of yeast sphingolipids in the heat stress response of Saccharomyces cerevisiae. J Biol Chem. 1997;272(51):32566–32572. doi: 10.1074/jbc.272.51.32566. [DOI] [PubMed] [Google Scholar]
- 26.Jenkins GM. The emerging role for sphingolipids in the eukaryotic heat shock response. Cell Mol Life Sci. 2003;60(4):701–710. doi: 10.1007/s00018-003-2239-0. [DOI] [PMC free article] [PubMed] [Google Scholar]
- 27.Friant S, Lombardi R, Schmelzle T, Hall MN, Riezman H. Sphingoid base signaling via Pkh kinases is required for endocytosis in yeast. EMBO J. 2001;20(23):6783–6792. doi: 10.1093/emboj/20.23.6783. [DOI] [PMC free article] [PubMed] [Google Scholar]
- 28.Zhao L, Rosales C, Seburn K, Ron D, Ackerman SL. Alteration of the unfolded protein response modifies neurodegeneration in a mouse model of Marinesco-Sjögren syndrome. Hum Mol Genet. 2010;19(1):25–35. doi: 10.1093/hmg/ddp464. [DOI] [PMC free article] [PubMed] [Google Scholar]
- 29.Bechtold L. Ultrastructural Evaluation of Mouse Mutations. In: Sundberg J, Dawnalyn B, editors. Systematic Approach to Evaluation of Mouse Mutations. CRC Press; Boca Raton, FL: 2000. [Google Scholar]
- 30.Bielawski J, et al. Comprehensive quantitative analysis of bioactive sphingolipids by high-performance liquid chromatography-tandem mass spectrometry. Methods Mol Biol. 2009;579:443–467. doi: 10.1007/978-1-60761-322-0_22. [DOI] [PubMed] [Google Scholar]
- 31.Van Veldhoven PP, Bell RM. Effect of harvesting methods, growth conditions and growth phase on diacylglycerol levels in cultured human adherent cells. Biochim Biophys Acta. 1988;959(2):185–196. doi: 10.1016/0005-2760(88)90030-6. [DOI] [PubMed] [Google Scholar]


