

Significance
Cell line derivation is a complex process and a major challenge outside of mammalian systems. Here we take an unbiased genomic approach to characterize a Drosophila embryonic culture system allowing the efficient derivation of cell lines of still unknown origins. We reveal that commonly immortalized cells are related to adult muscle precursors (AMPs), a stem cell-like population contributing to adult muscles and sharing properties with vertebrate satellite cells. Remarkably, the cells retain the ability to differentiate terminally in vitro. We also confirm in vivo a previously unidentified regulator of AMP proliferation predicted by our analysis. Our study reveals the potential of this genetically controlled progenitor culture system to provide key missing resources to the Drosophila toolbox for cell-based assays.
Keywords: time series, RNA-Seq, immortalization, Drosophila
Abstract
The use of time series profiling to identify groups of functionally related genes (synexpression groups) is a powerful approach for the discovery of gene function. Here we apply this strategy during RasV12 immortalization of Drosophila embryonic cells, a phenomenon not well characterized. Using high-resolution transcriptional time-series datasets, we generated a gene network based on temporal expression profile similarities. This analysis revealed that common immortalized cells are related to adult muscle precursors (AMPs), a stem cell-like population contributing to adult muscles and sharing properties with vertebrate satellite cells. Remarkably, the immortalized cells retained the capacity for myogenic differentiation when treated with the steroid hormone ecdysone. Further, we validated in vivo the transcription factor CG9650, the ortholog of mammalian Bcl11a/b, as a regulator of AMP proliferation predicted by our analysis. Our study demonstrates the power of time series synexpression analysis to characterize Drosophila embryonic progenitor lines and identify stem/progenitor cell regulators.
The highly coordinated expression of genes functioning in common processes is a widespread phenomenon from bacterial operons (1) to eukaryotic synexpression groups (2). Because of the strong correlation between cofunction and coexpression (2), inferring gene function based on covariation of expression profiles (called “guilt by association”) is a powerful approach in functional genomics. Importantly, because biological systems are dynamic, recording gene expression over a time series rather than determining a static single measurement can greatly facilitate the characterization of coregulated genes in a particular process.
Using a Drosophila embryonic culture system, cell lines can be derived efficiently from primary cell cultures established from embryos expressing constitutively active RasV12 (3). This process is progressive, with the cell lines reaching a stable state within approximately 6 mo. This system provides a unique opportunity to apply a time-series profiling approach to discover synexpression groups in essential biological processes involved in cell immortalization such as cell-cycle regulation, epigenetic regulation, and cellular differentiation. Furthermore, this unbiased transcriptomic approach can provide insights into the unknown origins, regulators, and properties of the immortalized cells.
Here, we perform the first, to our knowledge, in-depth genomic and temporal characterization of five Drosophila embryonic cell lines during their establishment. Analysis of differential expression between early and late time points of the cultures indicated that most cell lines reached a similar stable state reminiscent of neurogenic and myogenic progenitor types. To uncover groups of functionally related genes, we applied systematic synexpression network analyses clustering genes with correlated expression profile dynamics, using high-resolution time-series profiling datasets. By analyzing the transcriptional signature of a module associated with the transcription factor twist (twi), we found that the immortalized cells are related to adult muscle precursors (AMPs), a stem cell-like population contributing to adult muscles (4–7). Consistently, treatment of the immortalized cells with ecdysone, a steroid hormone triggering adult muscle differentiation (8), induced in vitro terminal myogenic differentiation. Our coexpression network analysis further predicted a number of candidate regulators of AMPs, allowing us to validate the transcription factor CG9650, an ortholog of the mammalian genes Bcl11a/b, as a previously unidentified regulator of AMP proliferation. In conclusion, we show the value of this newly characterized Drosophila embryonic progenitor culture system for time-series genomic approaches to identify stem/progenitor cell regulators.
Results
Generation of Immortalized Cell Lines.
We established primary cultures from Act5C > UAS-RasV12, UAS-GFP embryos in which ubiquitously expressed Gal4 drives the expression of both RasV12 and GFP (Fig. 1) (3). In early passages, the cultures showed heterogeneous cell morphologies with different levels of GFP and exhibited nonuniform growth across the flasks, suggesting that some cells proliferated more rapidly than others. However, in later passages the cells appeared more homogeneous, suggesting that a single or a few cell types predominated. We successfully derived seven cell lines (R1–R7) from independent primary cultures. All seven lines showed similar passage kinetics before they reached a stable state, and different phases could be distinguished based on the shortening of passage times over a 6-mo period: 3–4 wk for passage 1 (P1), 5–20 d for P2–P12, and less than 7 d after P15 (Fig. 2). Most cell lines now have undergone more than 60 passages, equivalent to 120–240 population doublings.
Fig. 1.

A time-series profiling approach to characterize RasV12 embryonic cell lines by identifying synexpression groups. Seven independent primary cultures were established from Act5C > UAS-RasV12, UAS-GFP embryos, in which ubiquitously expressed Gal4 drives the expression of both RasV12 and GFP. High-resolution time-series profiling using RNA-Seq and Affymetrix arrays were generated by sampling five cultures at different passages during cell line derivation over a period of 6 mo. Differential expression of up-regulated genes at late, compared with early, time points, was performed to identify genes associated with the establishment of the final stage of the cultures. Prioritizing these genes, we generated a network of genes with highly correlated temporal expression profiles in the time-series datasets, leading to the identification of synexpression groups.
Fig. 2.

Primary culture development is characterized by a progressive shortening and stabilization of the passage time. (A) The number of days to confluence at each passage number is shown for the seven cultures R1–R7. Cultures were diluted 1:2 from P1 to P13 and 1:4 after P14 (data were normalized for comparison with the 1:2 dilutions). (B) Morphology of cultured cells at P0, P4, and P12. Images shown are representative of all the lines.
Most Cell Lines Reach a Similar State.
To characterize the sequence of events associated with cell line establishment, we generated transcriptional time series from five cell lines by sampling the cultures at successive stages, early (P2–4), intermediate (P4–11), and late (P16–19), characterized by different passage times (Fig. 2). The time series for the R3 and R7 cell lines were analyzed using Affymetrix arrays, and those for R1, R4, and R5 were analyzed using next-generation sequencing (SI Methods). Because the cell lines were derived using similar conditions but from independent primary cultures, we first asked whether they progressed similarly during establishment by looking at broad patterns of expression. Principal component analyses (PCA) (Fig. S1) showed for all cell lines a similar clustering pattern of the samples ordered according to the stage of the cultures (early, intermediate, and late) along the first axis, accounting for 33% and 40% of the variance in RNA-Seq and Affymetrix array datasets, respectively (Fig. S1). Furthermore, the plots highlighted the similarity between the early time points of all cell lines and also suggested that the R3 and R7 cell lines reached a similar final stage, as did the R1 and R4 cell lines. However, despite similar initial conditions, the R5 cell line behaved differently from the R1 and R4 lines, rapidly reaching a different late state (Fig. S1B).
Fig. S1.

PCA of time-series samples highlights similarities between most cell lines at early and late time points, respectively. (A) PCA for the R3 and R7 cell lines (analyzed by Affymetrix arrays). (B) PCA for the R1, R4, and R5 cell lines (analyzed by RNA-Seq). Time points corresponding to different stages of the cultures are color-coded: red, early; green, late; and blue, intermediate.
To characterize the states reached by the cell lines, we analyzed their transcriptomes at the latest stages of the cultures. Genes that were up- or down-regulated at late, compared with early, time points for each culture were identified (SI Methods) (Fig. 3A, Fig. S2, and Datasets S1, S2, and S3). Gene ontology (GO) category enrichment was performed on each gene list using the DAVID analysis tool (Fig. 3B, Fig. S2B, and Datasets S4 and S5). Analysis of down-regulated gene expression revealed a common immune response at early time points in all cell lines, potentially reflecting the stress associated with the establishment of the primary cultures (Fig. S2B). Despite some differences, comparisons of the up-regulated genes among the lines revealed global similarities, based on enrichments of GO categories (described in the next sections), in the R1, R3, R4, and R7 cell lines, with partial differences with the R5 cell line (Fig. 3B), as is consistent with the PCA analysis.
Fig. 3.

Time-series transcriptome analyses reveal that most RasV12 cell lines reach a similar state. (A) Venn diagram showing the number of up-regulated genes (in parenthesis) at late, compared with early, passages in the R1, R3, R4, and R7 cell lines. (B) Heat map showing the results of GO category enrichment performed on the genes up-regulated at late time points compared with early time points in each cell line. Scale is in negative log2 P value. Yellow, highly significant; blue, not significant.
Fig. S2.

Analysis of down-regulated genes at late time points compared with early time points reveals an early immune response in all cell lines. (A) Venn diagram showing the number of down-regulated genes (in parenthesis) at late, compared with early, passages in the R1, R3, R4, and R7 cell lines. (B) GO category enrichment performed on the common down-regulated genes in the R3, R7, R1, and R4 cell lines using FlyMine and Padj < 0.1.
A Proliferative State Associated with the E2 Promoter Binding Factor/Retinoblastoma Protein Pathway.
GO category enrichment revealed that cell-cycle and cell-division genes represent the most common significantly up-regulated genes in all RasV12 lines (Fig. 3B and Fig. S3). Interestingly, this set contains many known gene targets of the E2 promoter binding factor/retinoblastoma protein (E2F/RB) pathway (highlighted in Fig. S3) (9–11) that plays a central role in cell proliferation and cell growth and which is disrupted in virtually all human cancers (12). It includes regulators of cell-cycle progression, such as Cyclin A (Cyc A) in all cell lines (11); string (stg) (13), dacapo (dap) (14), and Cyclin-dependent kinase 2 (cdc2c) in the R1 and R4 cell lines (9); and Cyclin E (Cyc E) in the R4 cell line (15). Some of them promote the G1/S (Cyc A, Cyc E) (15, 16) or G2/M (stg) (13) transitions or both (cdc2c) (9). Importantly, genes that have been shown to be rate-limiting for E2F1-dependent cell proliferation (17) also are up-regulated in most cell lines. These include tumbleweed (tum), sticky (sti), and pavarotti (pav) in all cell lines; stg and double parked (dup) in the R1, R3, and R4 cell lines; and dap, Origin recognition complex subunit 2 (Orc2), and Minichromosome maintenance 2 (Mcm2) in the R1 and R4 cell lines (17). Taken together, these data suggest that the enhanced proliferation of these cells reflects increased E2F activity.
Fig. S3.

The genes commonly up-regulated at late time points compared with early time points belong to four GO categories: cell cycle, chromatin organization, neuron, and muscle organ development. Log2 ratios of the expression levels of genes up-regulated at late, compared with early, time points in each corresponding time series. Only genes up-regulated in at least both the R1 and R4 cell lines are displayed. In the heat maps, blue indicates a decrease in gene expression; yellow indicates an increase in gene expression; gray indicates no Affymetrix probeset. Color coding of gene targets: yellow squares indicate gene targets of the E2F pathway; red squares indicate gene targets of the E2F pathway that are rate-limiting for E2F-dependent proliferation; the orange square indicates a component of PRC1; the pink squares indicate components of PRC2.
Increasing Levels of Polycomb Group Expression in Established Cell Lines Suggest an Undifferentiated State.
Significantly for the R1, R3, R4, and R7 cell lines, the chromatin organization category indicated that the lines were characterized by an epigenetic state associated with increasing levels of Polycomb Group (PcG) transcripts during the immortalization process (Fig. 3B and Fig. S3). These transcripts corresponded to components of two cooperating protein complexes: Pc-repressive complexes 1 (PRC1) and 2 (PRC2). Encoding a PRC1 core component, Posterior sex combs (Psc) was up-regulated in all cell lines. Of the genes encoding PRC2 components, rpd3 was up-regulated in all cell lines; Su(z)12 was up-regulated in the R1, R4, and R7 cell lines; Polycomb-like (Pcl) was up-regulated in the R1, R3, and R4 cell lines; and Enhancer of zeste [E(z)] was up-regulated in the R4 and R7 cell lines (highlighted in Fig. S3 and Dataset S4). PcG proteins are transcriptional repressors of developmental programs (18) and are expressed at high levels in stem and progenitor cells (19). They are important regulators of stem-cell maintenance in both the undifferentiated and proliferative states (20–22). Therefore, the increased levels of PcG transcripts during cell line establishment indicate a proliferative undifferentiated progenitor-like state.
Immortalized Cell Lines Have Common Tissue Type Origins.
Similar GO category enrichment in the R1, R3, R4, and R7 cell lines revealed that they shared similar origins, including neuronal and myogenic tissue types (Fig. 3B and Fig. S3). The statistically significant GO categories include “neuron development,” “neuron differentiation,” and “muscle organ development.” They included genes involved in the regulation of neuronal precursors/neuroblasts, such as Kruppel (Kr) (23) and SoxNeuro (SoxN) (24), and genes expressed in muscle progenitors, such as Mef2, Kr, Kirre, and kontiki (kon) (25–28). Mef2 expression in R1, R3, R7, and R4 cells was confirmed by immunofluorescence staining (3). No significant GO terms associated with tissue type were found for the R5 cell line, so that the origin of this cell population is unclear. Taken together, these data suggest that the cell lines contain proliferative populations of undifferentiated cells from different lineages, among which neuron and muscle lineages are selected consistently. Thereafter, we focused our analysis on the most similar lines.
To determine the state of the cell lines further, we compared the data with modENCODE datasets on available Drosophila cell lines (Fig. S4) (29). First we checked the percentage of common up-regulated genes in the generated lines that were expressed in each of the modENCODE cell lines (SI Methods). Of note, a standard adjusted P value (Padj) cutoff could not be used to select the up-regulated genes in our study because of the lack of true biological replicates and because we were comparing datasets from two different technology platforms, RNA-Seq and Affymetrix arrays. The analyses performed on the R1, R3, R4, and R7 cell lines to find common up-regulated genes yielded 121 genes without using a Padj cutoff (Fig. 3 and Fig. S5A) and 43 genes using the cutoff Padj < 0.15 (Figs. S5B and S6A). To address the issue of false positives, we performed a permutation test (SI Methods and Fig. S5) giving statistical confidence (P value = 1E-04) to both gene lists. In these lists, the highest percentages of expressed genes were found mostly in disc cell lines and specifically in the Dmd8 line (62 and 65%, respectively) (Fig. S4A). Similarly, comparison of the late time points of the R1, R4, and R5 cell lines analyzed by RNA-Seq with modENCODE datasets by Spearman rank correlation analysis (Fig. S4B) suggested that the generated cell lines are most similar to the Dmd8 line, a line derived from wing discs with AMP characteristics (30).
Fig. S4.

Comparison of the RasV12 cell lines with the modENCODE cell lines. (A) Percentage of common up-regulated genes expressed in the cell lines analyzed by modENCODE. (B) Spearman rank correlation analysis between the late time points of the RasV12 (R1, R4, and R5) cell lines and the cell line RNA-Seq data from modENCODE.
Fig. S5.

Distribution plots of the number of genes common to the R1, R3, R4, and R7 cell lines obtained in permutation experiments performed as described in SI Methods. (A) Permutation test using parameters of the Venn diagram in Fig. 3. (B) Permutation test using parameters of the Venn diagram in Fig. S6A. The number of common up-regulated genes observed in the data is indicated in red.
Fig. S6.

Coexpression network analysis using more stringent criteria also identifies a specific cluster associated with the transcription factor twi. (A) A Venn diagram showing in parentheses the number of genes up-regulated at late, compared with early, passages in the R1, R3, R4, and R7 cell lines when using Padj < 0.15 (SI Methods). (B)The network is focused on commonly up-regulated genes (43 seeds) in the R1, R3, R4, and R7 cell lines. Genes in all datasets with expression profiles highly correlated (correlation coefficient ≥0.8) to the seeds are in yellow. Seeds with similar expression profiles are found in six clusters (Dataset S7). The twi cluster is highlighted in the dashed frame.
Coexpression Network Analysis Identifies a Transcriptional Signature Reminiscent of AMPs.
To isolate clusters of coregulated genes revealing tissue-specific transcriptional signatures, we generated a gene coexpression network grouping genes with similar expression profile dynamics across time series (Fig. 4 and Figs. S6 and S7). First, we prioritized as seeds the 121 genes that are commonly up-regulated by at least 1.3-fold at late, compared with early, time points in most cell lines (including the R1, R3, R4, and R7 cell lines but excluding the R5 cell line from the first step of the analysis because it reached a different late stable state) (Fig. 3A and Dataset S2). Second, using the five time-series datasets, we searched for all the genes with an expression profile highly correlated (coefficient correlation ≥0.8) with each of the seed profiles; after additional filtration (SI Methods), this search identified eight clusters (Dataset S6). A second network analysis using more stringent criteria (selection of gene seeds with Padj < 0.15, yielding 43 genes) was performed also (Fig. S6 and Dataset S7).
Fig. 4.

Coexpression network topology identifies a specific cluster associated with the transcription factor twi. The network is focused on commonly up-regulated genes (called “seeds”) in the R1, R3, R4, and R7 lines. Genes in all datasets with expression profiles highly correlated (correlation coefficient ≥0.8) to the seeds are in yellow. Seeds with similar expression profiles are found in eight clusters shown in different colors: dark or light blue, green, purple, and pink. The twi cluster is highlighted in the dashed frame. The network is shown at higher magnification in Fig. S7.
Fig. S7.

The coexpression network identifies a specific cluster associated with the transcription factor twi. The network is focused on commonly up-regulated genes (seeds) in the R1, R3, R4, and R7 cell lines. Genes in all datasets with highly correlated expression profiles (correlation coefficient ≥0.8) to the seeds are in yellow. Seeds with similar expression profiles are found in eight clusters associated with twi (dark blue), Tsp66E (light blue), scf (light green), Rps5b (light purple), tum (purple), sty (dark pink), sti (dark green), and Traf4 (pink). GO category enrichment is indicated next to each cluster. The twi cluster is highlighted in the dashed frame.
In both analyses, the network topology exhibited an isolated cluster associated with the transcription factor twi (Fig. 4 and highlighted in Fig. S6B), reflecting the high specificity of the correlated expression profiles. Although GO category enrichment performed on the eight clusters indicated broad categories such as cell cycle and chromatin modification (Fig. S7 and Dataset S8), the twi cluster was associated with the specific significant category “muscle organ development.” Interestingly, many genes of this cluster have been reported to be expressed in AMPs, which are stem cell-like cells set aside during embryogenesis that contribute to adult muscles (4–7). These genes include the transcription factor Twi, whose expression is retained in AMPs until they differentiate (4, 31) and also kon, heartless (htl), trol, ugt58Fa, Enhancer of split m6, Bearded family member (m6), and CG9650) (Figs. 4 and 5 and Fig. S7) (27, 32). Additional genes reported to be expressed in AMPs did not pass the stringent criteria of the correlation analysis but still are up-regulated during most cell line establishment (Fig. 5). Taken together, the global combinatorial coexpression signature strongly points toward an AMP origin of the cell lines.
Fig. 5.

The transcriptional signature of the twi module is reminiscent of that of AMPs. The heat map shows gene expression of components of the twi module (correlation coefficient ≥0.75). Green squares: markers of AMPs; orange squares: expressed in AMPs but role not characterized; yellow squares: associated with cancer. Genes below the white line have a correlation coefficient below 0.75 but were found to be up-regulated during the time course and are expressed with a known function in AMPs. Log2 ratios of the expression levels are represented. Blue indicates a decrease in gene expression; yellow indicates an increase in gene expression.
In addition to revealing an identity of the immortalized cells, the clustering analysis identifies candidate regulators of AMPs. Importantly, 11 genes [nervy (nvy), CG14995, CG9650, trol, FER ortholog (Homo sapiens) (FpS95D), Ugt58Fa, CG9171, midkine and pleiotrophin 2 (Miple2), BM-40-secreted protein acidic and rich in cysteine (SPARC), serrano (sano), and MYPT-75D] exhibited an expression profile similar to that of twi, with correlation coefficients ≥0.75 and with unknown function in AMPs (Figs. 4 and 5). Consistent with this finding, four of these genes (CG9650, BM-40-SPARC, Ugt58Fa, and trol) are expressed in AMPs (32, 33). Two of them have been associated with regulation of proliferation. The heparan sulfate proteoglycan (HSPG) trol can be secreted from EGF receptor (Egfr)-overexpressing wing imaginal disc epithelia and drive the overproliferation of AMPs (34). Although the role of BM-40-SPARC is not known in AMPs, this multifunctional calcium-binding glycoprotein associated with the ECM (35) is a direct modulator of several mitotic factors (36) and is up-regulated during skeletal muscle regeneration involving the activation/proliferation of satellite cells (37).
Immortalized AMP-Like Cells Differentiate into Muscle Cells in Response to the Steroid Hormone Ecdysone.
Because the immortalized cells exhibited a transcriptional signature reminiscent of progenitor cells, we attempted to differentiate them to reveal their tissue of origin. Reasoning that continuous MAPK activity inducing a proliferative state could antagonize differentiation, we first attempted to inhibit the MAPK pathway using treatment with the MAPK/ERK kinase (MEK) inhibitor U0126. As a result, we observed cell death of the RasV12 cells after 24 h by visual inspection and TUNEL assay, but no effect was observed in S2R+ and Kc cell lines (Fig. S8 A and B). Although the drug inhibited MEK (as checked by readout of decreased levels of phospho-ERK in Fig. S8 C and D) in all cell lines, the effect was very diverse in terms of survival/cell death, with the RasV12 lines being particularly sensitive to MAPK activity. However, no cell differentiation was observed. No apparent effect was observed when the cells were treated with Akt or PI3K) inhibitors (SI Methods).
Fig. S8.

Treatment of the RasV12 cell lines with an inhibitor of the MAPK pathway induces apoptosis. The R1, S2R+, and Kc cell lines were treated with either the MEK inhibitor UO126 at 10 µM or DMSO (mock treatment) after 24 h. (A) Microscope images. (B) A TUNEL assay was performed as described in SI Methods. (B, a, c, e, g, i, and k) DAPI staining is shown in blue. (B, b, d, f, h, j, and l) Apoptotic cells (red) were visualized with a fluorescent microscope. Representative samples are shown. (C and D) Controls for the effectiveness of the drug inhibiting MEK by Western blot analysis. (C) Anti-pERK and anti-ERK. (D) Ratios of pERK normalized to ERK.
Using our predictive analysis on AMPs, we devised a hormonal treatment (SI Methods) mimicking adult muscle differentiation during metamorphosis. Remarkably, treatment of the R1 cell line with ecdysone induced dramatic changes in cell morphology within 24 h. As cells elongated, they started to express the muscle terminal differentiation marker myosin heavy chain (mhc) (Fig. 6 A and B), whereas Twi expression was down-regulated (Fig. 6 A and B). Quantitative PCR (qPCR) analysis quantified the increase in expression of mhc (threefold) and Tropomyosin (Tm) (2.5-fold) (Fig. 6C). Expression of Mef2, a critical component of adult muscle differentiation and a target of ecdysone (8), also was increased (2.5-fold) (Fig. 6C). We also observed similar effects in the R3, R4, and R7 cell lines, although with variable efficiency. Occasionally, contractile muscle cells were found in culture, suggesting terminal myogenic differentiation of the cells. This treatment was ineffective in the R5 cell line; no R5 cells stained for mhc, as is consistent with the disappearance of the AMP transcriptional signature from this cell line at late passages. Taken together, these results confirm a muscle progenitor origin for most cells and reveal the reversibility of the RasV12 immortalization phenotype.
Fig. 6.
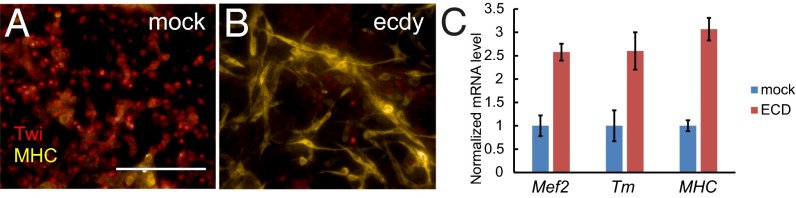
Immortalized AMP-like cells differentiate in vitro into muscle cells in response to ecdysone treatment. (A and B) Immunofluorescence staining showing Twi (anti-Twi, red) and MHC expression (anti-MHC, yellow) in cells that were mock treated (A) or treated with ecdysone (B) after 24 h. (Scale bar, 100 μm.) (C) Relative quantification of known muscle differentiation markers by qPCR, comparing ecdysone and mock-treated R1 cells. Data are shown as mean ± SE (n = 3).
CG9650 Is a Regulator of AMP Proliferation.
To test the role of a previously unidentified factor in AMP regulation, we examined the role of the zinc-finger–containing putative transcription factor CG9650, which is orthologous to the mammalian genes Bcl11a/b. Highly correlated (coefficient correlation >0.9) with the twi profile in all cell lines, CG9650 is a strong candidate for a role in AMPs. It is expressed in the mesoderm (38), in the embryonic nervous system where it has been implicated in axon guidance (39), and in AMPs (33). Previous overexpression experiments have suggested that CG9650 influences Notch signaling in sensory organ and eye development and/or cell viability (40), FGF signaling (41), and growth or cell-cycle progression in the developing eye (42).
To characterize the role of CG9650 in AMPs, we depleted CG9650 in AMPs by RNAi using the AMP-specific Gal4 drivers 1151-Gal4 or Mef2-Gal4 (7, 43). During larval development, AMPs for adult flight muscles are found in the ventral region of the wing imaginal disc below the epithelial cells that give rise to the body wall and are labeled by Twi antibody. They proliferate during the L2 and L3 stages (7). Knockdown of CG9650 by RNAi during the AMP proliferation stage resulted in a reduction of both the number and layers of the Twi+ cells in the late L3 wing disc (Fig. 7 A–D). An assay for cell mitosis showed that the number of AMPs proliferating in the knockdown animals was half that in control individuals (Fig. 7E), indicating that CG9650 knockdown affects the number of proliferating AMPs.
Fig. 7.

CG9650 is required for the proliferative activity of AMPs and is regulated by the Notch pathway. Two different CG9650 RNAi lines expressed using the AMP-specific Gal4 drivers 1151-Gal4 or TubGal80ts; dMef2-Gal4 (TD-Gal4) resulted in pupal lethality when shifted from 18 °C to 29 °C at early second instar. Further validation was performed using the CG9650-R1 Drosophila transgenic RNAi line and the TD-Gal4 driver. (A–D) Late third-instar discs stained for Twi (anti-Twist, green) in control (A) and TD-Gal4 > UAS-CG9650 RNAi (B), with optical sections of the wing discs in C and D, respectively. (E) Quantification of number of PH3+ AMPs following CG9650 down-regulation using TubGal80ts; Dmef2-Gal4 > UAS-CG9650 RNAi. Gal80 repression was relieved from early second instar until late third instar by shifting from 18 °C to 29 °C. The data are shown as mean ± SD. (n = 5). (F) Relative quantification of CG9650 and other known Notch targets by qPCR, comparing R1 cells treated with the Notch pathway inhibitor DAPT and mock-treated cells. Data are shown as mean ± SE (n = 3).
To investigate the role of CG9650 in RasV12-induced overproliferation further (Fig. S9), we first established an assay for this phenomenon in AMPs. We expressed RasV12 in AMPs during the larval proliferation phase using Dmef2-Gal4 and then assayed mitotic activity at late third instar using the phospho-histone 3 (PH3) antibody (SI Methods). Strikingly, a marked increase in the number of mitotically active cells was observed in RasV12-expressing AMPs (Fig. S9G). The longer the induction of RasV12 expression, the higher was the number of PH3+ cells (more than two-fold after 24 h of induction) compared with controls (Fig. S9G). Furthermore, the number and layers of Twi+ cells were increased (Fig. S9 A, B, D, and E). To test the role of CG9650 in the context of RasV12 overproliferation, we drove the expression of RasV12 and CG9650 RNAi together in AMPs. The coexpression led to a less severe overgrowth than seen with RasV12 expression alone (Fig. S9 B, C, E, F, and H), with fewer proliferative cells and a decrease in the layers of Twi-labeled cells, although not to the level seen in controls. These results are consistent with a requirement for CG9650 in the RasV12-induced overproliferation phenotype.
Fig. S9.

CG9650 is required for proliferative activity of RasV12-expressing AMPs. (A–F) Late third-instar discs stained for Twi (anti-Twist, green) in control (A), in TubGal80ts; Dmef2-Gal4 > UAS-RasV12 (B), and in TubGal80ts; Dmef2-Gal4 > UAS-CG9650 RNAi; UAS-RasV12 (C) cells, with an optical section of the wing disc shown in D, E, and F, respectively. (Scale bars, 50 μm.) (G and H) Quantification of the number of PH3+ AMPs in the RasV12 expression using TubGal80ts; Dmef2-Gal4 > UAS-RasV12 (G) and in the simultaneous RasV12 expression and CG9650 down-regulation using TubGal80ts; Dmef2-Gal4 > UAS-CG9650 RNAi; UAS-RasV12 (H). Gal80 repression was relieved from early third instar until late third instar by shifting from 18 °C to 29 °C. All plots show mean ± SD (n = 5).
Strikingly, CG9650 is coexpressed with targets of the Notch pathway (twi, m6, and him) (Fig. 5), suggesting that CG9650 might be regulated by Notch signaling. Treatment of RasV12 cells with the Notch pathway inhibitor N-[N-(3,5-Difluorophenacetyl)-L-alanyl]-S-phenylglycine t-butyl ester (DAPT) for 24 h down-regulated CG9650 expression by 40% (Fig. 7F), similar to its effect on other known Notch targets including twi, him, and m6. This result suggests that CG9650 is a bona fide Notch target in the immortalized cells, is consistent with a previous report indicating that CG9650 is a Notch target in Dmd8 cells (33), and also is consistent with the activity of Notch signaling in maintaining AMPs in a proliferative state during larval stages (7, 44).
SI Methods
Cell Culture.
The five cell lines were derived as previously described in Simcox et al. (3) from primary cultures of embryos collected overnight at 17 °C from the cross UAS-RasV12, UAS-GFP × Act5C/TM6, Tb. The cell lines have been deposited at the Drosophila Genomics Resource Center.
RNA Isolation.
Cells were lysed using buffer RLT (QIAGEN) or TRIzol (Thermo Fisher) for microarray and RNA-seq samples, respectively. RNA was extracted according to the manufacturer’s directions. The quality of each RNA sample was confirmed using a Bioanalyzer (Agilent Technologies).
RNA Expression Measured on Expression Array.
Each sample of the R3 and R7 cell line time series was prepared using the GeneChip 3′ IVT Express Kit (Affymetrix) and hybridized on whole-genome Drosophila Affymetrix arrays (Affymetrix GeneChip Drosophila Genome 2.0 Array), using standard procedures at the Microarray Core Facility of the Dana-Farber Cancer Institute. Array readouts were normalized using dChip (57) and were converted into log2 ratios of the expression level of each gene to the mean expression value of this gene at early passage time points to plot expression profiles. Time points for the R3 time series were P2, P2 (replicate), P5, P6, P7, P8, P16, P17, and P19; time points for the R7 time series were P2, P2 (replicate), P3, P4, P7, P8, P16, P17, and P19.
RNA Expression Measured by RNA-Seq.
Five micrograms of long RNA species from the time series of the R1, R4, and R5 cell lines were depleted from rRNAs using the Ribo-Zero rRNA Removal Kit (Human/Mouse/Rat; Epicentre). RNA integrity and rRNA depletion efficiency were assessed on a Bioanalyzer (Agilent Technologies). RNA-Seq libraries were prepared starting with 50 ng of rRNA-depleted RNAs following the manufacturer’s instructions (ScriptSeq v2 RNA-Seq; Epicentre). Thirty-two libraries were multiplexed, clustered, and sequenced on a Hi-Seq Illumina sequencer in paired-end sequencing runs of 76 cycles. Time points for the R1 time series were P2, P3, P4, P5, P7, P8, P10, P11, P16, P17, and P19; time points for the R4 time series were P2, P3, P4, P5, P6, P7, P9, P11, P12, P16, P17, and P19; and time points for the R5 time series were P2, P3, P4, P6, P7, P8, P16, P17, and P19.
Computational Analyses.
Reads were mapped to the Drosophila melanogaster genome (Berkley Drosophila Genome Project release 5/dm3) and were annotated using TopHat (v1.4.1) and a custom Bowtie index (Bowtie v0.12.8) based on Drosophila annotated transcripts from FlyBase release dmel-r5.43. We determined read counts using Bedtools (58) and normalized counts with DESeq v1.8.2 (59) and the R package. To generate expression profiles, normalized counts were converted into log2 ratios of the expression level of each gene to the mean expression value of this gene at early-passage time points.
Analysis of Differential Expression.
Differential expression analysis between early and late passage time points was performed using dChip and DESeq for microarray and RNA-Seq data, respectively. For technical reasons, biological replicates could not be generated. Therefore, to gain statistical significance, samples with consecutive passages in a short time window were treated as biological replicates. Early- and late-passage samples included samples from P2–P4 and P6–P19, respectively. This sample grouping was strongly supported by PCA performed using R and provided by the Harvard Chan Bioinformatics Core, Harvard T. H. Chan School of Public Health, Boston, MA (Fig. S1). Pairwise comparisons showed Pearson correlations higher than 0.9665 for all pairs of samples, thus providing a quality control for high consistency in the processing of the samples (Dataset S9).
Microarray data were filtered by mean expression value at late-passage time points (≥50) for reliably detectable expressed genes. Using this threshold, ∼44% of the genes detected on the array were expressed in the late time points (6,643 and 6,637 genes were detected in the late time points for the R3 and R7 cell lines, respectively). To select the up-regulated genes, we used a fold-change cutoff of 1.3 resulting from the ratio of the mean expression value of time points at late passages to the mean expression value of time points at early passages. As a result, 1,216 and 944 genes were up-regulated at late, compared with early, time points in the R3 and R7 cell lines, respectively (Dataset S1). Then two analyses were performed either using no Padj cutoff or Padj <0.15.
Similar to the microarray data analysis, normalized RNA-Seq data were filtered by mean expression at late passages (normalized counts ≥50, resulting in 7,159, 7,203, and 7,225 detectable genes expressed in the R1, R4, and R5 cell lines, respectively). The mean of the normalized values of early and late time points was calculated by pooling P2–P4 and P16–P19, respectively. Next, we identified the significantly up-regulated genes with a fold-change cutoff ≥1.3 using a two-way comparison. As a result, 1,061, 1,305, and 860 genes were up-regulated at late, compared with early, time points in the R1, R4, and R5 cell lines, respectively (Dataset S1). Then two analyses were performed using either no Padj cutoff or Padj <0.15.
Down-regulated genes were selected by mean expression value at early time points (≥50) and using a fold-change cutoff of −1.5 (Dataset S3).
Venn diagrams were generated using tools developed by Chris Seidel (www.pangloss.com/seidel/Protocols/venn.cgi).
GO term enrichment was performed using the DAVID analysis tool (https://david.ncifcrf.gov/) (60, 61) (Datasets S4 and S5). The most significant GO categories were selected that had P values less than 0.05 and a false-discovery rate (FDR) below 0.1. The GO heatmap in Fig. 3B was generated by removing GO redundancy manually and keeping only the most highly significant GO categories (P values ≤ 3.5 × 10⁻⁷). Heatmaps were plotted using The Institute For Genomic Research (TIGR) MultiExperiment Viewer (TMEV) (62).
Permutation Test.
To assess the significance of the genes found commonly up-regulated at late compared with early time points in the four time series (R1, R3, R4, and R7 cell lines), we performed a permutation experiment using a JAVA program developed in-house by randomly selecting the number of genes found up-regulated in each time series among expressed genes in each time series and then calculating the overlap for 10,000 times. The distribution of the number of overlapping genes was plotted. As a result, the P value associated with finding X number of genes in the overlap was calculated as followed: (number of times X number of genes are found in the overlap +1)/10,001.
Correlation Network Analysis.
We first prioritized as seed genes the 121 genes (Dataset S2) that are commonly up-regulated at least 1.3-fold between early and late passages in the R1, R3, R4, and R7 cell lines. Because the R5 cell line reached a different late stable state, it was excluded from the first step of the analysis. Next, using datasets for all five time series, we searched for all genes with an expression profile similar to that of each of the seed profiles with a Pearson correlation coefficient ≥0.8. The final correlation coefficient was calculated by averaging the coefficients of correlation computed separately for each of the five time-series datasets. This procedure allows us to give equal weight to each dataset, given that they have slight differences in the number of analyzed time points. This analysis resulted in the identification of 121 seed modules. Only the modules composed of at least 10 genes sharing similar expression profiles were selected, resulting in 51 relevant modules (Dataset S6). After building a matrix of seeds and correlated gene profiles, we performed unsupervised hierarchical clustering with TM4 (Pearson correlation, average linkage clustering) and identified eight clusters associated with twi, Tsp66E, scf, Rps5b, tum, sty, sti, and Traf4 (the name of each cluster corresponds to the first gene of each cluster on the heatmap) (Dataset S6). We used Cytoscape version 3.1.0 to display the correlation network visually. A similar correlation network analysis was performed on the second list of genes generated using the criteria Padj <0.15. GO term enrichment on the eight clusters was performed using DAVID with the cutoffs P < 0.01 and FDR <10. Next, we selected the top eight GO terms and removed redundant terms (Dataset S8).
Comparison with the Cell Lines Analyzed by modENCODE.
Reads per kilobase of transcript per million reads mapped (RPKM) values were computed from count files using TopHat and Cufflinks, which were set up on the orchestra computing cluster of Harvard Medical School Research Computing Group. Spearman rank correlation distance was used to compare the end points (P16–P17) of the Ras cell lines (R1, R4, and R5) with the RNA-Seq data cell lines from modENCODE (29). The expression level of the seed genes were calculated from expression data from ref. 63 with levels defined as very low expression (1–3), low expression (4–10), moderate expression (11–25), moderately high expression (26–50), high expression (51–100), very high expression (101–1,000), and extremely high expression (>1,000).
Western Blotting.
Cell lysates were prepared using a standard cell extraction buffer supplemented with 1 mM PMSF, additional protease inhibitors (Sigma-Aldrich), and phosphatase inhibitors (Sigma-Aldrich). Lysates were centrifuged, and supernatants were used for analysis. Proteins were separated on polyacrylamide gels and were transferred to nitrocellulose membranes, which were blocked in Odyssey Blocking Buffer (LI-COR). Immunoblots were incubated with the antibodies rabbit anti-ERK and mouse anti-pERK (Cell Signaling Technology). We used the following secondary antibodies: IR dye 800 CW conjugated affinity-purified against rabbit IgG (goat) (Rockland) and Alexa Fluor 680 goat against mouse (A21057; Invitrogen). Blots were scanned using a LI-COR Odyssey Infrared.
Detection of Apoptotic Cells.
Apoptosis was detected by TUNEL assay using the In Situ Cell Death Detection Kit (Roche) as described by the manufacturer. Apoptotic cells were visualized with a fluorescent microscope.
Immunohistochemistry on Wing Discs.
Wing discs were dissected from third-instar larvae (72 h or greater) and were fixed in 4% (vol/vol) paraformaldehyde diluted in PBS (PBS pH 7.4) for 20 min, washed in PBS, blocked for 30 min in blocking buffer [PBS containing 0.2% Triton X-100 (PBT) containing 5% (wt/vol) BSA (Sigma-Aldrich)] and incubated overnight with the appropriate antibodies in blocking buffer at 4 °C. After overnight incubation, samples were rinsed three times for 15 min in 0.2% PBT and were incubated for 2 h with the appropriate Alexa-conjugated secondary antibody in blocking buffer. DAPI was used at a concentration of 1 μg/mL and was incubated with the secondary antibody. Tissues subsequently were rinsed three times for 15 min in PBT and were mounted in VECTASHIELD (Vector Laboratories). Antibodies used were anti-Twi (rat; 1:1,000), kindly provided by E. Wieschaus from the Department of Molecular Biology at Princeton University, and anti-PH3 (rabbit; 1:3,000; Millipore). Secondary antibodies (1:1,000) conjugated with Alexa Fluor 488 or Alexa Fluor 594 (Invitrogen) were used in all staining procedures. Zeiss confocal point scanning microscopy was used to acquire images, which were processed using Zeiss software.
Immunohistochemistry on Cells.
Cells were grown on coverslips in six-well plates and were processed for antibody staining using myosin and tropomyosin antibodies (rat, 1:500) from the Babraham Institute. Cells were washed once in PBS and fixed for 20 min in 4% (vol/vol) paraformaldehyde in PBS, then were rinsed briefly in PBS and were washed three times for 5 min in PBS. PBT was used to permeabilize the cells. Cells were washed three times in PBS, blocked for 1 h, and then incubated with primary antibody in blocking buffer overnight at 4 °C. Cells then were washed three times in PBS and were incubated for 1 h at room temperature with secondary antibodies. After three washes in PBS, the cells were mounted in VECTASHIELD (Vector Laboratories). All secondary antibodies were from Invitrogen.
RNA Isolation, Reverse Transcription, and Real-Time qPCR.
RNA was isolated by guanidinium thiocyanate-phenol-chloroform extraction using TRIzol (Life Technologies). Genomic DNA was eliminated through gDNA Eliminator spin columns (QIAGEN), and samples were processed for cleanup with an RNeasy Plus Kit (QIAGEN). One microgram of purified RNA was incubated with a mix of oligo(dT) and random hexamer primers and with iScript RT (iScript cDNA Synthesis Kit; Bio-Rad) for cDNA synthesis. cDNA was used as the template for amplification, using validated primers in iQ SYBR Green Supermix with a CFX96 real-time PCR detection system (Bio-Rad). Query gene expression was relative to a control sample, normalized to the expression of three reference genes: ribosomal protein L32, alpha-tubulin, and Gapdh1, using the ΔΔC(t) analysis method.
Drug and Ecdysone Treatments.
Cells were seeded in six-well plates 24 h before drug treatments. The MEK inhibitor U0126 (Promega) was used at 10 μM and triggered cell death after 24 h. No apparent effect was observed in the cells treated with the Akt inhibitor 1L6-Hydroxymethyl-chiro-I, used at 20 μM, and the two PI3K inhibitors LY294002 (Calbiochem), used at 20 μM, and Wortmannin (Calbiochem), used at 100 nM. Inhibition of the Notch pathway was achieved by treatment with the Notch inhibitor DAPT (Sigma-Aldrich) at 10 µM. Ecdysone (20-Hydroxyecdysone; Sigma-Aldrich) treatment was at 1 µg/mL. Cells treated with drugs subsequently were analyzed by qPCR or were stained with antibody as described above.
Drosophila Strains.
The following Drosophila stocks were used: tub-Gal80ts; Dmef2-Gal4 is described in ref. 64. The X-linked Gal4 driver 1151-Gal4 is active in adult muscle precursors (43). UAS-RasV12 is described in ref. 65. RNAi stocks for disrupting CG9650 (9650-R1 and 9650-R4) were from the National Institute of Genetics (NIG, Japan) Drosophila Stock Center.
Discussion
To uncover synexpression groups during immortalization of Drosophila embryonic cells, we generated high-resolution time-series profiling during the establishment of five cell lines. Analysis of temporal coexpression profiles identified transcriptional signatures suggesting an AMP origin for the cells. We revealed that the immortalized cells can be differentiated in vitro. Finally, we predicted by guilt-by-association analysis that the transcription factor CG9650 is a previously unidentified regulator of AMP proliferation and then validated the prediction.
Although the cultures were derived from whole embryos, the most frequently immortalized cells were related to AMPs, a stem cell-like population contributing to adult muscles (6, 7) that is specified during early embryogenesis (45). During embryogenesis, the MAPK pathway is a key regulator of the specification and survival of AMPs (27). Here we show that driving RasV12 expression in AMPs during larval proliferation induces an overproliferation phenotype. Taken together these in vivo observations are consistent with the common immortalization of AMP-like cells from embryonic cultures expressing RasV12. The generation of other progenitor-type cell lines such as gut progenitor cells might require a combination of oncogenes/tumor suppressors that would support epithelial proliferation. For example, expressing both RasV12 and wtsdsRNA successfully generated epithelial cell lines (46). Furthermore, different culture conditions (e.g., the addition of growth factors, insulin, or fly extract) might be needed for different cell types.
Despite sharing many markers and properties with AMPs, the immortalized cells are highly proliferative and continuously express RasV12, making them similar to a cancer stem cell-like state. Interestingly, the twi transcriptional module contains many genes that have mammalian orthologs associated with cancers, notably rhabdomyosarcoma (RMS), a childhood muscle cancer. For example, Twi and htl/FGFR1 are overexpressed in primary RMS tumors (47), and kon/CSPG4 is expressed in RMS cell lines and patient material (48). Furthermore, nvy/ETO and CG9650/Bcl11a/b have been implicated in leukemia (49–51). Finally, trol/perlecan expression is up-regulated in RasV12 tumors and is associated with promoting tumor cell proliferation (34, 52).
Clustering analysis with the twi expression profile revealed many coexpressed genes with unknown function in AMPs. We show that one of them, CG9650, a zinc-finger–containing putative transcription factor expressed in AMPs (33), is required for AMP proliferation and is regulated by Notch signaling, which also is involved in AMP proliferation (7). In addition, the high correlation of CG9650 expression with twi (coefficient correlation >0.9) in all cell lines suggests that the transcription factor Twi might regulate CG9650 expression directly. This finding is consistent with previous ChIP-on-chip analyses identifying Twi cis-regulatory modules in the vicinity of the CG9650 promoter (38, 53) during embryonic mesoderm expression. The mammalian orthologs of CG9650, Bcl11a and Bcl11b, are Kr-like transcription factors that have been associated with the maintenance of lymphoid and ameloblast progenitors, respectively (54, 55). Bcl11b also is expressed in murine myogenic progenitors and disappears during differentiation, as is consistent with a possible conserved role in vertebrate muscle progenitor proliferation (56).
We show, for the first time to our knowledge, that immortalized Drosophila cells can be terminally differentiated in vitro into the myogenic lineage by treatment with the steroid hormone ecdysone, which is known to induce AMP differentiation in vivo (8). Despite the complexity of adult muscle differentiation (5), we show that the differentiated cells express markers of terminal muscle differentiation, such as mhc and Tm. Furthermore, contractile muscle cells were observed occasionally in the differentiated cultures. Consistently, our in vitro differentiation system recapitulates an in vivo regulation of adult muscle differentiation. For example, Mef2, an ecdysone target that plays a critical role in adult muscle differentiation (8), is also up-regulated by ecdysone in vitro.
Finally, in contrast to previously existing Drosophila cell lines obtained by spontaneous immortalization, the cell lines characterized in this study have been derived using a genetic method (3). Therefore, several manipulations can be implemented to improve the system. Using Gal4 lines driving expression in the population cell type of interest would make the process tissue specific and potentially faster, because it would direct the selection of the culture toward the desired final stage. At early stages of the culture, selecting cells expressing specific levels of GFP (correlated to RasV12 expression levels) also could stabilize the culture faster. In addition, the increased expression of PcG genes during immortalization suggests that affecting the epigenetic cell state, for example by expressing high levels of PcG in combination with RasV12, might facilitate the immortalization process. Finally, the use of an inducible system to control the expression of the oncogene would make it possible to limit the potential impact of continuous RasV12 expression on cell behavior and properties. Combined with the powerful Drosophila genetic tools, this newly characterized culture system opens the door for the establishment of progenitor lines of a desired genotype, amenable to cell-based assays to shed light on a variety of biological processes.
Methods
Details on sample generation and analysis (cell culture, preparation of Affymetrix array and RNA-Seq samples, data analysis including differential expression, PCA, permutation test, correlation network, clustering, GO enrichment), the fly strains used in this study, and protocols used for antibody staining, real-time qPCR, drug and ecdysone treatments, Western blotting, and TUNEL assay can be found in SI Methods.
Supplementary Material
Acknowledgments
We thank R. Binari, M. Kuroda, C. Pitsouli, B. Matthey-Prevot, R. Sopko, and R. Sugimura for critical reading of the manuscript; R. Gunage for advice on AMP dissections; the Microarray Core Facility of the Dana-Farber Cancer Institute; E. Wieschaus for providing anti-Twi antibody; and L. Pantano, A. Sjödin, and J. Hutchinson of the Harvard Chan Bioinformatics Core for assistance with analysis and suggestions. This work was supported in part by funding from the Starr Cancer Consortium. N.P. and G.J.H. are Investigators of the Howard Hughes Medical Institute.
Footnotes
The authors declare no conflict of interest.
Data deposition: Data have been deposited in the National Center for Biotechnology Information Gene Expression Omnibus (GEO), www.ncbi.nlm.nih.gov/geo/info/submission.html (accession no. GSE73354).
This article contains supporting information online at www.pnas.org/lookup/suppl/doi:10.1073/pnas.1517729112/-/DCSupplemental.
References
- 1.Jacob F, Perrin D, Sanchez C, Monod J. [Operon: A group of genes with the expression coordinated by an operator] C R Hebd Seances Acad Sci. 1960;250:1727–1729. [PubMed] [Google Scholar]
- 2.Niehrs C, Pollet N. Synexpression groups in eukaryotes. Nature. 1999;402(6761):483–487. doi: 10.1038/990025. [DOI] [PubMed] [Google Scholar]
- 3.Simcox A, et al. Efficient genetic method for establishing Drosophila cell lines unlocks the potential to create lines of specific genotypes. PLoS Genet. 2008;4(8):e1000142. doi: 10.1371/journal.pgen.1000142. [DOI] [PMC free article] [PubMed] [Google Scholar]
- 4.Currie DA, Bate M. The development of adult abdominal muscles in Drosophila: Myoblasts express twist and are associated with nerves. Development. 1991;113(1):91–102. doi: 10.1242/dev.113.1.91. [DOI] [PubMed] [Google Scholar]
- 5.Fernandes J, Bate M, Vijayraghavan K. Development of the indirect flight muscles of Drosophila. Development. 1991;113(1):67–77. doi: 10.1242/dev.113.1.67. [DOI] [PubMed] [Google Scholar]
- 6.Roy S, VijayRaghavan K. Muscle pattern diversification in Drosophila: The story of imaginal myogenesis. Bioessays. 1999;21(6):486–498. doi: 10.1002/(SICI)1521-1878(199906)21:6<486::AID-BIES5>3.0.CO;2-M. [DOI] [PubMed] [Google Scholar]
- 7.Gunage RD, Reichert H, VijayRaghavan K. Identification of a new stem cell population that generates Drosophila flight muscles. eLife. 2014;3:e03126. doi: 10.7554/eLife.03126. [DOI] [PMC free article] [PubMed] [Google Scholar]
- 8.Lovato TL, Benjamin AR, Cripps RM. Transcription of Myocyte enhancer factor-2 in adult Drosophila myoblasts is induced by the steroid hormone ecdysone. Dev Biol. 2005;288(2):612–621. doi: 10.1016/j.ydbio.2005.09.007. [DOI] [PubMed] [Google Scholar]
- 9.Dimova DK, Stevaux O, Frolov MV, Dyson NJ. Cell cycle-dependent and cell cycle-independent control of transcription by the Drosophila E2F/RB pathway. Genes Dev. 2003;17(18):2308–2320. doi: 10.1101/gad.1116703. [DOI] [PMC free article] [PubMed] [Google Scholar]
- 10.Neufeld TP, de la Cruz AF, Johnston LA, Edgar BA. Coordination of growth and cell division in the Drosophila wing. Cell. 1998;93(7):1183–1193. doi: 10.1016/s0092-8674(00)81462-2. [DOI] [PubMed] [Google Scholar]
- 11.Knudsen KE, Fribourg AF, Strobeck MW, Blanchard JM, Knudsen ES. Cyclin A is a functional target of retinoblastoma tumor suppressor protein-mediated cell cycle arrest. J Biol Chem. 1999;274(39):27632–27641. doi: 10.1074/jbc.274.39.27632. [DOI] [PubMed] [Google Scholar]
- 12.Nevins JR. The Rb/E2F pathway and cancer. Hum Mol Genet. 2001;10(7):699–703. doi: 10.1093/hmg/10.7.699. [DOI] [PubMed] [Google Scholar]
- 13.Edgar BA, Lehman DA, O’Farrell PH. Transcriptional regulation of string (cdc25): A link between developmental programming and the cell cycle. Development. 1994;120(11):3131–3143. doi: 10.1242/dev.120.11.3131. [DOI] [PMC free article] [PubMed] [Google Scholar]
- 14.Lane ME, et al. Dacapo, a cyclin-dependent kinase inhibitor, stops cell proliferation during Drosophila development. Cell. 1996;87(7):1225–1235. doi: 10.1016/s0092-8674(00)81818-8. [DOI] [PubMed] [Google Scholar]
- 15.Duronio RJ, O’Farrell PH. Developmental control of the G1 to S transition in Drosophila: Cyclin E is a limiting downstream target of E2F. Genes Dev. 1995;9(12):1456–1468. doi: 10.1101/gad.9.12.1456. [DOI] [PubMed] [Google Scholar]
- 16.Sprenger F, Yakubovich N, O’Farrell PH. S-phase function of Drosophila cyclin A and its downregulation in G1 phase. Curr Biol. 1997;7(7):488–499. doi: 10.1016/s0960-9822(06)00220-x. [DOI] [PMC free article] [PubMed] [Google Scholar]
- 17.Herr A, et al. Identification of E2F target genes that are rate limiting for dE2F1-dependent cell proliferation. Dev Dyn. 2012;241(11):1695–1707. doi: 10.1002/dvdy.23857. [DOI] [PMC free article] [PubMed] [Google Scholar]
- 18.Sparmann A, van Lohuizen M. Polycomb silencers control cell fate, development and cancer. Nat Rev Cancer. 2006;6(11):846–856. doi: 10.1038/nrc1991. [DOI] [PubMed] [Google Scholar]
- 19.Rajasekhar VK. Regulatory Networks in Stem Cells. Springer; New York: 2009. [Google Scholar]
- 20.Bello B, Holbro N, Reichert H. Polycomb group genes are required for neural stem cell survival in postembryonic neurogenesis of Drosophila. Development. 2007;134(6):1091–1099. doi: 10.1242/dev.02793. [DOI] [PubMed] [Google Scholar]
- 21.Lessard J, Sauvageau G. Bmi-1 determines the proliferative capacity of normal and leukaemic stem cells. Nature. 2003;423(6937):255–260. doi: 10.1038/nature01572. [DOI] [PubMed] [Google Scholar]
- 22.Valk-Lingbeek ME, Bruggeman SW, van Lohuizen M. Stem cells and cancer; the polycomb connection. Cell. 2004;118(4):409–418. doi: 10.1016/j.cell.2004.08.005. [DOI] [PubMed] [Google Scholar]
- 23.Li X, et al. Temporal patterning of Drosophila medulla neuroblasts controls neural fates. Nature. 2013;498(7455):456–462. doi: 10.1038/nature12319. [DOI] [PMC free article] [PubMed] [Google Scholar]
- 24.Buescher M, Hing FS, Chia W. Formation of neuroblasts in the embryonic central nervous system of Drosophila melanogaster is controlled by SoxNeuro. Development. 2002;129(18):4193–4203. doi: 10.1242/dev.129.18.4193. [DOI] [PubMed] [Google Scholar]
- 25.Bour BA, et al. Drosophila MEF2, a transcription factor that is essential for myogenesis. Genes Dev. 1995;9(6):730–741. doi: 10.1101/gad.9.6.730. [DOI] [PubMed] [Google Scholar]
- 26.Isshiki T, Takeichi M, Nose A. The role of the msh homeobox gene during Drosophila neurogenesis: Implication for the dorsoventral specification of the neuroectoderm. Development. 1997;124(16):3099–3109. doi: 10.1242/dev.124.16.3099. [DOI] [PubMed] [Google Scholar]
- 27.Figeac N, Jagla T, Aradhya R, Da Ponte JP, Jagla K. Drosophila adult muscle precursors form a network of interconnected cells and are specified by the rhomboid-triggered EGF pathway. Development. 2010;137(12):1965–1973. doi: 10.1242/dev.049080. [DOI] [PubMed] [Google Scholar]
- 28.Ranganayakulu G, et al. A series of mutations in the D-MEF2 transcription factor reveal multiple functions in larval and adult myogenesis in Drosophila. Dev Biol. 1995;171(1):169–181. doi: 10.1006/dbio.1995.1269. [DOI] [PubMed] [Google Scholar]
- 29.Cherbas L, et al. The transcriptional diversity of 25 Drosophila cell lines. Genome Res. 2010;21(2):301–314. doi: 10.1101/gr.112961.110. [DOI] [PMC free article] [PubMed] [Google Scholar]
- 30.Ui K, Ueda R, Miyake T. Cell lines from imaginal discs of Drosophila melanogaster. In Vitro Cellular Dev Biol Anim. 1987;23(10):707–711. doi: 10.1007/BF02620984. [DOI] [PubMed] [Google Scholar]
- 31.Bate M, Rushton E, Currie DA. Cells with persistent twist expression are the embryonic precursors of adult muscles in Drosophila. Development. 1991;113(1):79–89. doi: 10.1242/dev.113.1.79. [DOI] [PubMed] [Google Scholar]
- 32.Butler MJ, et al. Discovery of genes with highly restricted expression patterns in the Drosophila wing disc using DNA oligonucleotide microarrays. Development. 2003;130(4):659–670. doi: 10.1242/dev.00293. [DOI] [PubMed] [Google Scholar]
- 33.Krejcí A, Bernard F, Housden BE, Collins S, Bray SJ. Direct response to Notch activation: Signaling crosstalk and incoherent logic. Sci Signal. 2009;2(55):ra1. doi: 10.1126/scisignal.2000140. [DOI] [PubMed] [Google Scholar]
- 34.Herranz H, Weng R, Cohen SM. Crosstalk between epithelial and mesenchymal tissues in tumorigenesis and imaginal disc development. Curr Biol. 2014;24(13):1476–1484. doi: 10.1016/j.cub.2014.05.043. [DOI] [PubMed] [Google Scholar]
- 35.Lane TF, Sage EH. The biology of SPARC, a protein that modulates cell-matrix interactions. FASEB J. 1994;8(2):163–173. [PubMed] [Google Scholar]
- 36.Motamed K, et al. Fibroblast growth factor receptor-1 mediates the inhibition of endothelial cell proliferation and the promotion of skeletal myoblast differentiation by SPARC: A role for protein kinase A. J Cell Biochem. 2003;90(2):408–423. doi: 10.1002/jcb.10645. [DOI] [PubMed] [Google Scholar]
- 37.Petersson SJ, et al. SPARC is up-regulated during skeletal muscle regeneration and inhibits myoblast differentiation. Histol Histopathol. 2013;28(11):1451–1460. doi: 10.14670/HH-28.1451. [DOI] [PubMed] [Google Scholar]
- 38.Ciglar L. 2010. Drosophila myogenesis as a model for studying cis-regulatory networks: Identifying novel players and dissecting the role of transcriptional repression. Ph.D. thesis. (The Ruperto-Carola University of Heidelberg, Heidelberg)
- 39.McGovern VL, Pacak CA, Sewell ST, Turski ML, Seeger MA. A targeted gain of function screen in the embryonic CNS of Drosophila. Mech Dev. 2003;120(10):1193–1207. doi: 10.1016/s0925-4773(03)00159-x. [DOI] [PubMed] [Google Scholar]
- 40.Shalaby NA, et al. A screen for modifiers of notch signaling uncovers Amun, a protein with a critical role in sensory organ development. Genetics. 2009;182(4):1061–1076. doi: 10.1534/genetics.108.099986. [DOI] [PMC free article] [PubMed] [Google Scholar]
- 41.Zhu MY, Wilson R, Leptin M. A screen for genes that influence fibroblast growth factor signal transduction in Drosophila. Genetics. 2005;170(2):767–777. doi: 10.1534/genetics.104.039750. [DOI] [PMC free article] [PubMed] [Google Scholar]
- 42.Tseng AS, Hariharan IK. An overexpression screen in Drosophila for genes that restrict growth or cell-cycle progression in the developing eye. Genetics. 2002;162(1):229–243. doi: 10.1093/genetics/162.1.229. [DOI] [PMC free article] [PubMed] [Google Scholar]
- 43.Roy S, VijayRaghavan K. Patterning muscles using organizers: Larval muscle templates and adult myoblasts actively interact to pattern the dorsal longitudinal flight muscles of Drosophila. J Cell Biol. 1998;141(5):1135–1145. doi: 10.1083/jcb.141.5.1135. [DOI] [PMC free article] [PubMed] [Google Scholar]
- 44.Anant S, Roy S, VijayRaghavan K. Twist and Notch negatively regulate adult muscle differentiation in Drosophila. Development. 1998;125(8):1361–1369. doi: 10.1242/dev.125.8.1361. [DOI] [PubMed] [Google Scholar]
- 45.Ruiz Gómez M, Bate M. Segregation of myogenic lineages in Drosophila requires numb. Development. 1997;124(23):4857–4866. doi: 10.1242/dev.124.23.4857. [DOI] [PubMed] [Google Scholar]
- 46.Simcox A. Progress towards Drosophila epithelial cell culture. Methods Mol Biol. 2013;945:1–11. doi: 10.1007/978-1-62703-125-7_1. [DOI] [PMC free article] [PubMed] [Google Scholar]
- 47.Goldstein M, Meller I, Orr-Urtreger A. FGFR1 over-expression in primary rhabdomyosarcoma tumors is associated with hypomethylation of a 5′ CpG island and abnormal expression of the AKT1, NOG, and BMP4 genes. Genes Chromosomes Cancer. 2007;46(11):1028–1038. doi: 10.1002/gcc.20489. [DOI] [PubMed] [Google Scholar]
- 48.Brehm H, et al. A CSPG4-specific immunotoxin kills rhabdomyosarcoma cells and binds to primary tumor tissues. Cancer Lett. 2014;352(2):228–235. doi: 10.1016/j.canlet.2014.07.006. [DOI] [PubMed] [Google Scholar]
- 49.Weniger MA, et al. Gains of the proto-oncogene BCL11A and nuclear accumulation of BCL11A(XL) protein are frequent in primary mediastinal B-cell lymphoma. Leukemia. 2006;20(10):1880–1882. doi: 10.1038/sj.leu.2404324. [DOI] [PubMed] [Google Scholar]
- 50.Huang X, Du X, Li Y. The role of BCL11B in hematological malignancy. Exp Hematol Oncol. 2012;1(1):1–22. doi: 10.1186/2162-3619-1-22. [DOI] [PMC free article] [PubMed] [Google Scholar]
- 51.Nimer SD, Moore MA. Effects of the leukemia-associated AML1-ETO protein on hematopoietic stem and progenitor cells. Oncogene. 2004;23(24):4249–4254. doi: 10.1038/sj.onc.1207673. [DOI] [PubMed] [Google Scholar]
- 52.Jiang X, Couchman JR. 2003. Perlecan and tumor angiogenesis. J Histochem Cytochem 51(11):1393–1410.
- 53.Zinzen RP, Girardot C, Gagneur J, Braun M, Furlong EE. Combinatorial binding predicts spatio-temporal cis-regulatory activity. Nature. 2009;462(7269):65–70. doi: 10.1038/nature08531. [DOI] [PubMed] [Google Scholar]
- 54.Yu Y, et al. Bcl11a is essential for lymphoid development and negatively regulates p53. J Exp Med. 2012;209(13):2467–2483. doi: 10.1084/jem.20121846. [DOI] [PMC free article] [PubMed] [Google Scholar]
- 55.Katsuragi Y, et al. Bcl11b transcription factor plays a role in the maintenance of the ameloblast-progenitors in mouse adult maxillary incisors. Mech Dev. 2013;130(9-10):482–492. doi: 10.1016/j.mod.2013.05.002. [DOI] [PubMed] [Google Scholar]
- 56.Duong BB. 2014. Bcl11a and Bcl11b Regulation of the Decision for Murine Cells to Proliferate or Differentiate During Skeletal Muscle Development and Repair. Thesis (Barrett, The Honors College at Arizona State University, Tempe, AZ)
- 57.Li C, Wong WH. Model-based analysis of oligonucleotide arrays: Expression index computation and outlier detection. Proc Natl Acad Sci USA. 2001;98(1):31–36. doi: 10.1073/pnas.011404098. [DOI] [PMC free article] [PubMed] [Google Scholar]
- 58.Quinlan AR, Hall IM. BEDTools: A flexible suite of utilities for comparing genomic features. Bioinformatics. 2010;26(6):841–842. doi: 10.1093/bioinformatics/btq033. [DOI] [PMC free article] [PubMed] [Google Scholar]
- 59.Anders S, Huber W. Differential expression analysis for sequence count data. Genome Biol. 2010;11(10):R106. doi: 10.1186/gb-2010-11-10-r106. [DOI] [PMC free article] [PubMed] [Google Scholar]
- 60.Huang da W, Sherman BT, Lempicki RA. Systematic and integrative analysis of large gene lists using DAVID bioinformatics resources. Nat Protoc. 2009;4(1):44–57. doi: 10.1038/nprot.2008.211. [DOI] [PubMed] [Google Scholar]
- 61.Huang da W, Sherman BT, Lempicki RA. Bioinformatics enrichment tools: Paths toward the comprehensive functional analysis of large gene lists. Nucleic Acids Res. 2009;37(1):1–13. doi: 10.1093/nar/gkn923. [DOI] [PMC free article] [PubMed] [Google Scholar]
- 62.Saeed AI, et al. TM4: A free, open-source system for microarray data management and analysis. Biotechniques. 2003;34(2):374–378. doi: 10.2144/03342mt01. [DOI] [PubMed] [Google Scholar]
- 63.St Pierre SE, Ponting L, Stefancsik R, McQuilton P. FlyBase Consortium FlyBase 102--advanced approaches to interrogating FlyBase. Nucleic Acids Res. 2014;42(Database issue):D780–D788. doi: 10.1093/nar/gkt1092. [DOI] [PMC free article] [PubMed] [Google Scholar]
- 64.Owusu-Ansah E, Song W, Perrimon N. Muscle mitohormesis promotes longevity via systemic repression of insulin signaling. Cell. 2013;155(3):699–712. doi: 10.1016/j.cell.2013.09.021. [DOI] [PMC free article] [PubMed] [Google Scholar]
- 65.Karim FD, Rubin GM. Ectopic expression of activated Ras1 induces hyperplastic growth and increased cell death in Drosophila imaginal tissues. Development. 1998;125(1):1–9. doi: 10.1242/dev.125.1.1. [DOI] [PubMed] [Google Scholar]
Associated Data
This section collects any data citations, data availability statements, or supplementary materials included in this article.