

Significance
This work is the first demonstration, to our knowledge, of picosecond X-ray absorption spectroscopy to probe ligand binding to heme proteins in physiological media. By Fe K-edge absorption spectroscopy, we directly interrogate the active center of the protein, delivering insight into its electronic and geometric structure. In particular, we have investigated the evolution of the Fe center after photodissociation of NO from nitrosylmyoglobin (MbNO) and observed an intermediate over hundreds of picoseconds, which we propose to be the domed ligated form of MbNO that is formed on recombination of NO to the Fe atom. This work opens the way to a detailed investigation of metalloproteins using subpicosecond X-ray spectroscopy at free electron lasers.
Keywords: nitrosylmyoglobin, ligand binding, X-ray absorption, picosecond, pump–probe
Abstract
Diatomic ligands in hemoproteins and the way they bind to the active center are central to the protein’s function. Using picosecond Fe K-edge X-ray absorption spectroscopy, we probe the NO-heme recombination kinetics with direct sensitivity to the Fe-NO binding after 532-nm photoexcitation of nitrosylmyoglobin (MbNO) in physiological solutions. The transients at 70 and 300 ps are identical, but they deviate from the difference between the static spectra of deoxymyoglobin and MbNO, showing the formation of an intermediate species. We propose the latter to be a six-coordinated domed species that is populated on a timescale of ∼200 ps by recombination with NO ligands. This work shows the feasibility of ultrafast pump–probe X-ray spectroscopic studies of proteins in physiological media, delivering insight into the electronic and geometric structure of the active center.
Diatomic molecules, such as CO, NO, and O2, are the receptors that bind to and activate heme proteins. Among them, NO has been highlighted as a key biological messenger (1) and its level controls various physiological responses, such as NO synthases, message transduction (soluble guanylyl cyclases) (2, 3), NO transport and oxidation [hemoglobin, myoglobin (Mb), and nitrophorin] (4–6), and regulation of the NO/O2 balance (neuroglobin) (7, 8). In all of these cases, the heme group that binds the NO ligand is chemically identical, and therefore, variations in the reactivity and function are thought to be closely related to the spin, electronic configuration, and geometric structure on binding (9) and/or suggestive of different steric and electronic interactions of the bound NO with neighboring protein residues (10). Consequently, there is great interest in understanding the nature of NO binding to heme proteins and its biochemical role.
The binding kinetics of NO in Mb have been studied by a variety of time-resolved spectroscopic techniques. Ligand dissociation from the heme iron was triggered by excitation into either the Soret or the Q bands, whereas the ensuing dynamics were probed using transient absorption (TA) in the UV visible (UV-Vis) (11–20), the near IR (21–23), and the mid-IR (10, 23, 24) or by resonance Raman spectroscopy (20). For UV-Vis and near-IR TA spectroscopy, the signals are dominated by the π-orbitals of the porphyrin, whereas mid-IR TA of the NO stretch mode is sensitive to the orientation of the NO dipole. Resonance Raman spectroscopy maps several vibrational modes of the porphyrin, but most studies have focused on the important Fe-N stretch vibration (at 220 cm−1) with the proximal histidine (20, 25–27), which is sensitive to the position of the iron atom out of the heme plane and to the strain that the protein exerts on the heme through movements of the helices (28, 29).
All of the TA studies report multiexponential recombination kinetics with time constants spanning from subpicoseconds to several hundreds of picoseconds or even longer. Table S1 presents a compilation of these time constants, which vary somewhat with the spectroscopic observable. The shortest times (1–2 ps) have been attributed to vibrational relaxation, whereas the longer ones have been attributed to geminate recombination (GR), with two main groups: 10–40 and 130–300 ps (10, 12, 13, 16–18, 20, 21, 24). Based on temperature-dependent UV-Vis TA studies, Champion and coworkers (17) argued that the transition state associated with the fast recombination kinetics (8–15 ps) has no barrier and is caused by rebinding of NO from the center of the distal pocket very close to the iron. A barrierless recombination is thought to occur, because the unpaired NO electron forms a transition state with the antibonding dz2 orbitals without structural distortions of the protein matrix (17). The slow component in their work (170–200 ps) was assigned to recombination of NO from the more distant Xe4 pocket (30). The rebinding occurs on a similar timescale as the structural fluctuations of the protein architecture (13, 23, 28, 29), and therefore, relaxation of the active site after dissociation gives rise to a small time-dependent barrier (∼3 kJ mol−1) (17). From their mid-IR TA studies, Lim and coworkers (23, 24) similarly concluded that the slow recombination component (133 ps in their case) is caused by the protein environment surrounding the distal side of the heme, and conformational relaxation of the protein after photolysis may raise the barrier to NO rebinding. In both cases (long and short components), it was hypothesized that NO binds to an out-of-plane iron (domed porphyrin), in agreement with theoretical calculations (31–33). Finally, τ4 in Table S1 is due to the nongeminate recombination of NO molecules that have escaped out of the protein into the solvent.
Table S1.
Compilation of the timescales of NO recombination to the heme determined using various pump and probe schemes on excitation of MbNO
| Probe | Excitation wavelength (nm) | τ1 (ps) | τ2 (ps) | τ3 (ps) | τ4 (ns) | Source |
| UV-Vis TA* | 574 | 27.6 (52%) | 279.3 (48%) | 12 | ||
| UV-Vis TA* | Times change with mutation | 3–5 | 18.9 (41%) | 126.4 (49%) | ∞ (10%) | 11 |
| UV-Vis TA† | 570 | 9.1 (40%) | 200 (50%) | ∞ (10%) | 14 | |
| UV-Vis TA* | 564 | 2–4 | 13 (40%) | 148 (50%) | ∞ (10%) | |
| Resonance Raman† | 560–570 | 30 ± 10 | 20 | |||
| Near-IR TA‡ | 560–570 | 2–4 | 27.5 ± 5 (42%) | 293 ± 30 (33%) | ∞ (25%) | 21 |
| Visible TA‡ | 564 | 2–4 | 12 ± 3 (40%) | 205 ± 30 (37%) | ∞ (23%) | 21 |
| Mid-IR TA | — | 1 and 4 (35%) | 42 (29%) | 238 (36%) | 10 | |
| Mid-IR TA | 580 | 5.3 (54%) | 133 (46%) | 24 | ||
| UV-Vis TA§ | 400 | 1.8 (42%) | 13.8 (24%) | 200 (34%) | ∞ (<5%) | 16 |
| UV-Vis TA§ | 580 | 1.1 (50%) | 8 (30%) | 170 (20%) | 16 | |
| UV-Vis TA | 400 | 13.8 (41%) | 200 (59%) | 17 | ||
| UV-Vis TA | 580 | 8 (60%) | 170 (40%) | 17 | ||
| X-ray absorption | 532 | 192 ± 44 (75%) | >1.3 (25%) | This work |
Single-wavelength detection at 480 nm (Soret band).
Single-wavelength detection at 435 nm (Soret band).
Single-wavelength detection at 615 nm (Q bands).
White light continuum detection.
More recent studies by Negrerie and coworkers (20, 21) combined UV-Vis, near-IR (in the region of band III) TA, and resonance Raman measurements. The resonance Raman mainly probed the Fe-Nhistidine mode that is sensitive to the heme iron out-of-plane position, just like the near-IR band III (27). Although the UV-Vis TA results in the Soret and Q-band regions agree with the results in refs. 16 and 18, the resonance Raman results and the TA studies of band III reveal an additional ∼30-ps component [also reported in one of the mid-IR studies (10) and one UV-Vis TA study (12)]. Negrerie and coworkers (21) also concluded that GR leads to the formation of a transient six-coordinated domed heme, with a rise time of ∼10 ps and a decay of 30 ± 10 ps, corresponding to the return to the planar form. Thus, the transition from domed to planar is not a prompt one [contrary to the reverse process (34)], and Negrerie and coworkers (21) attributed its timescale to the constraints that the protein exerts on the porphyrin. Indeed, using picosecond UV resonance Raman studies of MbCO, Mizutani and coworkers (29) found that, on photodissociation of CO, the signal of the Tryptophan situated on the A helix showed a prompt decrease followed by a recovery in ∼50 ps that was attributed to changes in the protein tertiary structure that exerts strain on the heme–protein link. Negrerie and coworkers (20) studied other heme proteins and found that the timescale of the primary domed to planar heme transition was ∼15 ps for hemoglobin, ∼7 ps for dehaloperoxidase, and ∼6 ps for Cytochrome c (Cytc), and they attributed these timescales to the constraints exerted by the protein structure on the heme cofactor (20). Negrerie and coworkers (20) noted, however, that dehaloperoxidase and Cytc have similar time constants, despite their different structure and heme linking, revealing that several factors, not only the protein strain, can influence the heme response kinetics. Similar time constants were reported using IR TA by Lim and coworkers (22) for Cytc and a model heme, microperoxidase-8, but they attributed the faster ligand rebinding in Cytc compared with Mb to the fact that the former does not have a primary docking site-like structure that slows down NO rebinding.
On the theory side, Franzen (31) calculated potential curves along the Fe-NO distance for the different spin states of a compound consisting of an imidazole (Im) ligand bound to iron-porphine (FeP) trans to the diatomic NO ligand (Im-FeP-NO): the electronic ground state (S = 1/2) and the excited quartet (S = 3/2) and sextet (S = 5/2) states. For the planar geometry, Franzen (31) found, as expected for the ground state, that the doublet is the most stable configuration. The quartet is somewhat less binding, whereas the sextet state is even less binding with an Fe-NO equilibrium distance above 2 Å. Franzen (31) attributed the ∼10-ps component to the S = 5/2→S = 3/2 relaxation and the >100-ps timescale to a sequential relaxation S = 5/2→S = 3/2→S = 1/2 process. More refined calculations by Strickland and Harvey (32) found that the quartet state is the most likely state to be populated on recombination. Contrary to the works in refs. 16, 17, 23, and 24, these calculations exclusively invoke intramolecular electronic relaxation, neglect the role of the environment, and do not include the strain on the porphyrin.
Because the measured time constants somewhat vary with the observable (Table S1) and because the iron atom is the active site of the reaction, one would ideally like to probe it specifically. Time-resolved X-ray techniques seem most appropriate, because they can visualize the structure of the environment around the Fe atom. X-ray protein crystallography has been implemented on carboxy-Mb (MbCO), showing docking of the CO ligand at the Xe1 and Xe4 positions (35–37). However, solid samples are far from the physiological conditions under which proteins operate, and it is desirable to investigate the ligand dynamics of heme proteins in physiological solutions. In addition, the latter can be flowed continuously to ensure the renewal of the sample and to decrease the X-ray dose on it. Adopting such an approach, X-ray scattering studies of MbCO in solution with a 100-ps resolution were recently reported (38–40), but the spatial resolution is such that tertiary and global structural changes can be probed but not atomic-scale changes. In addition, this approach does not deliver information about the electronic structure of the active site, which plays a central role in the biochemistry and reactivity of heme proteins (41, 42). The valence 3d electrons of the iron atom are significantly delocalized over the porphyrin ligand π*-orbitals, and the ability of the heme to redistribute charge and spin density plays an important role in the formation and stabilization of a variety of intermediates important for biological function (42–44). Time-resolved X-ray absorption spectroscopy (XAS) (45) offers the advantage of interrogating the electronic and geometric structure of the biochemically active center of the system with elemental selectivity (i.e., the Fe atom). It was used to investigate the recombination of CO to Mb after its photodissociation from MbCO (46–48). In this case, ligand recombination occurs on times up to milliseconds (49), and the transient XAS was recorded using alternating intervals of data acquisition for the laser-excited sample at a 100-ps time delay and the unexcited sample, contrary to the pulse-to-pulse data acquisition where the unexcited and excited XASs are recorded sequentially (50). The resulting transient reflects the formation of the deoxy-Mb species (46), indicating the absence of GR of CO at this time delay. Very recently, Levantino et al. (51) reported a femtosecond XAS study of MbCO at the Fe K edge using the Stanford Free Electron Laser LCLS. Levantino et al. (51) presented kinetic traces exhibiting two time components (∼70 and ∼400 fs), which they tentatively attributed to a structural rearrangement induced by photolysis involving essentially only the heme chromophore and a residual Fe motion out of the heme plane that is coupled to the displacement of Mb F helix, respectively. However, without transient spectra, these conclusions are highly speculative.
The high-repetition rate scheme for picosecond XAS studies (46) was originally developed to investigate photoinduced processes in highly dilute media (52), such as proteins in physiological solutions, which have concentrations (1–4 mM) that are one to two orders of magnitude lower than those of the metal complexes that we investigated (50). Here, we show for the first time, to our knowledge, its implementation to address the nature of the recombination of NO to the porphyrin Fe atom with 70-ps resolution. Nitrosyl-Mb (MbNO) is excited at 532 nm into the Q bands, and the system is probed at the Fe K edge near 7.12 keV. We carried out two series of experiments under somewhat different conditions, which are both described in SI Experimental Details, Figs. S1–S3, and Tables S2–S4. The results of the second series confirmed those of the first and improved the signal to noise ratio. We find that, on dissociation of NO, the transient XAS spectrum deviates from the difference spectrum of the static deoxy-Mb and MbNO spectra (expected in case of full separation of NO from the heme) and that it does not change over hundreds of picoseconds, pointing to a species that is intermediate between MbNO and deoxy but closer to the latter in terms of electronic and geometric structure. These results are rationalized by the fact that the rate-determining step to ligand rebinding is the diffusion of NO in the protein, presumably from the Xe4 pocket (∼200 ps) as suggested in refs. 16 and 17, forming the domed hexacoordinated species, which relaxes to the planar configuration in ∼30 ps (20, 21). The experimental setups and sample preparation are described in SI Experimental Details. We also performed simulations of the transient X-ray absorption near-edge structure (XANES) spectra using multiple scattering theory (MST) (details in ref. 42 and SI Simulations of Transient XANES Spectra).
Fig. S1.

Comparison of the time-resolved XAS signal at 70-ps time of the different series of measurements: series I (red) and series II (black). The static difference spectrum is in blue. Norm. Trans. Abs., normalized transient absorption.
Fig. S3.
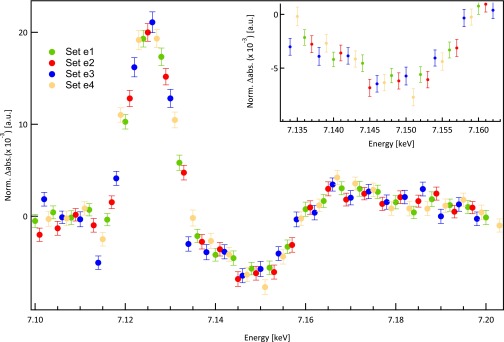
ei Sets of data points making up a full transient spectrum: e1 (Green), e2 (red), e3 (blue), and e4 (yellow). Note that not all datasets have been measured a similar number of times (details in Table S3). Therefore, the total number of scans for the whole transient spectrum is taken from e4, because it is less than or equal to the others. Additionally, this number is multiplied by two, because we have averaged the signal of two fluorescence APDs (number of full spectra in Table S3). Inset zooms into around 7.145 keV. The small difference in the size of error bars is because of the different number of scans for each dataset. Norm. abs., normalized absorption.
Table S2.
Experimental parameters of the two series (I and II) of measurements
| Series | Sample type (window thickness, optical path; μm) | Laser focus (μm2) | Laser fluence (mJ/cm2) | X-ray focus (μm2) | Incident X-ray photons per pulse | Detected X-ray (photons per point) | Sample stability |
| I | Flat diamond flow cell (50, 250) | 85 × 65 | 65 | 40 × 40 | 2 × 10⁴ | 5 × 10⁶ | 12 h |
| II* | Cylindrical quartz capillary (10–20, 300) | 70 × 70 | 24 | 30 × 30 | 2 × 10⁴ | 5 × 10⁶ | 24 h† |
Similar values for 300 ps.
The sample was rereduced every 4 h, and each time, the UV-Vis spectrum immediately showed characteristic Soret and Q bands of MbNO. After 24 h, a new sample was used.
Table S4.
Statistics of the two series of measurements
| Series | Time delay (ps) | Scan no. | Data acquisition time (s per scan per point) | Transient signal/edge jump of static signal (%) | Signal to noise ratio |
| I | 70 | 51 | 3.5 (100 points) | 2 | 15.4 |
| II | 70 | 294 | 3.0 (102 points)* | 2.3 | 19.5 |
| II | 300 | 322 | 3.0 (102 points)* | 1.2 | 16.8 |
The signal to noise ratio is defined as the division of signal level by one-half the error bar and given for an energy of 7.126 keV.
Note that the value of ∼3 s per point per scan is from ∼80 s and 25 data points for each dataset in Table S3. To calculate measuring time for each full spectrum, it multiplies by four (four datasets), and to calculate the total time of measurement, it multiplies by 147 scans for each APD.
Fig. 1A reproduces the normalized Fe K-edge steady-state spectra of deoxy-Mb and MbNO already discussed and analyzed in ref. 42. The preedge features are caused by dipole-forbidden but weakly allowed 1s-dσ and 1s-dπ transitions, the latter being mixed with ligand π-orbitals (42). These transitions draw their intensity from the dipole-allowed 1s-4p transition, because the 3d and 4p orbitals are mixed by the low symmetry of the heme environment (42). In the deoxy form, the 1s-dπ transition is weaker and does not contribute much to the spectrum, whereas transitions to the lower bonding orbitals are possible; they contain holes, because deoxy is a high-spin system. The edge is shifted to the lower energies compared with MbNO, which is typical of low- and high-spin ferrous systems and caused by an elongation of the Fe-N bonds (53, 54). Finally, the above edge features are also very different in the two systems and have been discussed in ref. 42.
Fig. 1.

(A) Steady-state Fe K-edge absorption spectra of MbNO and deoxy-Mb. (B) Transient spectrum (excited minus unexcited sample X-ray absorption) recorded 70 ps after excitation of the sample at 532 nm (○; with error bars). The difference of the deoxy-Mb minus MbNO (called the static difference spectrum) steady-state X-ray absorption spectra (A) is shown in red in B. Norm. Abs., normalized absorption.
Fig. 1B shows the XAS transient spectrum of a physiological solution of 4 mM MbNO recorded 70 ps after laser excitation of the Q bands at 532 nm. It is compared with the difference of the deoxy spectrum minus the MbNO spectrum, hereafter called static difference. Fig. S1 compares the results of the two series of measurements. Fig. S2 shows the transient spectra of the second series at 70- and 300-ps time delay along with the static difference spectrum. Within the limits of the signal to noise ratio, the two normalized experimental transients are identical. They exhibit changes in the preedge, the edge, and the postedge regions. A typical kinetic trace of these features (here for the signal at 7.125 keV) is shown in Fig. 2. It is best fitted with a biexponential function convoluted to a Gaussian function of 70-ps width, representing the X-ray pulse duration. The fit yields decay times (preexponential factors) of τ3 = 192 ± 44 ps (75%) and τ4 > 1.3 ns (25%). The 70-ps resolution hinders us from resolving the short decay times (τ1 and τ2 < 40 ps in Table S1), but the reported time constants are in good agreement with most optical studies (τ3 and τ4 in Table S1). Considering that the short component in our case integrates all of the first two decay times in the optical studies (Table S1), the ratio of the preexponential factors agrees well with these studies. Fig. 2 also shows that the high-repetition rate pump–probe scheme used here does not lead to sample damage compared with the 1-kHz repetition rate used in all previous laser-only studies. This finding is important for future optical pump/X-ray probe studies of hemoproteins in solution by either X-ray solution scattering or X-ray spectroscopy.
Fig. S2.

Comparison of transient spectra of MbNO at 70- (black) and 300-ps (green) time delays after excitation at 532 nm and the static difference spectrum (blue). The transients have been normalized to the maximum at 7.125 keV. Norm., normalized.
Fig. 2.

Kinetic trace of the maximum Fe K-edge absorption (Abs.) spectrum signal of MbNO on 532-nm excitation. Fitted timescales are τ1 = 192 ± 44 ps (75%) and τ2 > 1.3 ns (25%).
If ligand photodissociation was the only outcome of the reaction, such as in the case of MbCO (46, 48), the transient XAS spectrum would be expected to reflect the changes from MbNO to the unligated deoxy-Mb form, which is expressed as the static difference spectrum (Fig. 1B) weighed by the photolysis yield (55). However, deviations with the experimental transient are observed (i) between 7.13 and 7.14 keV, (ii) between 7.16 and 7.165 keV, and (ii) around 7.18 keV. Importantly, these deviations persist in the transient at 300-ps time delay (Fig. S2), although in the latter two regions, they are less clear cut because of a larger noise level. The deviations point to the formation of an intermediate species during the rebinding kinetics.
Based on the interpretation of the static spectra (42), it is possible to qualitatively assign the principal features of the picosecond transients as follows. (i) The negative preedge feature results from the decreased preedge absorption in the deoxy form because of its high-spin iron configuration [i.e., the antibonding dσ-orbitals, which are empty in the low-spin MbNO, become partially occupied in the deoxy form]. The former leads to a depleted absorption compared with MbNO. (ii) The main feature at 7.125 keV arises from the edge shift associated with deoxy-Mb. This shift is caused by the elongation of the porphyrin Fe-N distances in the high-spin state of deoxy-Mb. The fact that this feature does not show any change compared with the static difference spectrum points to a similar oxidation state of the intermediate with the deoxy-Mb compared with the ligated form MbNO. This result shows, in retrospect, that in this timescale (70–300 ps), any changes in the preedge region associated with the intermediate species are merely caused by an electronic redistribution within the d orbitals (56). (iii) Finally, the region between 7.14 and 7.16 keV is very sensitive to the ligand binding, which was discussed in ref. 42, and the fact that it is negative in the transient reflects the decreased absorption of deoxy-Mb–like species at these energies (Fig. 1A).
In summary, (i) the transient species has a somewhat similar geometric and electronic structure to deoxy-Mb. The most obvious interaction that would account for such an intermediate species is between the iron and the NO ligand, and it is, of course, weaker than in MbNO, because it bears several common features with deoxy-Mb. Based on previous studies, we conclude that it is the domed NO-ligated form (17, 20, 21, 31, 32). (ii) Our pulse width integrates the signals of the short components (<20 ps), and we detect both deoxy-Mb that has not yet recombined and the domed ligated form, but these components represent over 50% of the total signal (Table S1). This estimate implies that, at 70-ps time delay, we are mostly detecting domed ligated species. The fact that the transients are basically similar at 70 and 300 ps (Fig. S2) further supports this conclusion.
The weakness of the signal (i.e., the deviation from the static difference spectrum) is an important aspect of the above conclusion, because the only difference between the deoxy form and the ligated domed species is the presence of NO near the Fe atom. As the NO ligand consists of light elements, these atoms contribute only weakly to the XANES modulations, because the photoelectron backscattering efficiency is low. Ideally, we would like to extract the structure of the intermediate species from our transients; however, the most notable changes are all in the XANES region (up to ∼50 eV above the edge) and small, which makes a quantitative analysis very challenging. Indeed, it is known that the MST, used to calculate XANES and extended X-ray absorption fine structure (EXAFS) spectra, has serious limitations in the low-energy XANES region and is, at best, qualitative. Therefore, we refrain from doing so, and bearing in mind the limitation of MST, we performed simulations of the static difference spectrum (taking the simulated spectra from ref. 42) and the domed ligated species aimed at seeing if the observed trends are confirmed by theory. We take the quartet state of the domed ligated complex, which has a structure very similar to the deoxy form, except that the NO ligand sits at 2.93 Å from the Fe atom (SI Simulations of Transient XANES Spectra). Fig. 3 shows the experimental (Fig. 3, green) and simulated (Fig. 3, blue) static difference spectra, which give an idea about the precision of the MST calculations. Fig. 3, red shows the simulated transient for the domed ligated form, and the deviation from the static difference spectrum goes in the same direction as the experimental transient. However, we reiterate that, for this case, extracting definitive structural information from these calculations is not possible.
Fig. 3.

Simulated static difference spectrum (deoxy minus MbNO; blue) and transient spectrum (domed ligated minus MbNO; red) along with the experimental static difference spectrum (green). Details are in SI Simulations of Transient XANES Spectra. Norm. Abs, normalized absorption.
We can now rationalize the three types of timescales (typically <10, ∼30, and ∼200 ps) that were reported in laser-only studies and this study. Champion and coworkers (17) explain the <10-ps time constant as reflecting GR to the domed configuration because of nearby NOs, whereas the 200-ps time constant is attributed to the more distant NOs located in the Xe4 position (30). This interpretation is supported by the conclusions in the works by Lim and coworkers (23, 24) and Kholodenko et al. (18), which argued that the long component is determined by the relaxation of the protein.
Our results show that the entire kinetics up to ∼300 ps reflect the same intermediate species, which we identify as the domed ligated heme, relaxing in ∼30 ps back to the planar configuration according to the work in ref. 20. Thus, we conclude that the 200-ps timescale for the diffusion of NO (probably from the Xe4 position, which was suggested in ref. 17) to the Fe atom is the rate-limiting step for the formation of the domed species that then decays in 30 ps (20). Therefore, because the rise time of the intermediate is longer than its decay time, the former appears as a decay in the kinetics.
The resonance Raman experiment by Kruglik et al. (20) is specifically sensitive to the 30-ps component, which was missed in most IR or UV-Vis TA studies (Table S1). Interestingly, Kruglik et al. (20) report a rise of this component of ∼10 ps (i.e., they detect the fast-rising component of the domed ligated form caused by GR, amounting to about 50% of the entire recombining population) (τ2 in Table S1). The rest of the domed species is diluted in the 200-ps component, because as mentioned above, the rise is slower than the decay.
Kruglik et al. (20) associate the 30-ps relaxation of the domed ligated species to the constraints exerted by the protein on the porphyrin, whereas from his calculations of the model system Im-FeP-NO, Franzen (31) finds that, for an Fe doming of 0.2 Å (typical of the domed deoxy species), the highest excited state accessible on NO recombination to the Fe atom is the sextet state, which has an equilibrium distance of 2.85 Å, where it crosses the potential curves of the doublet (ground) state. The more recent calculations by Strickland and Harvey (32) rather suggest that the quartet state is more likely to be populated on recombination with an equilibrium distance of 2.93 Å. However, more important here are the conclusions by Franzen (31) of a sequential cascade among spin states that are invalidated by the similarity of our 70- and 300-ps transient spectra, unless the relaxation from a high- to a low-spin state is on the order of 100s ps or longer, which is unlikely.
Finally, the >1-ns component in this XAS study and previous optical studies (Table S1) is most probably caused by proteins that have lost the NO ligand to the surrounding solvent. Scheme 1 summarizes the results of this investigation and previous investigations (16, 17, 20, 23, 24).
Scheme 1.

Recombination of NO to the Mb heme after photolysis. Deoxy is the domed unligated protein, MbNO* represents the domed ligated form after recombination, and NOsolv represents the NO ligands that have escaped to the solvent.
This study shows the feasibility of picosecond XAS at high-repetition rates on biological systems in physiological solutions. Importantly, no radiation damage by either laser or X-ray is observed. Furthermore, we gain insight into the NO ligand dynamics and show that the domed MbNO* species is the only initial outcome of recombination, which is populated in ∼200 ps (because of recombination from distant NOs) and relaxes in ∼30 ps. The latter timescale is governed by the constraints exerted by the protein on the porphyrin. This work paves the way to an investigation of the short-time dynamics using ultrafast XAS and X-ray emission at X-ray Free Electron Lasers to address the nature of the electronic and spin state of the intermediate and its geometric structure.
SI Experimental Details
1.1. Sample Preparation.
Physiological solutions of MbNO of 4 mM concentration were used for the experiments. A lyophilized powder of equine skeletal muscle (95–100%; Sigma-Aldrich) Mb was dissolved in sodium phosphate buffer (100 mM, pH 7) without further purification to obtain solutions of unligated ferric Mb (referred to as met-Mb). To avoid any contact with oxygen, the solvent was previously degassed by bubbling it with nitrogen gas (purity >99%) for at least 10 h. MbNO was obtained by reducing a solution of met-Mb using a twofold molar excess of sodium dithionite (Na2S2O4) dissolved in degassed buffer. Immediately afterward, a twofold molar excess of sodium nitrite (NaNO2) in solution was added to the ferrous Mb under anaerobic conditions. All manipulations were done under nitrogen atmosphere, and the sample was kept in sealed glass bottles under nitrogen atmosphere during the experiments to prevent oxidation and the slow exchange of NO by the oxygen in the air.
1.2. Experimental Setup.
Static and time-resolved Fe K-edge XAS spectra of MbNO were collected at the MicroXAS Beamline at the Swiss Light Source (SLS). The source is a minigap in-vacuum undulator generating X-rays from 4 to 23 keV with a flux of ∼1012 photons per second per 0.015% bandwidth. Monochromatic X-rays were obtained by a double-crystal, fixed exit monochromator using an Si (111) crystal pair. An elliptically shaped X-ray mirror pair in the Kirkpatrick–Baez geometry, located immediately before the experimental station, was used to focus the X-rays in both directions to a micrometer spot size at the sample position (∼40 cm from the exit of the Kirkpatrick–Baez mirror unit). The X-ray energy was calibrated with an Fe foil, setting the energy of the first derivative of the XAS spectrum to 7.112 eV.
1.3. Time-Resolved XAS.
Time-resolved XAS was measured using the high-repetition rate pump–probe scheme (46). Photoexcitation was performed using a compact, high-average power Nd:YVO4 picosecond laser (Duetto; Time Bandwidth Products) delivering 532-nm/10-ps laser pulses at a 520-kHz repetition rate. The sample was probed using the isolated ∼70-ps-long X-ray pulse resulting from the hybrid electron-filling pattern at the SLS. The synchronization between the laser and X-ray pulses was done by locking the 500-MHz signal of the radio frequency (RF) cavities of the SLS to the laser oscillator using a commercial phase stabilization system (CLX-1100 Timing Stabilizer; Time Bandwidth Products). The timing jitter was less than 0.4 ps in these experiments. The relative time delay between laser and X-ray pulses was controlled electronically using a phase shifter. XAS transients were recorded at time delays of 70 and 300 ps after laser excitation. The transmitted X-rays through the sample were measured by a silicon photodiode, whereas the fluorescence signal was recorded by two large-area avalanche photodiodes (APDs) positioned at right angles to the incoming X-ray beam to minimize scattered light.
The MbNO solution was recirculated in a closed loop system using a peristaltic pump, and a secondary flow loop was used to monitor the UV-Vis spectrum of the sample, ensuring its integrity during the measurements. The MbNO sample was kept under nitrogen atmosphere to avoid degradation caused by slow substitution of the NO ligand by the O2 present in air.
Our study was carried in two series of experiments: the first (I) was part of the thesis work by Lima (57), whereas the second (II) was the results presented in this article that confirm those of series I by improving the signal to noise ratio. The experimental conditions of the two series are somewhat different as discussed hereafter.
In series I, the flow cell consisted of diamond windows (50-µm thickness) providing 250-µm optical path length. The flow rate of the MbNO solution was 60 mL/min. The incoming X-ray beam intensity (I0) was monitored by measuring the fluorescence and scatter generated by a thin (0.5-µm) Cr foil placed perpendicular to the X-ray beam using an APD. The focused X-ray spot size and laser spot size at the sample position were 40 × 40 and 85 × 65 µm2, respectively. The laser fluence was 100 mJ/cm2. However, in the green, the transmission through the windows is ∼65%, resulting in a fluence of ∼65 mJ/cm2 (2 W). The X-ray transmission near the Fe K edge through the 50-µm diamond window is about 90%. Some of these parameters are listed in Table S2.
In series II, the flow cell was a quartz glass double-funnel capillary (Hilgenberg GmbH), with wall thickness of 10–20 µm, a length of 85 ± 5 mm, and an optical path length of 300 µm that was carefully chosen for our 4-mM concentration sample. The sample was flowed at a rate of ∼80 mL/min (cross-sectional area of the flow channel is 0.07 mm2). An efficient cooling system was used to keep the sample reservoir at standard room temperature to prevent sample degradation. Because of the geometry considerations, we did not use an I0 APD detector but rather, a silicon photodiode to monitor I0 through the transmission signal. Indeed, for these dilute samples, the latter is a good representation of I0, because it does not show any recognizable pattern of Fe K-edge absorption. The focused X-ray spot size is 30 µm in diameter, which implies a probed volume of 2.12 × 10⁻⁴ mm3 considering the 0.3-mm optical path length. The laser fluence was 26 mJ/cm2 (530 mW) focused into a 70-µm diameter spot. The quartz capillary is totally transparent at 532 nm, and the X-ray transmission (through 10-µm thickness) is ∼90% near the Fe K edge.
Moreover, to avoid sample damage and its deposition on the wall of the quartz capillary, the latter was displaced vertically after each scan using a stage motor. In addition, Table S3 shows that 102 data points of the spectrum were measured in four different sets labeled ei (i = 1–4), each including ∼25 data points with a 4-eV step size but different energy ranges (in kiloelectronvolts): e1 (7.1, 7.2); e2 (7.101, 7.201); e3 (7.102, 7.202); and e4 (7.103, 7.203). A loop is defined as a set of 19 different spots on the capillary (i.e., the capillary is shifted vertically 19 times in front of the X-ray spot). Typical scans for each set are shown in Fig. S3. This way, we only measured each spot on the capillary during ∼80 s before moving to the next spot. Repeating this pattern for eight loops at a fixed time delay, we collected 294 scans at 70-ps (322 at 300-ps) time delay for the full spectrum from both fluorescence APDs without causing sample degradation and its deposition on the capillary wall and also, avoiding burning the capillary wall with laser.
Table S3.
Details of the data acquisition for series II
| Signal (ps) | Scan no. per set | No. of full spectra* | |||
| e1 | e2 | e3 | e4 | ||
| 70 | 175† (10 loops) | 166 (9 loops) | 147 (8 loops) | 147 (8 loops) | 147 × 2 = 294‡ |
| 300 | 163 (9 loops) | 162 (9 loops) | 163 (9 loops) | 161 (9 loops) | 161 × 2 = 322† |
ei (i = 1–4) Is the set of data points for energy scans. Each ei set includes ∼25 data points with 4-eV step size but different start and end points. These sets together cover the whole energy range of the spectrum (in kiloelectronvolts): e1 (7.1, 7.2); e2 (7.101, 7.201); e3 (7.102, 7.202); and e4 (7.103, 7.203). A loop is defined as measuring the energy list of 19 different spots on the capillary. The number of full spectra is e4 multiplied by two, because we have averaged the signal of two fluorescence APD.
Full spectrum is not simply the sum of the scan number of each list; instead, it is the minimum number of scans among ei lists.
Note that each energy list has a different contribution to the total averaged scan number. The e1 has the highest proportion of 27.6%, whereas the rest has 26.2% and 23.1%, respectively. This result leads to a smaller error bar for the e1 data points compare with those of e3 and e4 lists.
Averaged for both APDs.
Table S4 gives the details of the scans at 70- and 300-ps time delays. The signal to noise ratio has improved by a factor of 1.3 in series II, which resulted from (i) the longer data acquisition time, (ii) the minimization of sample damage using a lower laser power (0.53 vs. 2 W), (iii) a shorter scan time (80 s for ∼25 data points of ei) on each spot of the capillary but more frequently measured (in the conventional method, each scan of ∼100 data points takes 2–3 min, with a higher probability of sample damage); (iv) a higher flow rate of the sample in a longer closed loop; (v) an efficient cooling of the sample; and (vi) a closer positioning of APDs (i.e., larger solid angle for data collection).
The noise that we report for our data is the size of the error bars, which is obtained by the propagated SEs calculated for 520,000 shots per acquisition. [The SE estimates how repeated measurements on the same setup tend to be distributed around the “averaged value” and can be defined as the square root of the estimated error variance of the measured value (here, is intensity of the pumped/unpumped/difference signal).] Note that, because we are not counting photons, we do not assume shot noise in our experimental results. However, in fluorescence yield-detected XAS, the limited solid angle and the very low concentration of the sample result in very low photon fluxes (here, three photons per pulse), implying that we are close to shot noise and that the averaged errors from all of the scans and the shot noise are comparable.
Fig. S1 shows the transients obtained from series I and II at 70-ps time delay, as well as the static difference spectrum. As explained above, the data acquisition strategies of the two series are different. In series II and contrary to series I, we did not record I0 directly, but we monitored it through the transmission. Instead of correcting (i.e., dividing by I0) each individual scan, we kept the uncorrected data after making sure that there are neither glitches nor unexpected changes in I0. Moreover, to avoid introducing noise to the weak transient signal, only the averaged transient signal was normalized to the averaged edge jump (the latter is obtained from the I0 corrected averaged unpumped fluorescence signal). However, in cases of strong transient signal normally, each individual scan is normalized to its corresponding edge jump of the unpumped fluorescence signal. In both series, the transient signal level at 70 ps corresponds to less than 2% of the steady-state absorption (Table S4). The ratio of the transient signal level to the static signal is lower for 300 ps (0.012) because of the fact that the population of intermediates is smaller (the recombination timescale of the system is ∼200 ps) (Table S1). The transients in both series show the same trends and in particular, the deviation with the static difference spectrum around 7.145 keV.
In Fig. S2, we show the transient XAS signals with error bars at 70- and 300-ps time delays. The error bars are the result of averaging the scans described in Table S3. The total number of incoming X-ray pulses for the averaged spectrum (at 70 and 300 ps) is about 5 × 10¹⁰ pulses (considering 1.04-MHz repetition rate of incident X-ray beam at SLS), with 2 × 10⁴ photons per pulse. From the absorption coefficient obtained from the normalized static X-ray absorption spectrum , the edge jump of in the normalized static XAS data, and the value of the fluorescence yield () at Fe K edge ∼34% (0.333 ± 0.006) obtained from experimental data according to ref. 58, we can calculate the number of fluorescence photons detected per data point:
where and are the X-ray fluorescence intensities from the pumped and unpumped samples. This result corresponds to .
SI Simulations of Transient XANES Spectra
The structure used for the intermediate was obtained via a DFT(B3LYP*) (59–63) geometry optimization of the FeP-Im-NO complex in the quartet state (32) using the ORCA Quantum Chemistry Package (64). P is a porphine ring, and Im is an Im group. A density function2-triple zeta valence polarization functions (def2-TZVP) basis was set (65, 66) for all of the atoms. To account for the weak π–π interactions, the calculations were supplemented with the D3 dispersion correction by Grimme and coworkers (67, 68) with the Becke–Johnson damping scheme.
The structure of the quartet state is very similar to deoxy-Mb, the Fe-N bond to the proximal histidine is 2.30 Å (2.31 Å for deoxy-Mb in ref. 42), and the Fe-Np bond distances in the porphyrin ring are 2.06 Å (2.31 Å for deoxy-Mb in ref. 42). The displacement of the iron atom from the plane of the porphyrin ring (indicative of doming) is 0.15 Å (0.2 Å in deoxy-Mb). Finally, Fe-NO distance of the FeP-Im-NO complex in the quartet state is 2.93 Å.
The transient XAS spectra were simulated using the MST implemented within the FDMNES package (69) using a self-consistent potential of radius 6.0 Å around the absorbing atom. The interaction with the X-ray field was described using the electric quadrupole approximation. In the calculation, many body effects and the core hole lifetime broadening were accounted for using an arctangent convolution (70) of the form:
| [S1] |
where
| [S2] |
Here, Ef is the Fermi energy, and the parameters describing the arctangent are the total height Γmax = 15 eV, the inflection point Ectr − Ef = 30 eV, and the inclination of the arctangent El = 25 eV. Γhole is the core hole lifetime and was set to 1.81 eV.
Acknowledgments
We thank Fabio Santomauro for assistance during the experiments. We acknowledge the Paul Scherrer Institut for provision of synchrotron radiation beam time at Beamline MicroXAS of the Swiss Light Source. This work was supported by Swiss National Science Foundation (NSF) Grants 200021-116394, 200020-127231, and 200021-137596 and the National Centre for Competence in Research: Molecular Ultrafast Science and Technology (NCCR:MUST).
Footnotes
The authors declare no conflict of interest.
This article is a PNAS Direct Submission.
This article contains supporting information online at www.pnas.org/lookup/suppl/doi:10.1073/pnas.1424446112/-/DCSupplemental.
References
- 1.Griffith OW, Stuehr DJ. Nitric oxide synthases: Properties and catalytic mechanism. Annu Rev Physiol. 1995;57:707–736. doi: 10.1146/annurev.ph.57.030195.003423. [DOI] [PubMed] [Google Scholar]
- 2.Ignarro LJ, et al. Selective alterations in responsiveness of guanylate cyclase to activation by nitroso compounds during enzyme purification. Biochim Biophys Acta. 1981;673(4):394–407. doi: 10.1016/0304-4165(81)90471-2. [DOI] [PubMed] [Google Scholar]
- 3.White KA, Marletta MA. Nitric oxide synthase is a cytochrome P-450 type hemoprotein. Biochemistry. 1992;31(29):6627–6631. doi: 10.1021/bi00144a001. [DOI] [PubMed] [Google Scholar]
- 4.Ribeiro JMC, Hazzard JMH, Nussenzveig RH, Champagne DE, Walker FA. Reversible binding of nitric oxide by a salivary heme protein from a bloodsucking insect. Science. 1993;260(5107):539–541. doi: 10.1126/science.8386393. [DOI] [PubMed] [Google Scholar]
- 5.Ding XD, et al. Nitric oxide binding to the ferri- and ferroheme states of nitrophorin 1, a reversible NO-binding heme protein from the saliva of the blood-sucking insect, Rhodnius prolixus. J Am Chem Soc. 1999;121(1):128–138. [Google Scholar]
- 6.Bourassa JL, Ives EP, Marqueling AL, Shimanovich R, Groves JT. Myoglobin catalyzes its own nitration. J Am Chem Soc. 2001;123(21):5142–5143. doi: 10.1021/ja015621m. [DOI] [PubMed] [Google Scholar]
- 7.Wakasugi K, Nakano T, Morishima I. Oxidized human neuroglobin acts as a heterotrimeric Galpha protein guanine nucleotide dissociation inhibitor. J Biol Chem. 2003;278(38):36505–36512. doi: 10.1074/jbc.M305519200. [DOI] [PubMed] [Google Scholar]
- 8.Sun Y, Jin K, Mao XO, Zhu Y, Greenberg DA. Neuroglobin is up-regulated by and protects neurons from hypoxic-ischemic injury. Proc Natl Acad Sci USA. 2001;98(26):15306–15311. doi: 10.1073/pnas.251466698. [DOI] [PMC free article] [PubMed] [Google Scholar]
- 9.Coyle CM, et al. FeNO structure in distal pocket mutants of myoglobin based on resonance Raman spectroscopy. Biochemistry. 2003;42(34):4896–4903. doi: 10.1021/bi026395b. [DOI] [PubMed] [Google Scholar]
- 10.Zemojtel T, et al. NO-bound myoglobin: Structural diversity and dynamics of the NO ligand. J Am Chem Soc. 2004;126(7):1930–1931. doi: 10.1021/ja039086x. [DOI] [PubMed] [Google Scholar]
- 11.Cornelius PA, Hochstrasser RM, Steele AW. Ultrafast relaxation in picosecond photolysis of nitrosylhemoglobin. J Mol Biol. 1983;163(1):119–128. doi: 10.1016/0022-2836(83)90032-3. [DOI] [PubMed] [Google Scholar]
- 12.Petrich JW, et al. Ligand binding and protein relaxation in heme proteins: A room temperature analysis of NO geminate recombination. Biochemistry. 1991;30(16):3975–3987. doi: 10.1021/bi00230a025. [DOI] [PubMed] [Google Scholar]
- 13.Petrich JW, et al. Ultrafast measurements of geminate recombination of NO with site-specific mutants of human myoglobin. J Mol Biol. 1994;238(3):437–444. doi: 10.1006/jmbi.1994.1302. [DOI] [PubMed] [Google Scholar]
- 14.Shreve AP, Franzen S, Simpson MC, Dyer RB. Dependence of NO recombination dynamics in horse myoglobin on solution glycerol content. J Phys Chem B. 1999;103(37):7969–7975. [Google Scholar]
- 15.Rosca F, et al. Wavelength selective modulation in femtosecond pump-probe spectroscopy and its application to heme proteins. J Chem Phys. 2001;114(24):10884–10898. [Google Scholar]
- 16.Ye X, Demidov A, Champion PM. Measurements of the photodissociation quantum yields of MbNO and MbO(2) and the vibrational relaxation of the six-coordinate heme species. J Am Chem Soc. 2002;124(20):5914–5924. doi: 10.1021/ja017359n. [DOI] [PubMed] [Google Scholar]
- 17.Ionascu D, et al. Temperature-dependent studies of NO recombination to heme and heme proteins. J Am Chem Soc. 2005;127(48):16921–16934. doi: 10.1021/ja054249y. [DOI] [PMC free article] [PubMed] [Google Scholar]
- 18.Kholodenko Y, Gooding EA, Dou Y, Ikeda-Saito M, Hochstrasser RM. Heme protein dynamics revealed by geminate nitric oxide recombination in mutants of iron and cobalt myoglobin. Biochemistry. 1999;38(18):5918–5924. doi: 10.1021/bi983022v. [DOI] [PubMed] [Google Scholar]
- 19.Negrerie M, et al. Role of heme iron coordination and protein structure in the dynamics and geminate rebinding of nitric oxide to the H93G myoglobin mutant: Implications for nitric oxide sensors. J Biol Chem. 2006;281(15):10389–10398. doi: 10.1074/jbc.M513375200. [DOI] [PubMed] [Google Scholar]
- 20.Kruglik SG, et al. Picosecond primary structural transition of the heme is retarded after nitric oxide binding to heme proteins. Proc Natl Acad Sci USA. 2010;107(31):13678–13683. doi: 10.1073/pnas.0912938107. [DOI] [PMC free article] [PubMed] [Google Scholar]
- 21.Yoo BK, Kruglik SG, Lamarre I, Martin JL, Negrerie M. Absorption band III kinetics probe the picosecond heme iron motion triggered by nitric oxide binding to hemoglobin and myoglobin. J Phys Chem B. 2012;116(13):4106–4114. doi: 10.1021/jp300849y. [DOI] [PubMed] [Google Scholar]
- 22.Kim J, Park J, Lee T, Lim M. Dynamics of geminate rebinding of NO with cytochrome c in aqueous solution using femtosecond vibrational spectroscopy. J Phys Chem B. 2012;116(46):13663–13671. doi: 10.1021/jp308468j. [DOI] [PubMed] [Google Scholar]
- 23.Kim S, Lim M. Protein conformation-controlled rebinding barrier of NO and its binding trajectories in myoglobin and hemoglobin at room temperature. J Phys Chem B. 2012;116(20):5819–5830. doi: 10.1021/jp300176q. [DOI] [PubMed] [Google Scholar]
- 24.Kim S, Jin G, Lim M. Dynamics of geminate recombination of NO with myoglobin in aqueous solution probed by femtosecond mid-IR spectroscopy. J Phys Chem B. 2004;108(52):20366–20375. [Google Scholar]
- 25.Stavrov SS. The effect of iron displacement out of the porphyrin plane on the resonance Raman spectra of heme proteins and iron porphyrins. Biophys J. 1993;65(5):1942–1950. doi: 10.1016/S0006-3495(93)81265-7. [DOI] [PMC free article] [PubMed] [Google Scholar]
- 26.Zhu LY, Wang W, Sage JT, Champion PM. femtosecond time-resolved vibrational spectroscopy of heme-proteins. J Raman Spectrosc. 1995;26(7):527–534. [Google Scholar]
- 27.Stavrov SS. Correct interpretation of heme protein spectra allows distinguishing between the heme and the protein dynamics. Biopolymers. 2004;74(1-2):37–40. doi: 10.1002/bip.20039. [DOI] [PubMed] [Google Scholar]
- 28.Kitagawa T, Haruta N, Mizutani Y. Time-resolved resonance Raman study on ultrafast structural relaxation and vibrational cooling of photodissociated carbonmonoxy myoglobin. Biopolymers. 2002;67(4-5):207–213. doi: 10.1002/bip.10096. [DOI] [PubMed] [Google Scholar]
- 29.Sato A, Gao Y, Kitagawa T, Mizutani Y. Primary protein response after ligand photodissociation in carbonmonoxy myoglobin. Proc Natl Acad Sci USA. 2007;104(23):9627–9632. doi: 10.1073/pnas.0611560104. [DOI] [PMC free article] [PubMed] [Google Scholar]
- 30.Tilton RF, Jr, Kuntz ID, Jr, Petsko GA. Cavities in proteins: Structure of a metmyoglobin-xenon complex solved to 1.9 A. Biochemistry. 1984;23(13):2849–2857. doi: 10.1021/bi00308a002. [DOI] [PubMed] [Google Scholar]
- 31.Franzen S. Spin-dependent mechanism for diatomic ligand binding to heme. Proc Natl Acad Sci USA. 2002;99(26):16754–16759. doi: 10.1073/pnas.252590999. [DOI] [PMC free article] [PubMed] [Google Scholar]
- 32.Strickland N, Harvey JN. Spin-forbidden ligand binding to the ferrous-heme group: Ab initio and DFT studies. J Phys Chem B. 2007;111(4):841–852. doi: 10.1021/jp064091j. [DOI] [PubMed] [Google Scholar]
- 33.Radoń M, Broclawik E, Pierloot K. Electronic structure of selected FeNO7 complexes in heme and non-heme architectures: A density functional and multireference ab initio study. J Phys Chem B. 2010;114(3):1518–1528. doi: 10.1021/jp910220r. [DOI] [PubMed] [Google Scholar]
- 34.Petrich JW, Poyart C, Martin JL. Photophysics and reactivity of heme proteins: A femtosecond absorption study of hemoglobin, myoglobin, and protoheme. Biochemistry. 1988;27(11):4049–4060. doi: 10.1021/bi00411a022. [DOI] [PubMed] [Google Scholar]
- 35.Schotte F, et al. Watching a protein as it functions with 150-ps time-resolved x-ray crystallography. Science. 2003;300(5627):1944–1947. doi: 10.1126/science.1078797. [DOI] [PubMed] [Google Scholar]
- 36.Schotte F, Soman J, Olson JS, Wulff M, Anfinrud PA. Picosecond time-resolved X-ray crystallography: Probing protein function in real time. J Struct Biol. 2004;147(3):235–246. doi: 10.1016/j.jsb.2004.06.009. [DOI] [PubMed] [Google Scholar]
- 37.Bourgeois D, et al. Complex landscape of protein structural dynamics unveiled by nanosecond Laue crystallography. Proc Natl Acad Sci USA. 2003;100(15):8704–8709. doi: 10.1073/pnas.1430900100. [DOI] [PMC free article] [PubMed] [Google Scholar]
- 38.Cho HS, et al. Protein structural dynamics in solution unveiled via 100-ps time-resolved x-ray scattering. Proc Natl Acad Sci USA. 2010;107(16):7281–7286. doi: 10.1073/pnas.1002951107. [DOI] [PMC free article] [PubMed] [Google Scholar]
- 39.Kim KH, et al. Direct observation of myoglobin structural dynamics from 100 picoseconds to 1 microsecond with picosecond X-ray solution scattering. Chem Commun (Camb) 2011;47(1):289–291. doi: 10.1039/c0cc01817a. [DOI] [PMC free article] [PubMed] [Google Scholar]
- 40.Oang KY, et al. Conformational substates of myoglobin intermediate resolved by picosecond X-ray solution scattering. J Phys Chem Lett. 2014;5(5):804–808. doi: 10.1021/jz4027425. [DOI] [PMC free article] [PubMed] [Google Scholar]
- 41.Aziz EF, et al. Probing the electronic structure of the hemoglobin active center in physiological solutions. Phys Rev Lett. 2009;102(6):068103. doi: 10.1103/PhysRevLett.102.068103. [DOI] [PubMed] [Google Scholar]
- 42.Lima FA, et al. Probing the electronic and geometric structure of ferric and ferrous myoglobins in physiological solutions by Fe K-edge absorption spectroscopy. Phys Chem Phys. 2014;16(4):1617–1631. doi: 10.1039/c3cp53683a. [DOI] [PubMed] [Google Scholar]
- 43.Sono M, Roach MP, Coulter ED, Dawson JH. Heme-containing oxygenases. Chem Rev. 1996;96(7):2841–2888. doi: 10.1021/cr9500500. [DOI] [PubMed] [Google Scholar]
- 44.Wilson SA, et al. Iron L-edge X-ray absorption spectroscopy of oxy-picket fence porphyrin: Experimental insight into Fe-O2 bonding. J Am Chem Soc. 2013;135(3):1124–1136. doi: 10.1021/ja3103583. [DOI] [PMC free article] [PubMed] [Google Scholar]
- 45.Milne CJ, Penfold TJ, Chergui M. Recent experimental and theoretical developments in time-resolved X-ray spectroscopies. Coord Chem Rev. 2014;277–278(0):44–68. [Google Scholar]
- 46.Lima FA, et al. A high-repetition rate scheme for synchrotron-based picosecond laser pump/x-ray probe experiments on chemical and biological systems in solution. Rev Sci Instrum. 2011;82(6):063111. doi: 10.1063/1.3600616. [DOI] [PubMed] [Google Scholar]
- 47.Stickrath AB, et al. Detailed transient heme structures of Mb-CO in solution after CO dissociation: An X-ray transient absorption spectroscopic study. J Phys Chem B. 2013;117(16):4705–4712. doi: 10.1021/jp3086705. [DOI] [PubMed] [Google Scholar]
- 48.Mills DM, Lewis A, Harootunian A, Huang J, Smith B. Time-resolved X-ray absorption spectroscopy of carbon monoxide-myoglobin recombination after laser photolysis. Science. 1984;223(4638):811–813. doi: 10.1126/science.223.4638.811. [DOI] [PubMed] [Google Scholar]
- 49.Martin JL, Vos MH. Femtosecond biology. Annu Rev Biophys Biomol Struct. 1992;21:199–222. doi: 10.1146/annurev.bb.21.060192.001215. [DOI] [PubMed] [Google Scholar]
- 50.Chergui M. Picosecond and femtosecond X-ray absorption spectroscopy of molecular systems. Acta Crystallogr A. 2010;66(Pt 2):229–239. doi: 10.1107/S010876730904968X. [DOI] [PubMed] [Google Scholar]
- 51.Levantino M, et al. Observing heme doming in myoglobin with femtosecond X-ray absorption spectroscopya) Struct Dyn. 2015;2(4):041713. doi: 10.1063/1.4921907. [DOI] [PMC free article] [PubMed] [Google Scholar]
- 52.Reinhard M, et al. Photooxidation and photoaquation of iron hexacyanide in aqueous solution: A picosecond X-ray absorption study. Struct Dyn. 2014;1(2):024901. doi: 10.1063/1.4871751. [DOI] [PMC free article] [PubMed] [Google Scholar]
- 53.Briois V, Moulin CCD, Sainctavit P, Brouder C, Flank AM. Full multiple-scattering and crystal-field multiplet calculations performed on the spin transition Fe-Ii(Phen)(2)(Ncs)(2) complex at the iron K(2,3) and L(2,3) X-ray-absorption edges. J Am Chem Soc. 1995;117(3):1019–1026. [Google Scholar]
- 54.Gawelda W, et al. Structural determination of a short-lived excited iron(II) complex by picosecond x-ray absorption spectroscopy. Phys Rev Lett. 2007;98(5):057401. doi: 10.1103/PhysRevLett.98.057401. [DOI] [PubMed] [Google Scholar]
- 55.Bressler C, Abela R, Chergui M. Exploiting EXAFS and XANES for time-resolved molecular structures in liquids. Z Kristallogr. 2008;223(4-5):307–321. [Google Scholar]
- 56.Pierloot K, Vanpraet E, Vanquickenborne LG, Roos BO. Systematic ab-initio study of the ligand-field spectra of hexacyanometalate complexes. J Phys Chem. 1993;97(47):12220–12228. [Google Scholar]
- 57.Lima FA. 2011. Investigation of physiological solutions of metalloproteins in a high-repetition rate picosecond x-ray absorption experiment. PhD thesis (École Polytechnique Fédérale De Lausanne, Lausanne, Switzerland)
- 58.Krause MO. Atomic radiative and radiationless yields for K-shells and L-shells. J Phys Chem Ref Data. 1979;8(2):307–327. [Google Scholar]
- 59.Vosko SH, Wilk L, Nusair M. Accurate spin-dependent electron liquid correlation energies for local spin-density calculations–a critical analysis. Can J Phys. 1980;58(8):1200–1211. [Google Scholar]
- 60.Lee C, Yang W, Parr RG. Development of the Colle-Salvetti correlation-energy formula into a functional of the electron density. Phys Rev B Condens Matter. 1988;37(2):785–789. doi: 10.1103/physrevb.37.785. [DOI] [PubMed] [Google Scholar]
- 61.Becke AD. Density-functional thermochemistry. 3. The role of exact exchange. J Chem Phys. 1993;98(7):5648–5652. [Google Scholar]
- 62.Stephens PJ, Devlin FJ, Chabalowski CF, Frisch MJ. Ab-initio calculation of vibrational absorption and circular-dichroism spectra using density-functional force-fields. J Phys Chem. 1994;98(45):11623–11627. [Google Scholar]
- 63.Reiher M, Salomon O, Hess BA. Reparameterization of hybrid functionals based on energy differences of states of different multiplicity. Theor Chem Acc. 2001;107(1):48–55. [Google Scholar]
- 64.Neese F. The ORCA program system. WIREs Comput Mol Sci. 2012;2(1):73–78. [Google Scholar]
- 65.Schafer A, Horn H, Ahlrichs R. Fully optimized contracted Gaussian-Basis sets for atoms Li to Kr. J Chem Phys. 1992;97(4):2571–2577. [Google Scholar]
- 66.Weigend F, Ahlrichs R. Balanced basis sets of split valence, triple zeta valence and quadruple zeta valence quality for H to Rn: Design and assessment of accuracy. Phys Chem Phys. 2005;7(18):3297–3305. doi: 10.1039/b508541a. [DOI] [PubMed] [Google Scholar]
- 67.Grimme S, Antony J, Ehrlich S, Krieg H. A consistent and accurate ab initio parametrization of density functional dispersion correction (DFT-D) for the 94 elements H-Pu. J Chem Phys. 2010;132(15):154104. doi: 10.1063/1.3382344. [DOI] [PubMed] [Google Scholar]
- 68.Grimme S, Ehrlich S, Goerigk L. Effect of the damping function in dispersion corrected density functional theory. J Comput Chem. 2011;32(7):1456–1465. doi: 10.1002/jcc.21759. [DOI] [PubMed] [Google Scholar]
- 69.Joly Y. X-ray absorption near-edge structure calculations beyond the muffin-tin approximation. Phys Rev B Condens Matter. 2001;63(12):125120-1-10. [Google Scholar]
- 70.Bunău O, Joly Y. Full potential x-ray absorption calculations using time dependent density functional theory. J Phys Condens Matter. 2012;24(21):215502. doi: 10.1088/0953-8984/24/21/215502. [DOI] [PubMed] [Google Scholar]